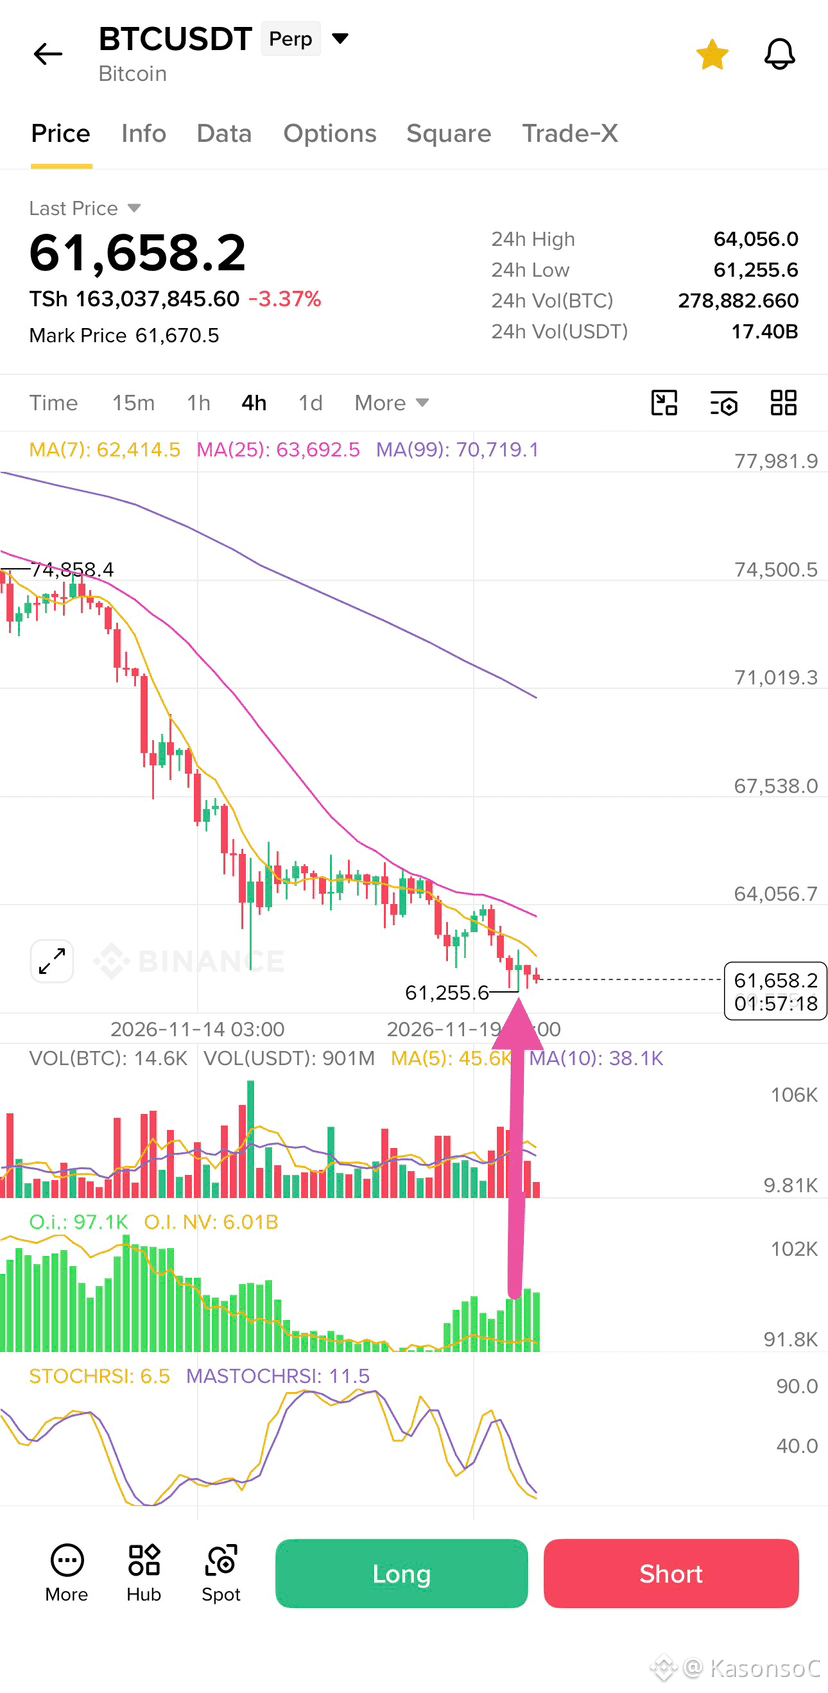

Look at 3 candles one green candle means price bounce while other following candles means bearish rejection because their bases are above from the green candle.
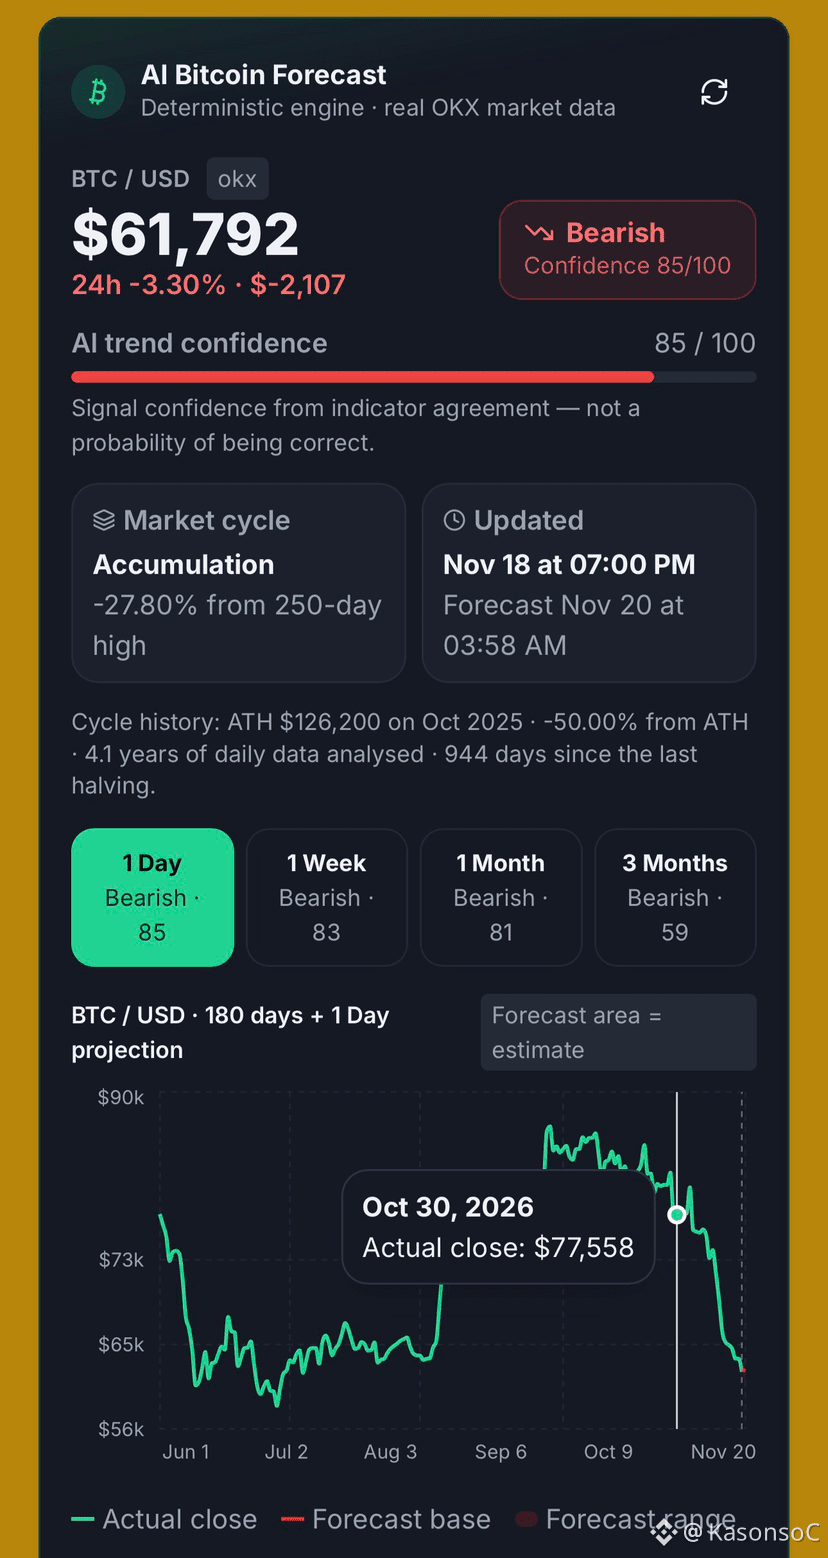
Looking at this structure tells us Market Structure is bullishness but on the other screenshot is showing Bearish still is active when we compare with SokoData tool.
$BTC $SOL $SUI
Looking at this structure tells us Market Structure is bullishness but on the other screenshot is showing Bearish still is active when we compare with SokoData tool.
$BTC $SOL $SUI