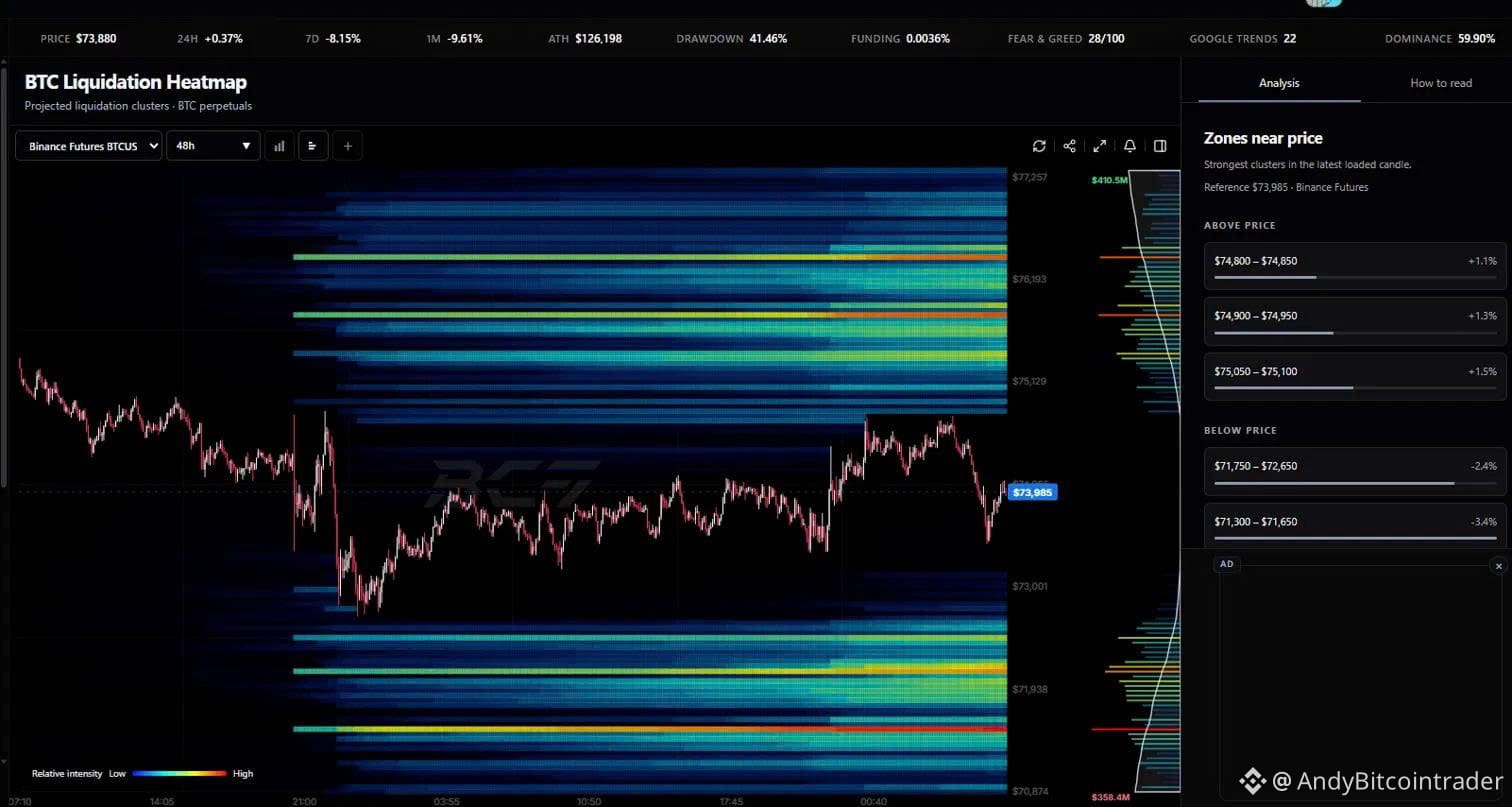
@All $BTC 12/11/2026 What's there?
Context: 24h +0.37%, 7D -8.15%, 1M -9.61%, funding +0.0036%, Fear & Greed 28. The 1-month trend is still downward, with fearful sentiment.
Total liquidity: approximately 410.5M above and 358.4M below. The liquidity above is slightly greater and closer to the price.
Above: the panel lists 74,800-74,850 (+1.1%), 74,900-74,950 (+1.3%), and 75,050-75,100 (+1.5%).
Farther up, the heatmap shows a yellow band at ~75,400 and the two strongest orange-red bands at ~75,850 and ~76,400.
Below: the panel shows 71,750-72,650 (-2.4%) and 71,300-71,650 (-3.4%).
On the heatmap, the yellow band at ~72,100 and the red band at ~71,520 are the strongest remaining clusters.$BTC
Context: 24h +0.37%, 7D -8.15%, 1M -9.61%, funding +0.0036%, Fear & Greed 28. The 1-month trend is still downward, with fearful sentiment.
Total liquidity: approximately 410.5M above and 358.4M below. The liquidity above is slightly greater and closer to the price.
Above: the panel lists 74,800-74,850 (+1.1%), 74,900-74,950 (+1.3%), and 75,050-75,100 (+1.5%).
Farther up, the heatmap shows a yellow band at ~75,400 and the two strongest orange-red bands at ~75,850 and ~76,400.
Below: the panel shows 71,750-72,650 (-2.4%) and 71,300-71,650 (-3.4%).
On the heatmap, the yellow band at ~72,100 and the red band at ~71,520 are the strongest remaining clusters.$BTC