

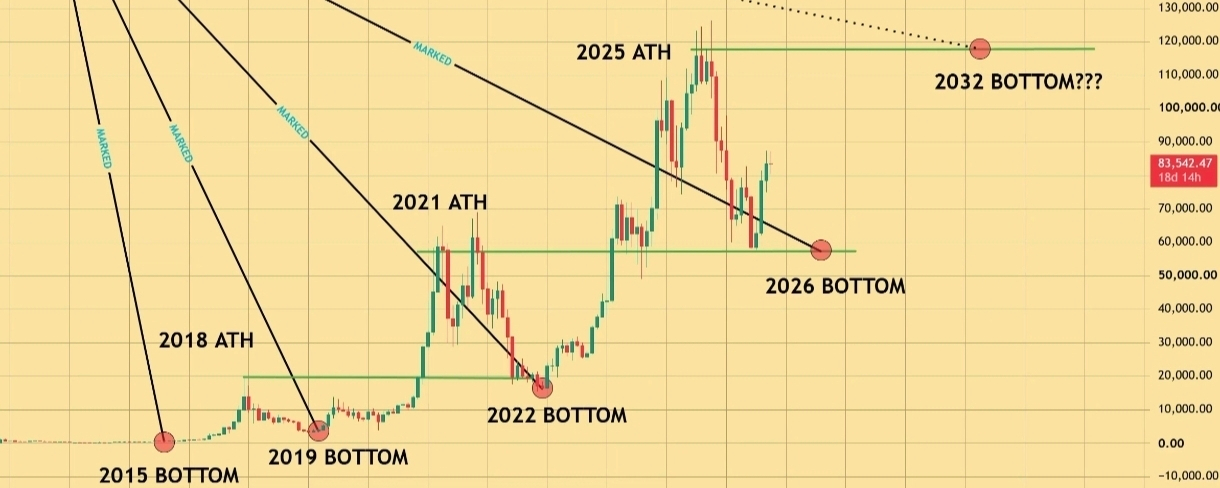

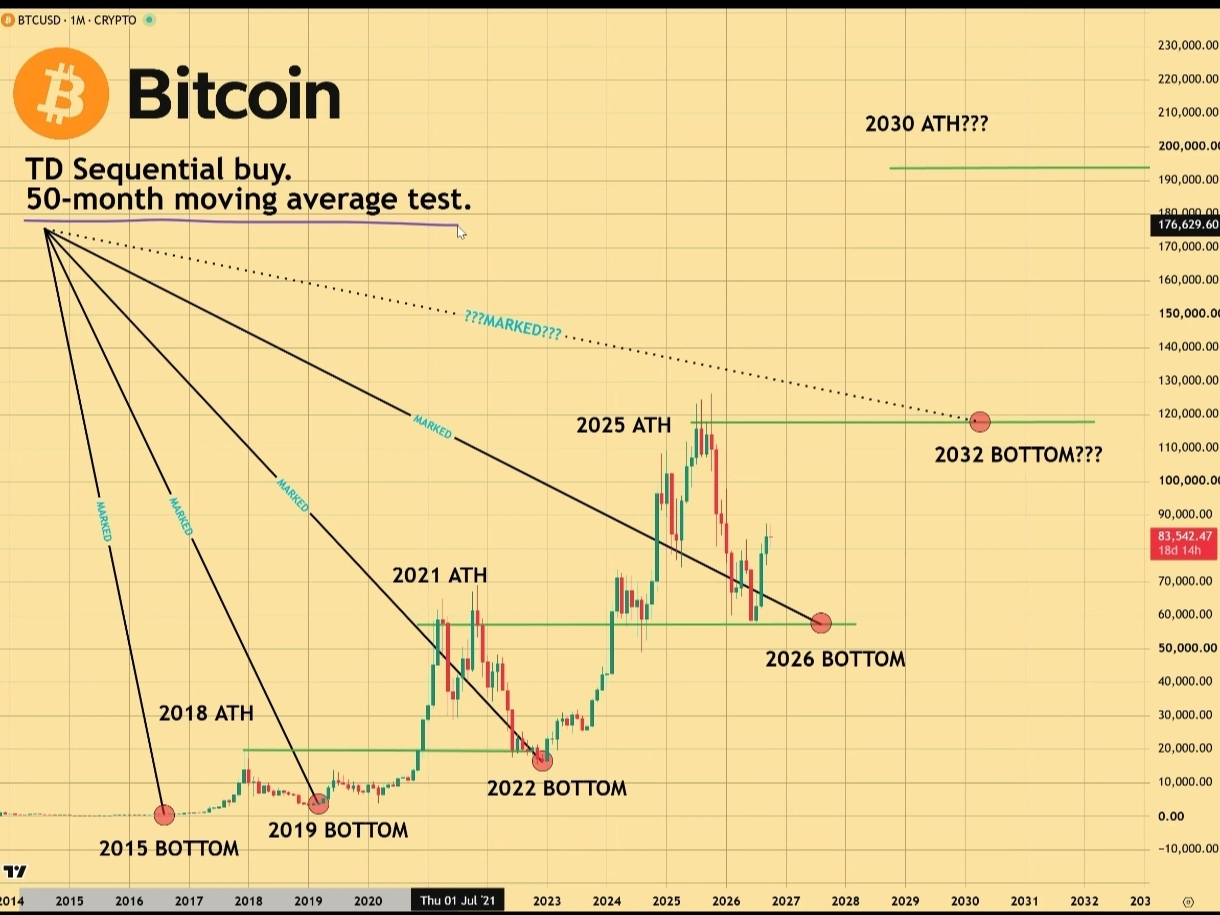
 $If you look at $BTC monthly (1M) chart cycle after cycle, there is a mathematical pattern that has repeated flawlessly since 2014:
2015 Bottom formed with precision off its peak trendline.
2019 Bottom followed the exact same pattern after the 2017/2018 peak.
2022 Bottom retested the projected area from the 2021 ATH.
Now, the TD Sequential Buy signal and the test of the 50-Month Moving Average area have appeared on the chart again. If this fractal projection line holds true once more, we might be witnessing the formation of the macro bottom before Bitcoin rallies toward new all-time highs in the future.
Every time a bottom forms, the majority of people say, "This time is different, the macro economy is terrible!" yet history proves that the biggest opportunities emerge at the moment of maximum fear.
💬 What’s your take?
Team HODL & Accumulate: Crypto’s historical pattern never lies, this is the prime entry zone!
Team Wait & See: There’s still potential for a deeper correction before the bull run continues.
Drop your thoughts in the comments below! 👇