#xrp
XRP Dominance Breaches Descending Wedge as Price Reclaims $1.60
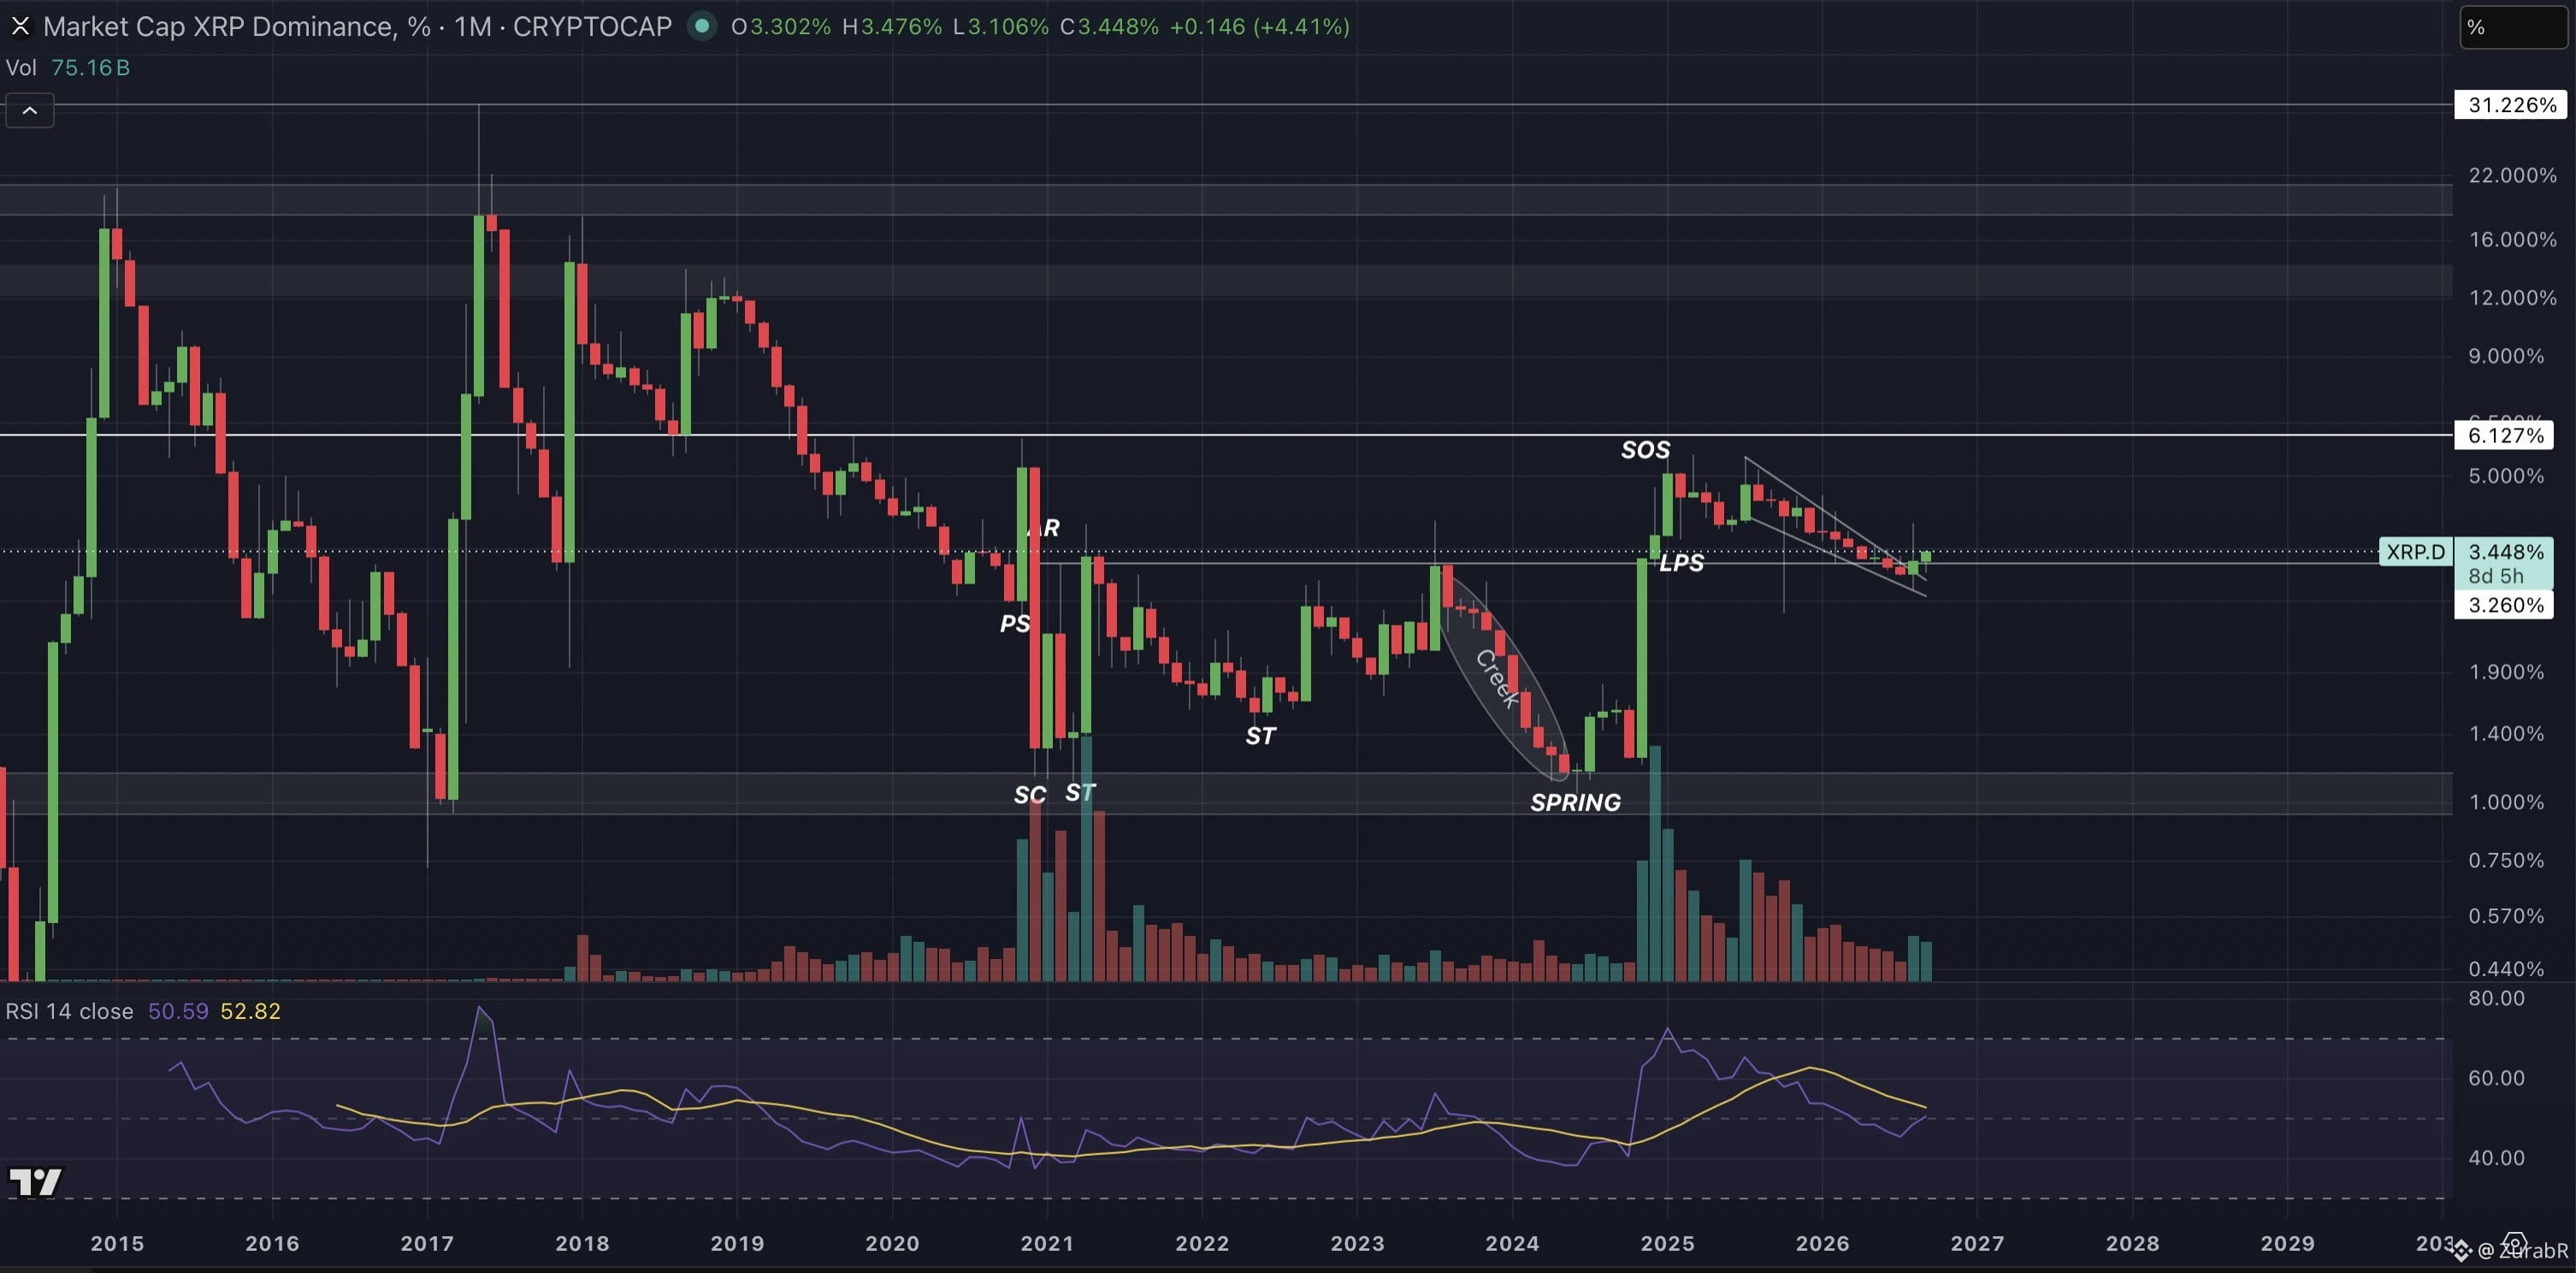
The $XRP dominance recently broke above a descending wedge structure on the monthly chart as the price reclaims $1.6.
xrp dominance is showing signs of recovery as xrp rebounds alongside the broader crypto market. xrp fell to $1.25 on Sept. 16 before recovering to $1.63 a week later. During the same period, xrp dominance climbed from 3.106% to 3.448%.
The recovery has brought back focus to $XRP’s market share, with market analyst CryptoInsightUK calling attention to several developments on the xrp dominance chart that may be worth noting.
xrp Dominance Recovers After a Major Decline
CryptoInsightUK’s analysis highlights a possible Wyckoff accumulation that he believes completed its spring phase in 2024. The spring followed a sharp decline in xrp dominance, which dropped from 3.218% in July 2023 to 1.046% by June 2024.
xrp dominance then recovered and moved above the previous accumulation range to enter the sign of strength (SoS) phase. The move eventually took xrp dominance to 5.582% in January 2025. Since then, the metric has mostly moved sideways, and CryptoInsightUK believes it has not fully left the SoS phase.
This period of consolidation also produced a descending wedge on the monthly chart. xrp dominance has now broken above that pattern, having surged to 3.448% at the time of the analysis.
$XRP Dominance Breaks Above 12-Month Wedge
The descending wedge started forming after xrp dominance fell from the peak of 5.528% in July 2025, which aligned with the all-time high price of $3.6 at the time.
XRP dominance continued falling from that point and spent around 12 months inside the descending wedge. During this period, xrp declined more sharply than the broader cryptocurrency market as the bear market that began in late 2025 continued into 2026.#Write2Earn #Xrp🔥🔥 $XRP
XRP Dominance Breaches Descending Wedge as Price Reclaims $1.60
The $XRP dominance recently broke above a descending wedge structure on the monthly chart as the price reclaims $1.6.
xrp dominance is showing signs of recovery as xrp rebounds alongside the broader crypto market. xrp fell to $1.25 on Sept. 16 before recovering to $1.63 a week later. During the same period, xrp dominance climbed from 3.106% to 3.448%.
The recovery has brought back focus to $XRP’s market share, with market analyst CryptoInsightUK calling attention to several developments on the xrp dominance chart that may be worth noting.
xrp Dominance Recovers After a Major Decline
CryptoInsightUK’s analysis highlights a possible Wyckoff accumulation that he believes completed its spring phase in 2024. The spring followed a sharp decline in xrp dominance, which dropped from 3.218% in July 2023 to 1.046% by June 2024.
xrp dominance then recovered and moved above the previous accumulation range to enter the sign of strength (SoS) phase. The move eventually took xrp dominance to 5.582% in January 2025. Since then, the metric has mostly moved sideways, and CryptoInsightUK believes it has not fully left the SoS phase.
This period of consolidation also produced a descending wedge on the monthly chart. xrp dominance has now broken above that pattern, having surged to 3.448% at the time of the analysis.
$XRP Dominance Breaks Above 12-Month Wedge
The descending wedge started forming after xrp dominance fell from the peak of 5.528% in July 2025, which aligned with the all-time high price of $3.6 at the time.
XRP dominance continued falling from that point and spent around 12 months inside the descending wedge. During this period, xrp declined more sharply than the broader cryptocurrency market as the bear market that began in late 2025 continued into 2026.#Write2Earn #Xrp🔥🔥 $XRP