📊 TECHNICAL ANALYSIS MONITORING — BSV/USDT
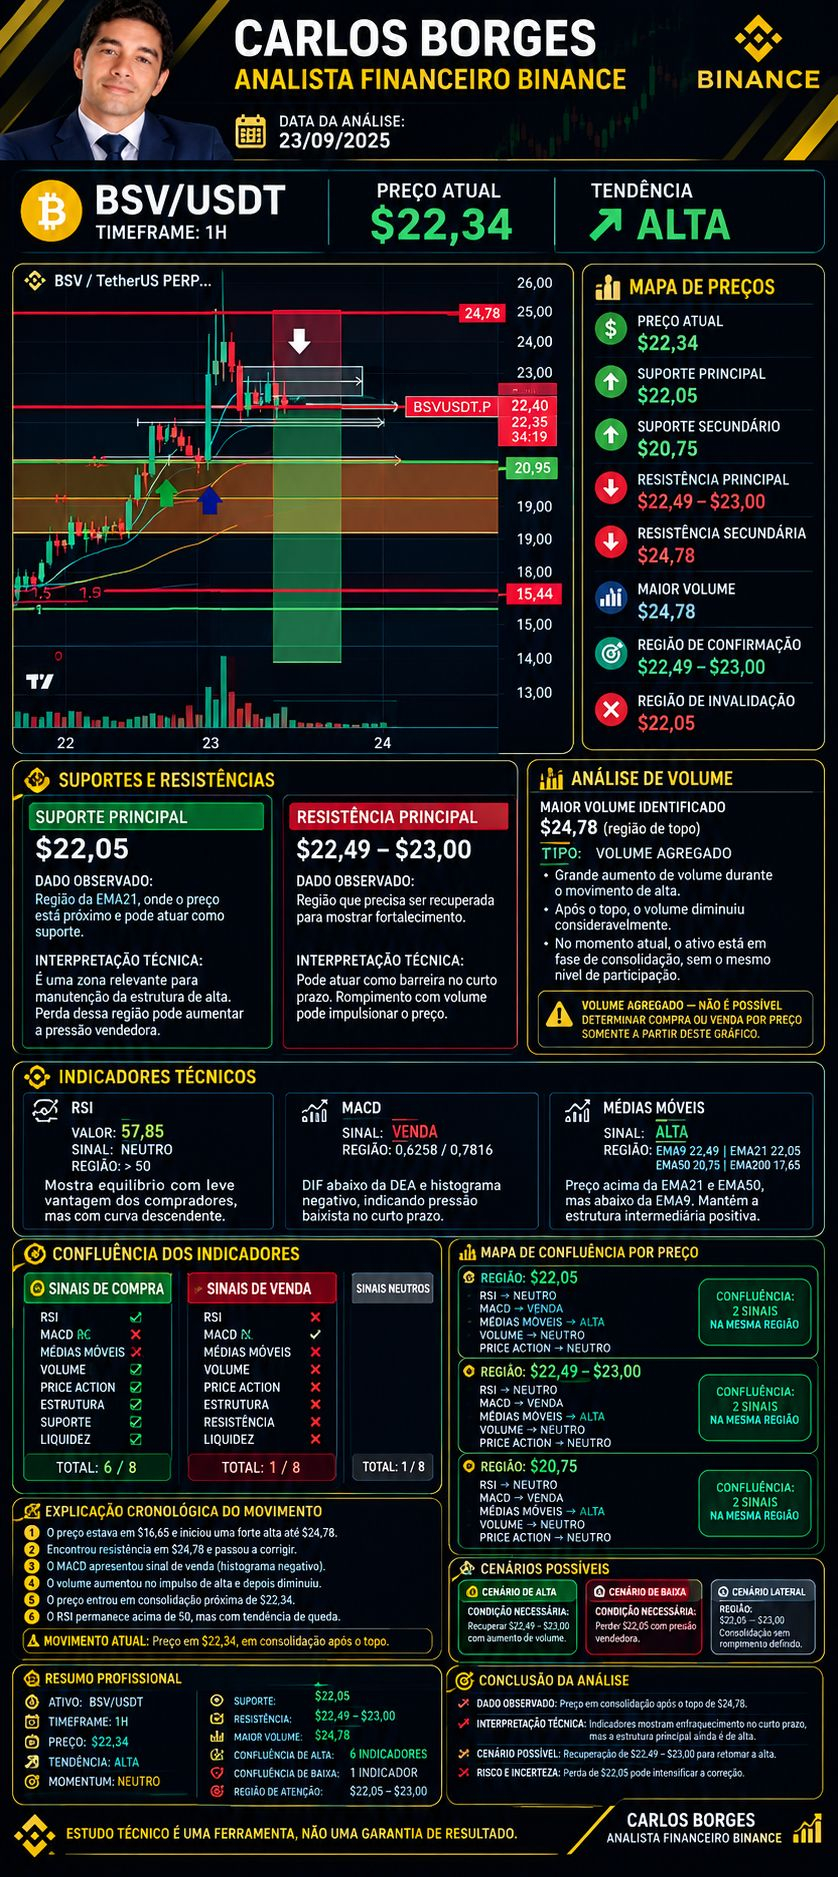
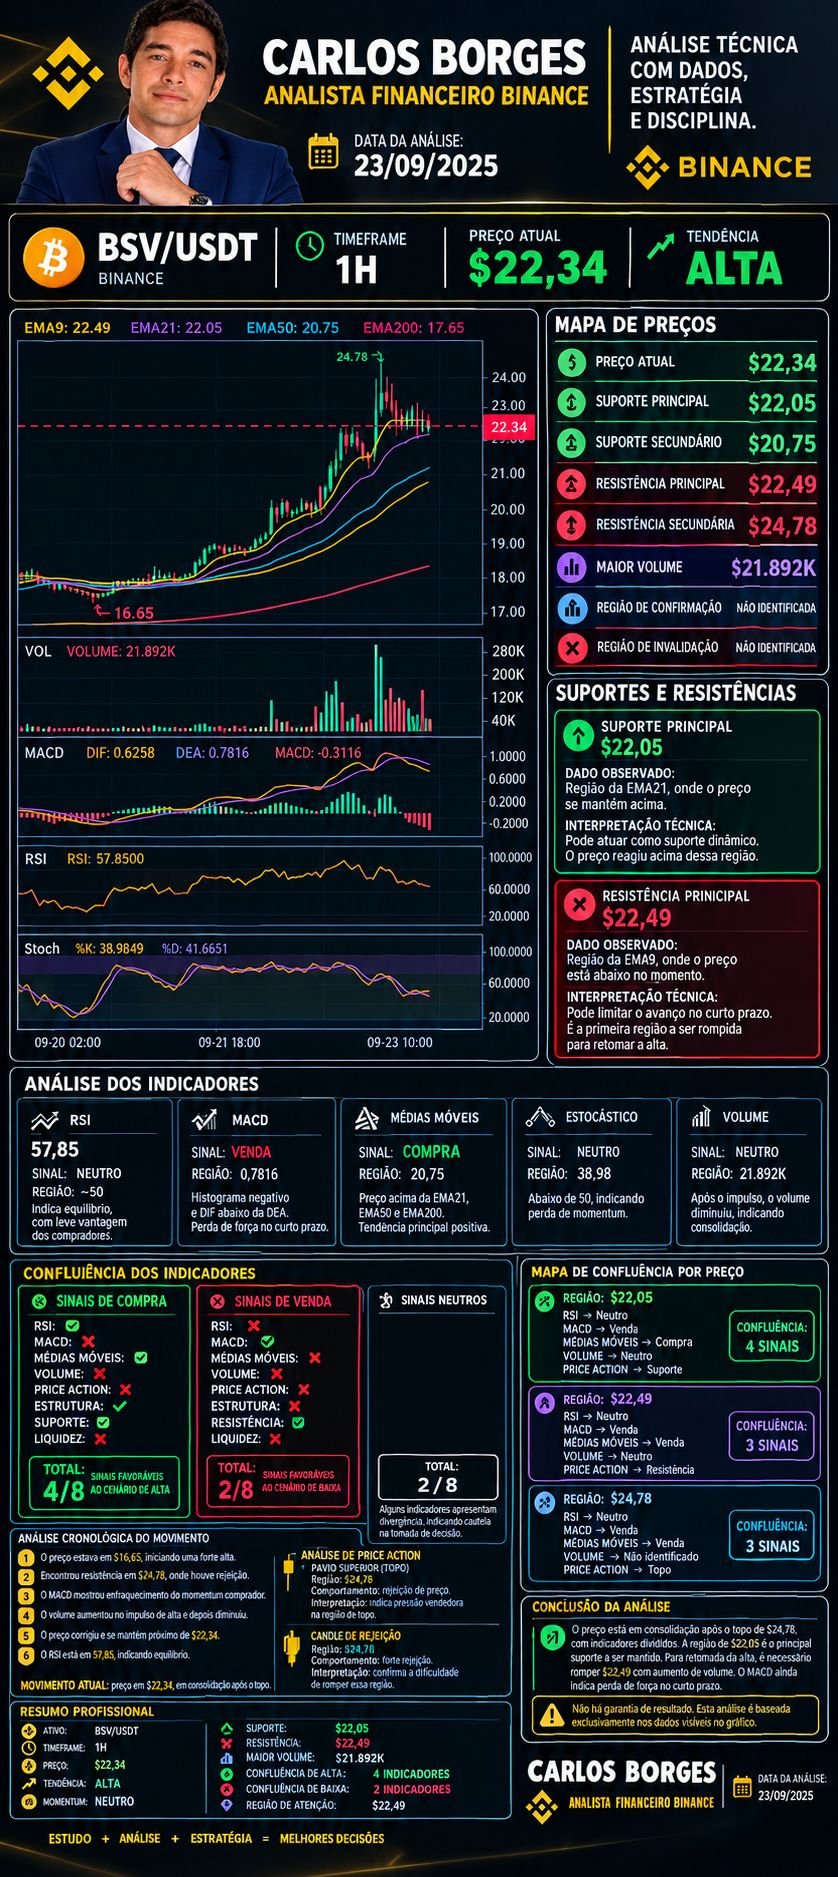
🔎 Active chart monitoring on the 1H timeframe, tracking the price evolution after the strong surge up to 24.78 USDT and the current consolidation region near 22.34 USDT.
🎯 KEY REGIONS UNDER OBSERVATION:
🟢 22.05 USDT: main support.
🟢 20.75 USDT: secondary support.
🔴 22.49–23.00 USDT: confirmation/recovery area.
🔴 24.78 USDT: resistance and observed peak.
📈 What to monitor:
Recovery and holding above 22.49–23.00.
Breakdown of 22.05 with selling pressure.
Increase or decrease in volume.
MACD, RSI, and moving averages development.
Breakout or rejection of the key regions.
Formation of new strong candles or rejection signals.
⚠️ CURRENT STATUS: consolidation after the peak, with the intermediate structure still bullish, but short-term momentum weakened.
📌 Monitoring objective: to identify confirmation of continuation, rejection, or a structural change before considering any scenario.
🔎 Active chart monitoring on the 1H timeframe, tracking the price evolution after the strong surge up to 24.78 USDT and the current consolidation region near 22.34 USDT.
🎯 KEY REGIONS UNDER OBSERVATION:
🟢 22.05 USDT: main support.
🟢 20.75 USDT: secondary support.
🔴 22.49–23.00 USDT: confirmation/recovery area.
🔴 24.78 USDT: resistance and observed peak.
📈 What to monitor:
Recovery and holding above 22.49–23.00.
Breakdown of 22.05 with selling pressure.
Increase or decrease in volume.
MACD, RSI, and moving averages development.
Breakout or rejection of the key regions.
Formation of new strong candles or rejection signals.
⚠️ CURRENT STATUS: consolidation after the peak, with the intermediate structure still bullish, but short-term momentum weakened.
📌 Monitoring objective: to identify confirmation of continuation, rejection, or a structural change before considering any scenario.