SOL/USDT Analysis (4h Chart)
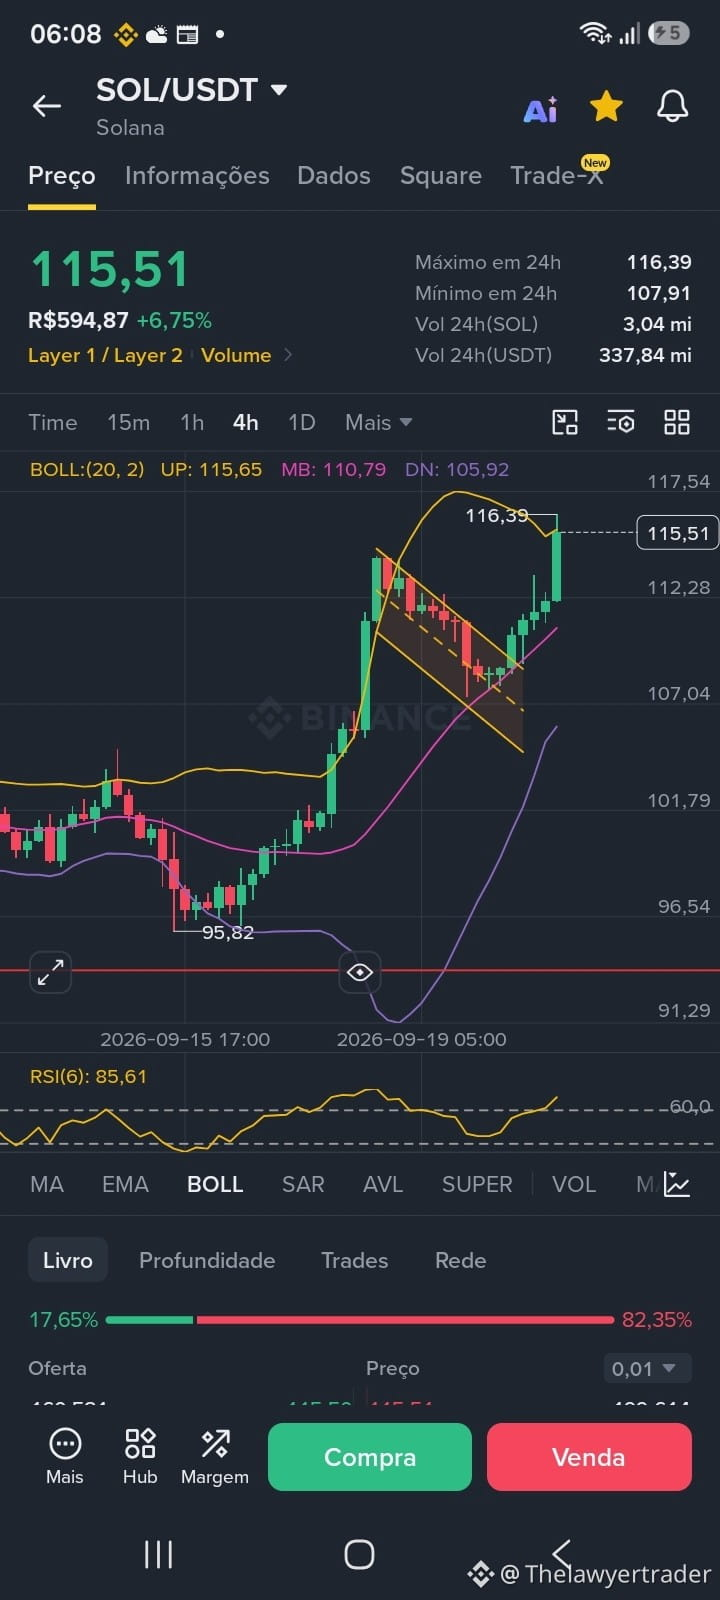
Solana shows a strong recovery in the short term, breaking above the downtrend line of a descending channel and now trading at 115.51 USDT, with a +6.75% gain over the last 24h and a high of 116.39.
The visible pattern is the breakout from a descending channel, a trend reversal signal. Based on the chart analysis, the probability of the upward move continuing is moderate to high in the medium term, as long as the price stays above the broken region.
However, there is an important alert in the short term. The price is testing the upper band of the Bollinger Bands (115.65) and the RSI(6) is at 85.61, in the overbought zone. This indicates strong buying momentum, but it also suggests the risk of a pullback or consolidation before further advances.
In summary, the underlying trend is positive, but the asset is in an exhaustion zone in the very short term. Watch for the breakout’s support and the exit from overbought conditions to confirm continuity.
Analysis based exclusively on the chart shown, with an informative and educational purpose. This does not constitute an investment recommendation.
#SolanaStrong $SOL
Solana shows a strong recovery in the short term, breaking above the downtrend line of a descending channel and now trading at 115.51 USDT, with a +6.75% gain over the last 24h and a high of 116.39.
The visible pattern is the breakout from a descending channel, a trend reversal signal. Based on the chart analysis, the probability of the upward move continuing is moderate to high in the medium term, as long as the price stays above the broken region.
However, there is an important alert in the short term. The price is testing the upper band of the Bollinger Bands (115.65) and the RSI(6) is at 85.61, in the overbought zone. This indicates strong buying momentum, but it also suggests the risk of a pullback or consolidation before further advances.
In summary, the underlying trend is positive, but the asset is in an exhaustion zone in the very short term. Watch for the breakout’s support and the exit from overbought conditions to confirm continuity.
Analysis based exclusively on the chart shown, with an informative and educational purpose. This does not constitute an investment recommendation.
#SolanaStrong $SOL