🚨 $SYN JUST WENT ABSOLUTELY CRAZY! 😂🔥
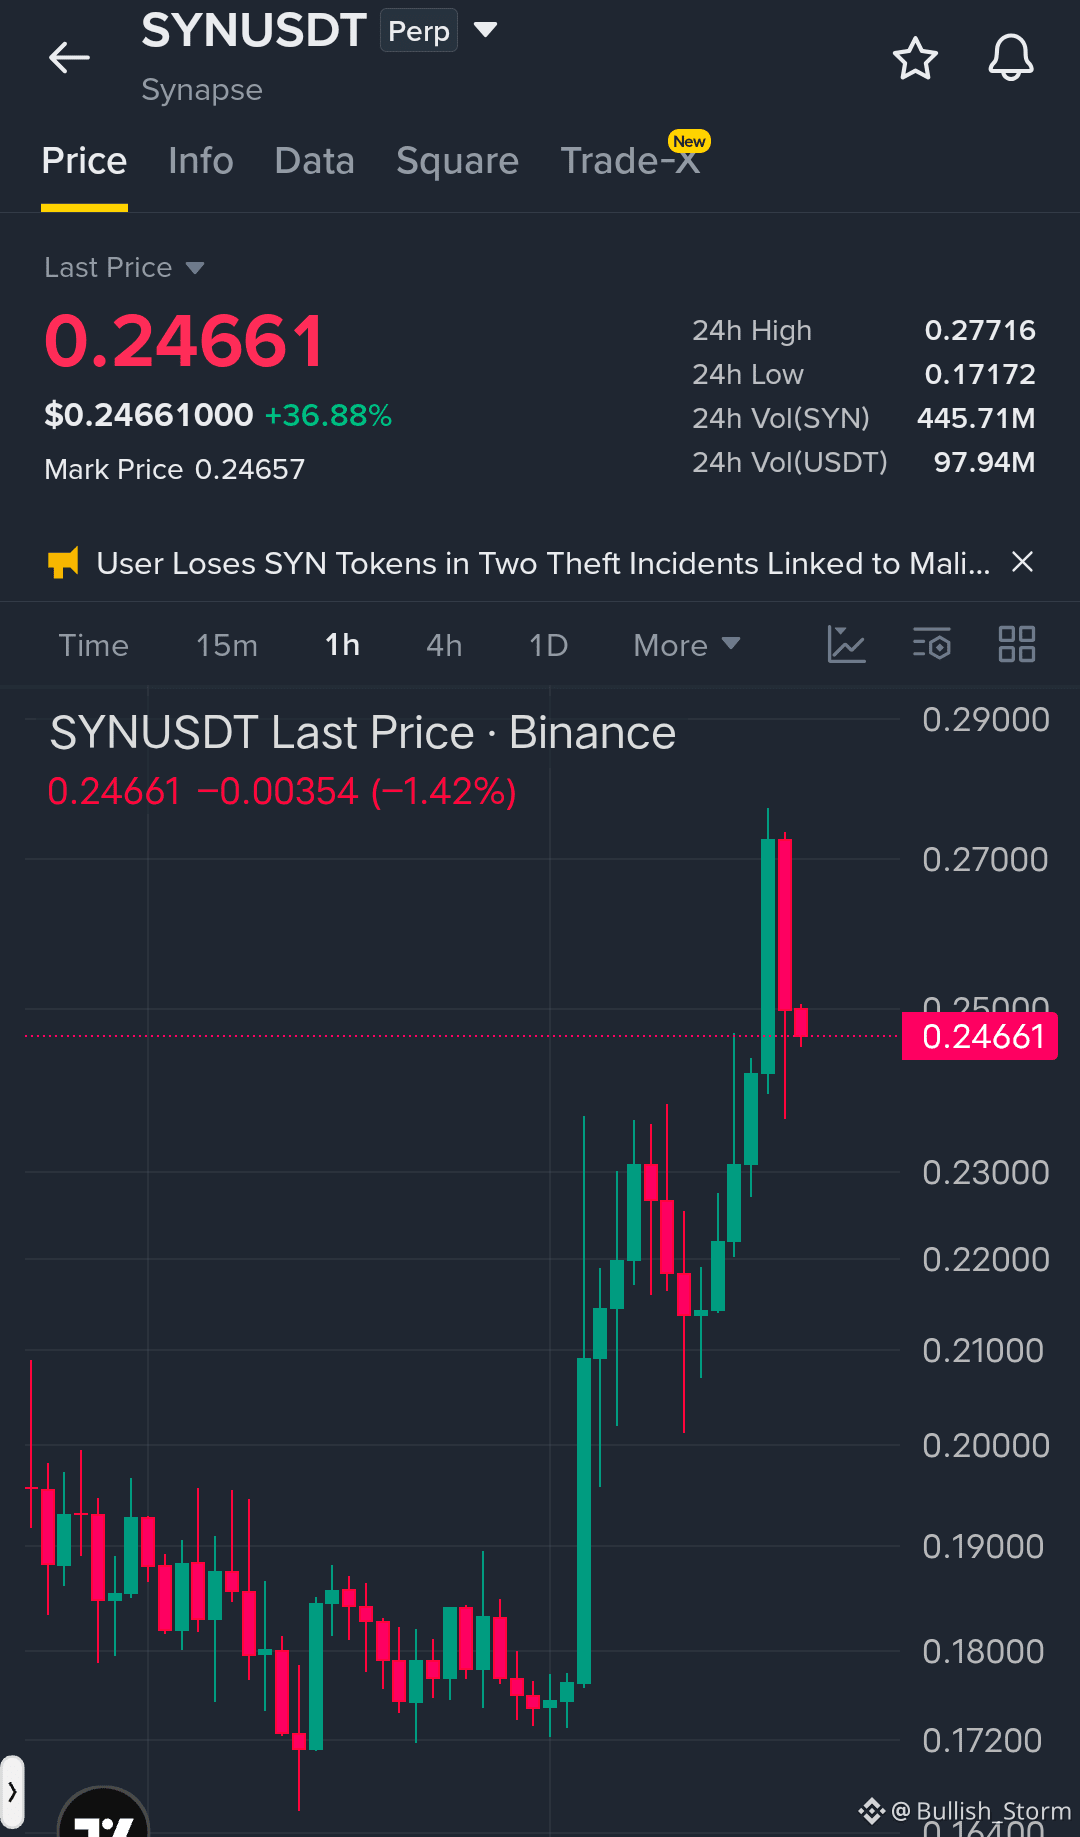
SYN USDT +36.88% in 24H and the chart looks like it just discovered caffeine. ☕😂
Price ripped from around $0.172 → $0.277, then pulled back toward $0.2466. That’s a serious move in a short period.
But here’s where things get interesting… 👀
The 1H chart shows a strong breakout from the $0.175–$0.180 area, followed by aggressive buying all the way toward $0.27+.
Now sellers are finally showing up.
🎯 Key levels to watch:
🟢 Support: $0.240–$0.230
🟢 Next support: $0.220–$0.210
🟢 Major base: $0.180–$0.175
🔴 Resistance: $0.250
🔴 Major resistance: $0.270–$0.277
🔥 Breakout zone: Above $0.277
If buyers reclaim and hold $0.250, the recent high around $0.277 becomes the obvious level everyone will be watching.
But if $0.240 starts cracking, the market could see a deeper cooldown toward the lower support zones.
And honestly… after a 36%+ daily pump, buying a random green candle is basically asking the market:
“Can you please teach me a lesson?” 😂💀
SYN has momentum, volume is huge, and the structure has completely changed from the earlier sideways action.
Now the real question:
Is this just the first chapter… or is the pump finally asking for a timeout? 👀🔥
Watch the levels. Don’t chase blindly. Let price confirm the next move.
Educational only. Not financial advice. Always do your own research and manage your risk.
$ZEC
$AKE
SYN USDT +36.88% in 24H and the chart looks like it just discovered caffeine. ☕😂
Price ripped from around $0.172 → $0.277, then pulled back toward $0.2466. That’s a serious move in a short period.
But here’s where things get interesting… 👀
The 1H chart shows a strong breakout from the $0.175–$0.180 area, followed by aggressive buying all the way toward $0.27+.
Now sellers are finally showing up.
🎯 Key levels to watch:
🟢 Support: $0.240–$0.230
🟢 Next support: $0.220–$0.210
🟢 Major base: $0.180–$0.175
🔴 Resistance: $0.250
🔴 Major resistance: $0.270–$0.277
🔥 Breakout zone: Above $0.277
If buyers reclaim and hold $0.250, the recent high around $0.277 becomes the obvious level everyone will be watching.
But if $0.240 starts cracking, the market could see a deeper cooldown toward the lower support zones.
And honestly… after a 36%+ daily pump, buying a random green candle is basically asking the market:
“Can you please teach me a lesson?” 😂💀
SYN has momentum, volume is huge, and the structure has completely changed from the earlier sideways action.
Now the real question:
Is this just the first chapter… or is the pump finally asking for a timeout? 👀🔥
Watch the levels. Don’t chase blindly. Let price confirm the next move.
Educational only. Not financial advice. Always do your own research and manage your risk.
$ZEC
$AKE