


In light of the recent crypto market turmoil, ETH price trajectory has declined sharply, retreating from the weekly resistance at $1,744. The drop saw the coin lose 8% in two weeks, leaving the coin with a current price of $1,574. Amid this slide, cryptocurrency sellers fell below an emerging support trendline, suggesting that further decline towards the $1,500 benchmark is possible.

Support break prompts price drop to $1,500
A bearish breakout of the support trendline suggests a 6% decline in the near term.
The rising wedge pattern is responsible for the current bullish trend in ETH price.
Ethereum’s intraday trading volume was $4.4 billion, a gain of 53%.
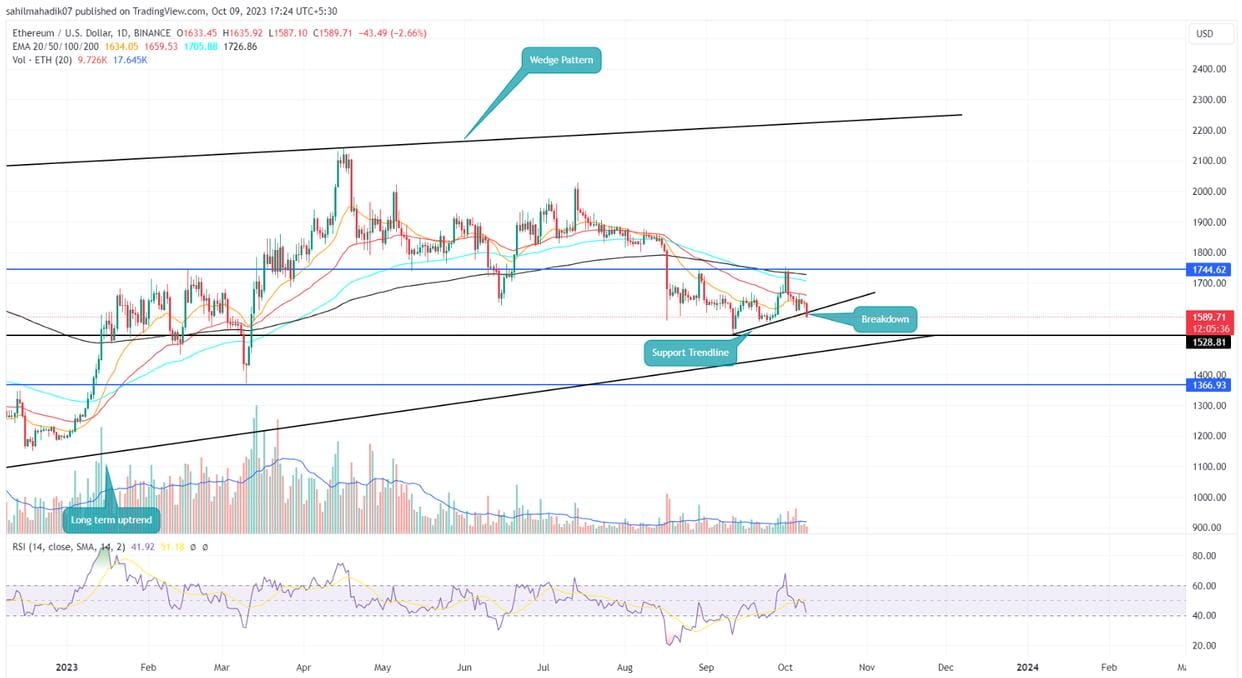
Over the past 60 days, Ethereum’s price dynamics have been primarily range-bound, fluctuating between a $1,744 upper limit and a $1,530 lower limit. During this period of consolidation, cryptocurrency buyers took advantage of new support trend lines to build bullish momentum.
However, this optimism is temporarily tempered as recent market headwinds resulted in a bearish breakout of ETH price from this dynamic support level. If today’s candle closes below this key trendline, it could intensify selling pressure, potentially pushing Ethereum down another 6% to target the $1,500 mark.
This decline may then coincide with the long-term support trendline of an established rising wedge structure.
Will ETH price resume its recovery trend?
The weekly time frame chart shows that the ongoing correction in Ethereum price that began in mid-April is part of a long-term wedge pattern. Under the influence of this pattern, the price of the currency resonates between two rising trend lines. With the recent correction, the coin price may hit the pattern’s lower trendline around $1,500. Historically, every retest of this support level has resulted in significant gains, and therefore, ETH price may witness a surge in bullish momentum at this support level. The expected rise could boost the coin’s price, leading to a sustained recovery.
Relative Strength Index: Although the price action is in a consolidation phase, the rising RSI slope reflects buyers trying to recapture higher levels. However, this failure to reflect sell-side efforts may remain dominant and prolong the ongoing correction phase.
Exponential Moving Average: The recent slope decline from the 200 EMA indicates an active downtrend.
Meeting is fate. I am a person who believes in fate. If you have any doubts in the currency circle, you can send me a private message. Friends who like it can like and follow. See you in the next issue.