
#uganalytics
uganalytics
0 views
3 Discussing
Hot
Latest

·
--
Bearish
📊 UG Analytics |
ZEC/USDT Daily Analysis Current scenario:
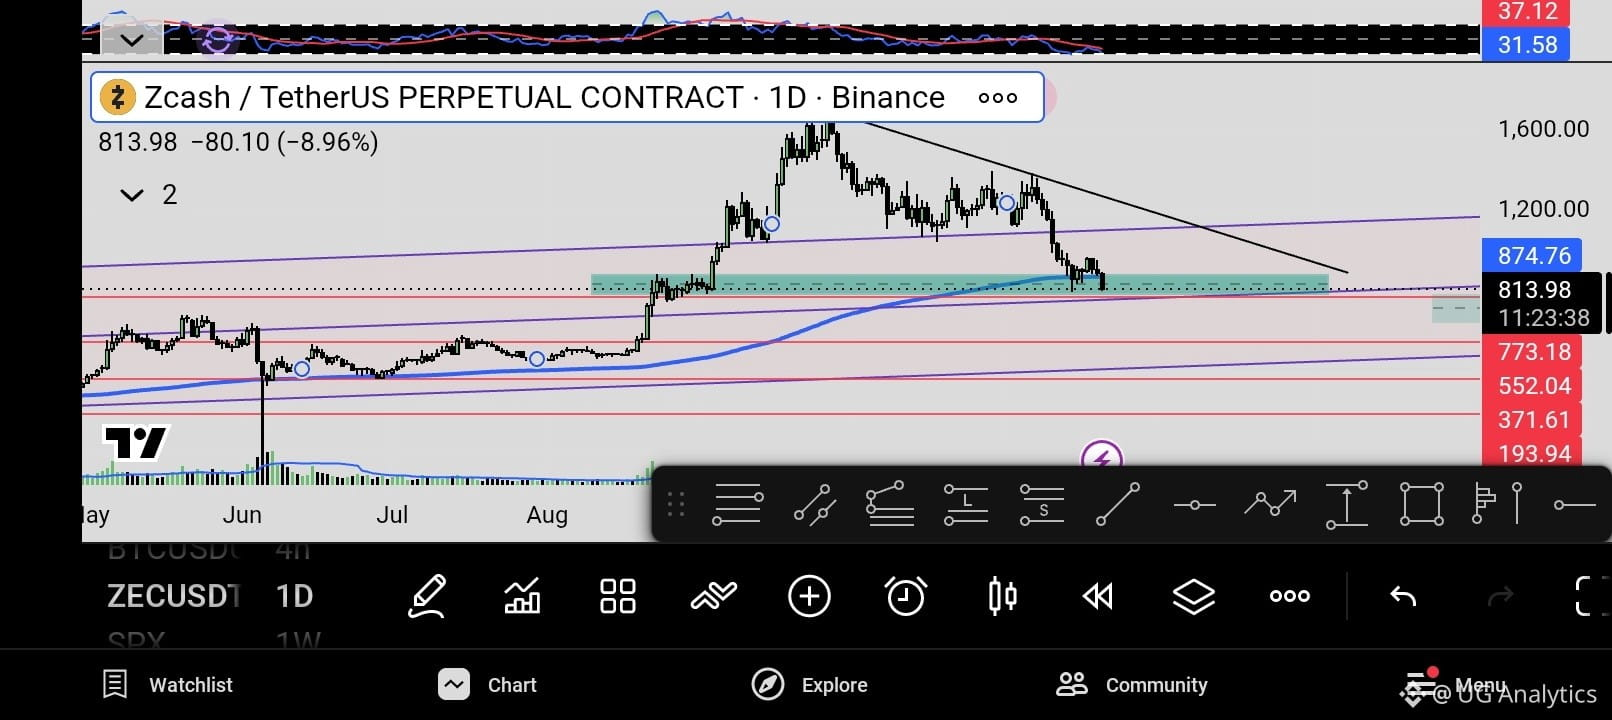
#ZEC is trading at 813, down about 9% today and roughly 50% from its ~1,600 peak.
It is sitting right on a key demand zone (790–880), which lines up with the 200 EMA.
The trendline from the top is still acting as resistance, so the overall structure is bearish until it breaks.
🔹 Support: 773 → 552 → 371
🔹 Resistance: 874 → 1,000 → 1,200
✅ Bullish: A daily close above 874 after holding this zone could push price toward 1,000+.
❌ Bearish: A daily close below 773 opens the way to 552.
⚠️ Wait for a daily close confirmation, and always use a stop loss.
Educational purposes only, not financial advice.💰
#ZECUSDT #Crypto #UGAnalytics
📊 UG Analytics |
ZEC/USDT Daily Analysis Current scenario:
#ZEC is trading at 813, down about 9% today and roughly 50% from its ~1,600 peak.
It is sitting right on a key demand zone (790–880), which lines up with the 200 EMA.
The trendline from the top is still acting as resistance, so the overall structure is bearish until it breaks.
🔹 Support: 773 → 552 → 371
🔹 Resistance: 874 → 1,000 → 1,200
✅ Bullish: A daily close above 874 after holding this zone could push price toward 1,000+.
❌ Bearish: A daily close below 773 opens the way to 552.
⚠️ Wait for a daily close confirmation, and always use a stop loss.
Educational purposes only, not financial advice.💰
#ZECUSDT #Crypto #UGAnalytics
ZEC/USDT Daily Analysis Current scenario:
#ZEC is trading at 813, down about 9% today and roughly 50% from its ~1,600 peak.
It is sitting right on a key demand zone (790–880), which lines up with the 200 EMA.
The trendline from the top is still acting as resistance, so the overall structure is bearish until it breaks.
🔹 Support: 773 → 552 → 371
🔹 Resistance: 874 → 1,000 → 1,200
✅ Bullish: A daily close above 874 after holding this zone could push price toward 1,000+.
❌ Bearish: A daily close below 773 opens the way to 552.
⚠️ Wait for a daily close confirmation, and always use a stop loss.
Educational purposes only, not financial advice.💰
#ZECUSDT #Crypto #UGAnalytics

210
·
--
UG Analytics |
#Bitcoin Slips Below $62K:
ETF Exodus and Forced Liquidations Test the $60K Zone
Bitcoin fell below $62,000 on Friday, November 20, extending its November decline as institutional withdrawals, tighter financial conditions and weak sentiment weighed on the market.
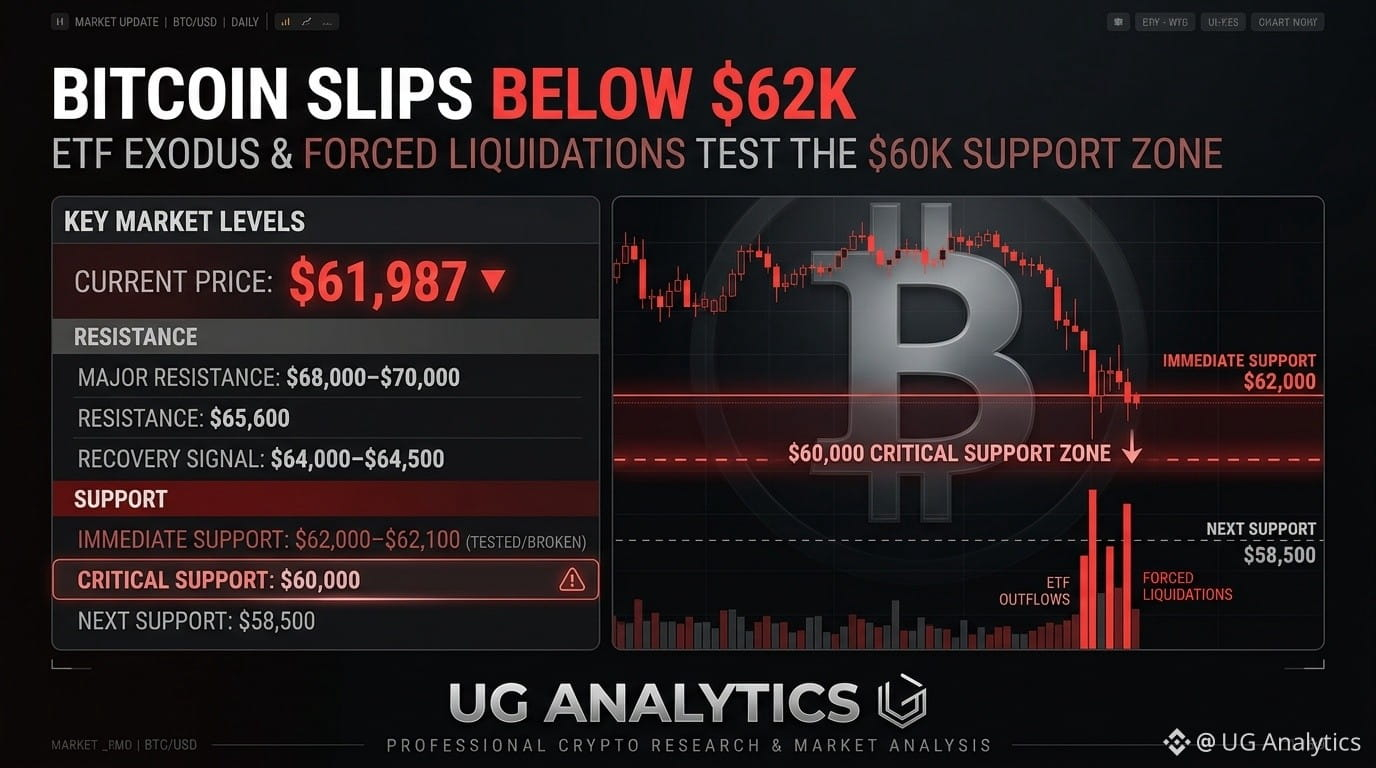
BTC is down about 20% since the end of October, from $77,582 to roughly $61,987.
ETF Outflows Are the Main Pressure
US spot Bitcoin ETFs pulled out $582.3M on Nov 19, and BlackRock's IBIT saw a record $541.1M single-day outflow. The funds have lost money on 12 of 14 trading days in November, a net $3.47B, and IBIT alone has lost about $2.9B this month. Selling intensified after BTC fell below $65,000, a level where institutions had often added to positions on dips.
Leverage Made It Worse
On Nov 13, BTC first fell below $70,000 and over $1B of leveraged positions were closed. CoinGlass shows about $697M in liquidations over the latest 24 hours. K33 reported the daily RSI hit 19.95 on Nov 14, a deeply oversold reading.
Technical Picture
BTC broke below its 200-week moving average near $67,992.
Support sits at $62,000–$62,100, and a daily close below it opens $60,000.
Glassnode flags $58,500 as the next level if $62K fails.
Resistance is at $65,600, then $68,000–$70,000.
A reclaim of $64,000–$64,500 would be the first sign of a bounce.
What To Do
Falling prices trigger liquidations, which push prices lower. Leveraged traders can be forced out whatever their conviction, so keep leverage low. Cheaper doesn't mean undervalued. If buying, scaling in gradually leaves room if $60K breaks.
This is analysis, not financial advice. Always manage your own risk.
#BTC☀ #cryptonews #UGAnalytics
UG Analytics |
#Bitcoin Slips Below $62K:
ETF Exodus and Forced Liquidations Test the $60K Zone
Bitcoin fell below $62,000 on Friday, November 20, extending its November decline as institutional withdrawals, tighter financial conditions and weak sentiment weighed on the market.
BTC is down about 20% since the end of October, from $77,582 to roughly $61,987.
ETF Outflows Are the Main Pressure
US spot Bitcoin ETFs pulled out $582.3M on Nov 19, and BlackRock's IBIT saw a record $541.1M single-day outflow. The funds have lost money on 12 of 14 trading days in November, a net $3.47B, and IBIT alone has lost about $2.9B this month. Selling intensified after BTC fell below $65,000, a level where institutions had often added to positions on dips.
Leverage Made It Worse
On Nov 13, BTC first fell below $70,000 and over $1B of leveraged positions were closed. CoinGlass shows about $697M in liquidations over the latest 24 hours. K33 reported the daily RSI hit 19.95 on Nov 14, a deeply oversold reading.
Technical Picture
BTC broke below its 200-week moving average near $67,992.
Support sits at $62,000–$62,100, and a daily close below it opens $60,000.
Glassnode flags $58,500 as the next level if $62K fails.
Resistance is at $65,600, then $68,000–$70,000.
A reclaim of $64,000–$64,500 would be the first sign of a bounce.
What To Do
Falling prices trigger liquidations, which push prices lower. Leveraged traders can be forced out whatever their conviction, so keep leverage low. Cheaper doesn't mean undervalued. If buying, scaling in gradually leaves room if $60K breaks.
This is analysis, not financial advice. Always manage your own risk.
#BTC☀ #cryptonews #UGAnalytics
#Bitcoin Slips Below $62K:
ETF Exodus and Forced Liquidations Test the $60K Zone
Bitcoin fell below $62,000 on Friday, November 20, extending its November decline as institutional withdrawals, tighter financial conditions and weak sentiment weighed on the market.
BTC is down about 20% since the end of October, from $77,582 to roughly $61,987.
ETF Outflows Are the Main Pressure
US spot Bitcoin ETFs pulled out $582.3M on Nov 19, and BlackRock's IBIT saw a record $541.1M single-day outflow. The funds have lost money on 12 of 14 trading days in November, a net $3.47B, and IBIT alone has lost about $2.9B this month. Selling intensified after BTC fell below $65,000, a level where institutions had often added to positions on dips.
Leverage Made It Worse
On Nov 13, BTC first fell below $70,000 and over $1B of leveraged positions were closed. CoinGlass shows about $697M in liquidations over the latest 24 hours. K33 reported the daily RSI hit 19.95 on Nov 14, a deeply oversold reading.
Technical Picture
BTC broke below its 200-week moving average near $67,992.
Support sits at $62,000–$62,100, and a daily close below it opens $60,000.
Glassnode flags $58,500 as the next level if $62K fails.
Resistance is at $65,600, then $68,000–$70,000.
A reclaim of $64,000–$64,500 would be the first sign of a bounce.
What To Do
Falling prices trigger liquidations, which push prices lower. Leveraged traders can be forced out whatever their conviction, so keep leverage low. Cheaper doesn't mean undervalued. If buying, scaling in gradually leaves room if $60K breaks.
This is analysis, not financial advice. Always manage your own risk.
#BTC☀ #cryptonews #UGAnalytics
17
Log in to explore more content
Join global crypto users on Binance Square
⚡️ Get latest and useful information about crypto.
💬 Trusted by the world’s largest crypto exchange.
👍 Discover real insights from verified creators.
Email / Phone number
Trending Topics
1
#IsAnthropic’s$1.5TMarketCapJustified?
62,775 views
336 Discussing
2
#BTCBelow$62KAmidHikeFearsAndShiftToAnthropic
20,381 views
139 Discussing
3
#GaoTengBitcoinETFListsOnHKEX
0 views
68 Discussing
4
#TradFiForBeginners
946,825 views
5,168 Discussing
5
#NvidiaBoardReportedlySplitOverHuang’sReturn
258,674 views
2,188 Discussing
6
#CanGTA6'sLaunchLiftTTWOShares?
207,868 views
1,583 Discussing
7
#HongKongProposesSFCLicensingForFourVirtualAssetServices
404 views
24 Discussing
8
#BlackRockBitcoinETFRecordsLargestDailyOutflow
17,904 views
283 Discussing
9
#LedgerProbesTamperedWalletsInBerlinAndDubai
26,327 views
402 Discussing
10
#13FInstitutionsBitcoinSpotETPHoldingsHitRecord
42,516 views
443 Discussing