
#trandingcrypto
trandingcrypto
201 views
6 Discussing
Hot
Latest

·
--
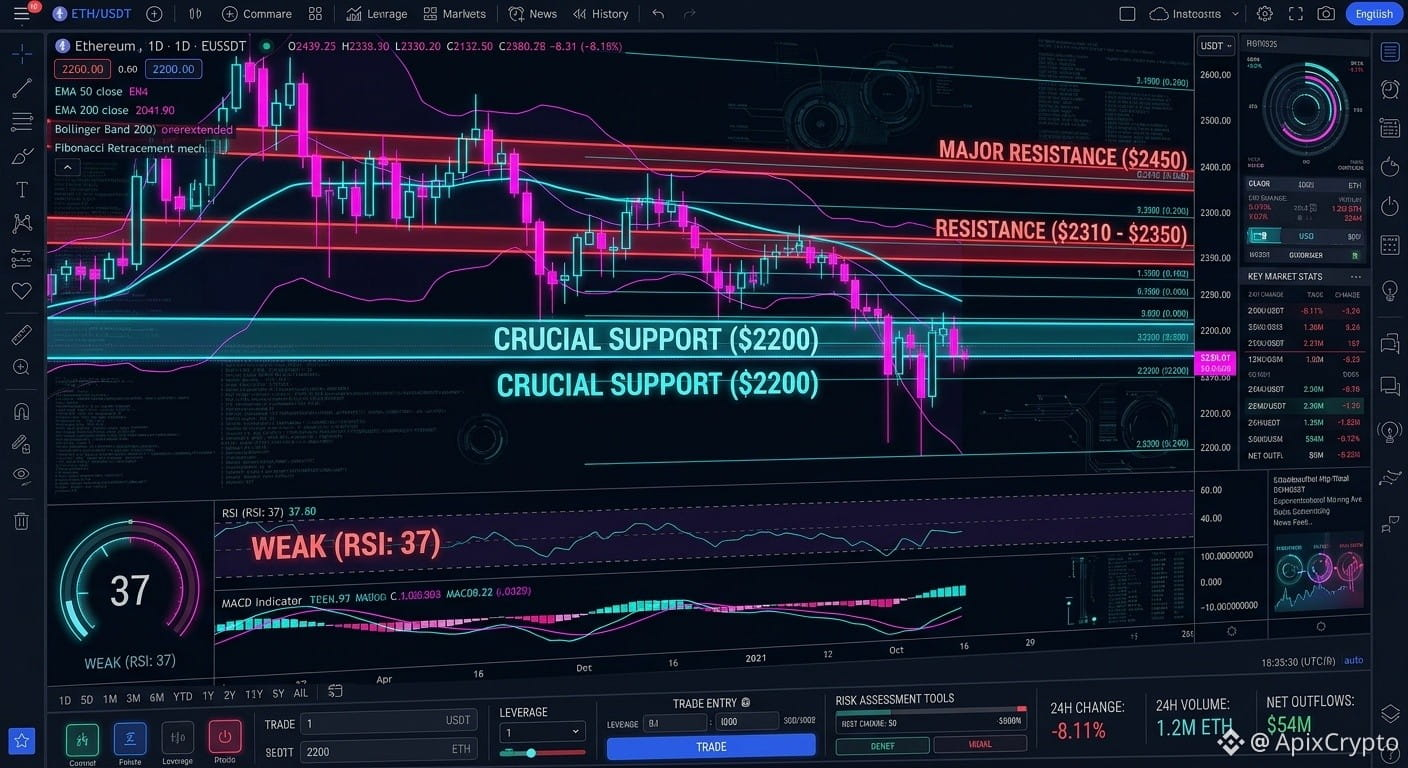
As of November 6, 2026, Ethereum ($ETH ) has faced severe short-term selling pressure, dropping roughly 8% over the last 24 hours to trade near $2,200 to $2,250. The decline mirrors a broader risk-off sell-off in U.S. technology equities and a wave of over $1 billion in crypto long liquidations.
Key Market Metrics
Current Price Zone: Oscillating around $2,225 - $2,250, struggling to sustain positive intraday momentum.Crucial Support: Established heavily at the $2,150 – $2,200 psychological horizontal block. Additionally, the long-term 200-day Simple Moving Average (SMA) near $1,158 serves as a structural macro baseline.Immediate Resistance: Positioned tightly between $2,310 and $2,350. A clean breakout and daily close above this level are necessary to shift the trend.Momentum Indicators: The daily Relative Strength Index (RSI) is hovering in a weak territory near 37, pointing to ongoing distribution, while the MACD histogram remains negative.
Short-Term Outlook
ETH remains locked inside a short-term descending channel, making lower highs and lower lows. Institutional sentiment shows caution following significant net outflows from spot Ethereum ETFs. Traders are closely monitoring the TradingView ETH/USD pairs to see if buyers absorb supply at the $2,200 floor. A breakout above the channel’s upper boundary is required before a wider market reversal can take shape.
#eth #trandingcrypto #JobsReportRaisesHikeOdds #BinanceReopensWithdrawalsForMoreAssets #AnthropicIPOValuationDoubts
As of November 6, 2026, Ethereum ($ETH ) has faced severe short-term selling pressure, dropping roughly 8% over the last 24 hours to trade near $2,200 to $2,250. The decline mirrors a broader risk-off sell-off in U.S. technology equities and a wave of over $1 billion in crypto long liquidations.
Key Market Metrics
Current Price Zone: Oscillating around $2,225 - $2,250, struggling to sustain positive intraday momentum.Crucial Support: Established heavily at the $2,150 – $2,200 psychological horizontal block. Additionally, the long-term 200-day Simple Moving Average (SMA) near $1,158 serves as a structural macro baseline.Immediate Resistance: Positioned tightly between $2,310 and $2,350. A clean breakout and daily close above this level are necessary to shift the trend.Momentum Indicators: The daily Relative Strength Index (RSI) is hovering in a weak territory near 37, pointing to ongoing distribution, while the MACD histogram remains negative.
Short-Term Outlook
ETH remains locked inside a short-term descending channel, making lower highs and lower lows. Institutional sentiment shows caution following significant net outflows from spot Ethereum ETFs. Traders are closely monitoring the TradingView ETH/USD pairs to see if buyers absorb supply at the $2,200 floor. A breakout above the channel’s upper boundary is required before a wider market reversal can take shape.
#eth #trandingcrypto #JobsReportRaisesHikeOdds #BinanceReopensWithdrawalsForMoreAssets #AnthropicIPOValuationDoubts
Key Market Metrics
Current Price Zone: Oscillating around $2,225 - $2,250, struggling to sustain positive intraday momentum.Crucial Support: Established heavily at the $2,150 – $2,200 psychological horizontal block. Additionally, the long-term 200-day Simple Moving Average (SMA) near $1,158 serves as a structural macro baseline.Immediate Resistance: Positioned tightly between $2,310 and $2,350. A clean breakout and daily close above this level are necessary to shift the trend.Momentum Indicators: The daily Relative Strength Index (RSI) is hovering in a weak territory near 37, pointing to ongoing distribution, while the MACD histogram remains negative.
Short-Term Outlook
ETH remains locked inside a short-term descending channel, making lower highs and lower lows. Institutional sentiment shows caution following significant net outflows from spot Ethereum ETFs. Traders are closely monitoring the TradingView ETH/USD pairs to see if buyers absorb supply at the $2,200 floor. A breakout above the channel’s upper boundary is required before a wider market reversal can take shape.
#eth #trandingcrypto #JobsReportRaisesHikeOdds #BinanceReopensWithdrawalsForMoreAssets #AnthropicIPOValuationDoubts
7

·
--
🚀 $OSMO is showing strong potential as the Cosmos ecosystem keeps growing! With its powerful DeFi utility, staking rewards, and cross-chain trading features, many investors are watching Osmosis closely. 📈
The market is still volatile, but if altcoins continue gaining momentum, OSMO could see a strong comeback. 🌌🔥
⚡ Fast transactions
🔗 Cross-chain ecosystem
💎 Strong DeFi utility
Keep an eye on OSMO — the next big move could surprise the market #OSMO/USDT #Binance #BlackRockPlansMoneyMarketFundsforStablecoinUsers #CLARITYActHearingSetforMay14 #trandingcrypto
🚀 $OSMO is showing strong potential as the Cosmos ecosystem keeps growing! With its powerful DeFi utility, staking rewards, and cross-chain trading features, many investors are watching Osmosis closely. 📈
The market is still volatile, but if altcoins continue gaining momentum, OSMO could see a strong comeback. 🌌🔥
⚡ Fast transactions
🔗 Cross-chain ecosystem
💎 Strong DeFi utility
Keep an eye on OSMO — the next big move could surprise the market #OSMO/USDT #Binance #BlackRockPlansMoneyMarketFundsforStablecoinUsers #CLARITYActHearingSetforMay14 #trandingcrypto
The market is still volatile, but if altcoins continue gaining momentum, OSMO could see a strong comeback. 🌌🔥
⚡ Fast transactions
🔗 Cross-chain ecosystem
💎 Strong DeFi utility
Keep an eye on OSMO — the next big move could surprise the market #OSMO/USDT #Binance #BlackRockPlansMoneyMarketFundsforStablecoinUsers #CLARITYActHearingSetforMay14 #trandingcrypto
130

Passive Income Focus
Stop letting your crypto sit idle. Using Binance Earn with assets like $BNB, USDT, and BTC is one of the easiest ways to build a portfolio passively. Between launchpools and simple earn flexible rates, the rewards stack up fast. Check your earn dashboard today! 💰
#BinanceEarn #PassiveIncome #CryptoForBeginners #Binance9thAnniversary #trandingtopics #trandingcrypto
$BNB $BTC $SOL
Passive Income Focus
Stop letting your crypto sit idle. Using Binance Earn with assets like $BNB , USDT, and BTC is one of the easiest ways to build a portfolio passively. Between launchpools and simple earn flexible rates, the rewards stack up fast. Check your earn dashboard today! 💰
#BinanceEarn #PassiveIncome #CryptoForBeginners #Binance9thAnniversary #trandingtopics #trandingcrypto
$BNB $BTC $SOL
Stop letting your crypto sit idle. Using Binance Earn with assets like $BNB , USDT, and BTC is one of the easiest ways to build a portfolio passively. Between launchpools and simple earn flexible rates, the rewards stack up fast. Check your earn dashboard today! 💰
#BinanceEarn #PassiveIncome #CryptoForBeginners #Binance9thAnniversary #trandingtopics #trandingcrypto
$BNB $BTC $SOL
77
Log in to explore more content
Join global crypto users on Binance Square
⚡️ Get latest and useful information about crypto.
💬 Trusted by the world’s largest crypto exchange.
👍 Discover real insights from verified creators.
Email / Phone number
Trending Topics
1
#BinanceReopensWithdrawalsForHYPE&APT
100,936 views
1,016 Discussing
2
#SouthKoreaDraftLawTargets15To20%ShareholderCap
96,636 views
673 Discussing
3
#TradFiForBeginners
189,072 views
1,879 Discussing
4
#KeplrAdvisesSocialLoginUsersToTransferAssets
49,526 views
532 Discussing
5
#TetherPlans€28.8MForJuventusCapitalIncrease
38,147 views
414 Discussing
6
#JobsReportRaisesHikeOdds
885,721 views
4,471 Discussing
7
#CPITestsDecemberRateOutlook
366,067 views
1,903 Discussing
8
#US Data Center Rules May Constrain AI Expansion
134,192 views
260 Discussing
9
#ARKPlans14ThematicETFsCoveringAIAndTokenizedMarkets
9,888 views
90 Discussing
10
#WillAnthropicListOnTime
278,451 views
1,893 Discussing