
#peepee
peepee
25,857 views
22 Discussing
Hot
Latest

Executive Summary
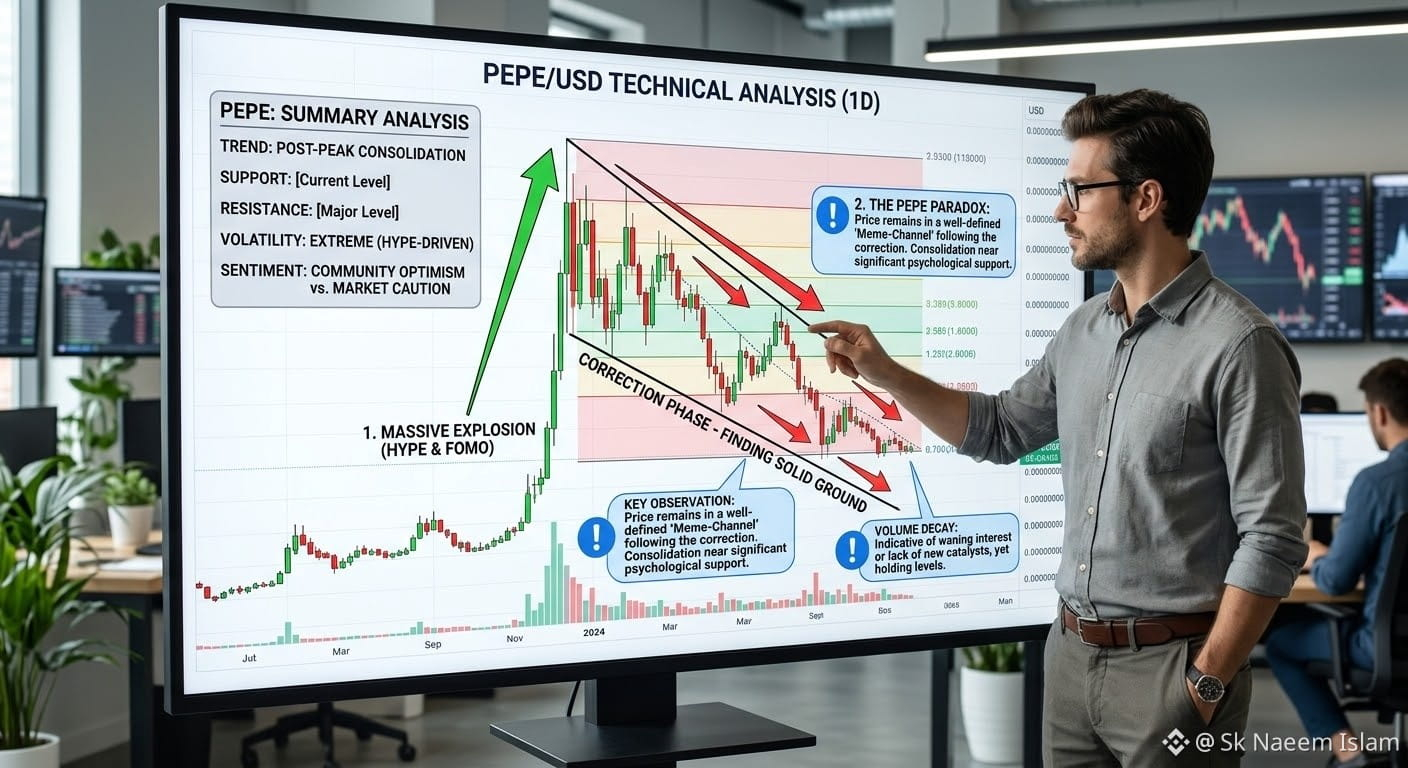
$PEPE remains one of the premier meme tokens in the cryptocurrency market. While fundamentally driven by social sentiment and speculative market momentum, its technical structure on daily and weekly timeframes presents clear support and resistance levels for traders.
Key Technical Indicators & Structure
Current Price Zone: PEPE is currently consolidating around $0.0000050.
Moving Averages (EMA): The price is holding near the 50-day and 200-day Exponential Moving Averages (EMAs). Trading above these key moving averages indicates a stable medium-term baseline, where pullbacks often attract buying interest.
Support & Resistance:
Immediate Support: $0.0000046 – $0.0000047. A breakdown below this level opens up lower liquidity zones near $0.0000038.
Main Resistance: $0.0000053 – $0.0000056. Clearing this zone is required for bulls to retest higher resistance targets.
.
Relative Strength Index (RSI): Floating around 55–58 (Neutral zone), indicating market equilibrium with room for momentum in either direction without being overbought or oversold.
Candlestick Pattern Insights
Rejection Shadows (Wicks): Recent lower shadow wicks around the $0.0000046 support zone demonstrate aggressive dip-buying, preventing deeper retracements.
Market Structure: As seen on multi-month technical charts, major market movements in PEPE are defined by rapid expansion phases (large bullish green candles) followed by prolonged consolidation channels.
#BTCRebounds80K #PEEPEE #BiralCrypto #SuadiArabia #ADPUSPrivateEmployersAdd86000JobsInOctober
{spot}(PEPEUSDT)
Executive Summary
$PEPE remains one of the premier meme tokens in the cryptocurrency market. While fundamentally driven by social sentiment and speculative market momentum, its technical structure on daily and weekly timeframes presents clear support and resistance levels for traders.
Key Technical Indicators & Structure
Current Price Zone: PEPE is currently consolidating around $0.0000050.
Moving Averages (EMA): The price is holding near the 50-day and 200-day Exponential Moving Averages (EMAs). Trading above these key moving averages indicates a stable medium-term baseline, where pullbacks often attract buying interest.
Support & Resistance:
Immediate Support: $0.0000046 – $0.0000047. A breakdown below this level opens up lower liquidity zones near $0.0000038.
Main Resistance: $0.0000053 – $0.0000056. Clearing this zone is required for bulls to retest higher resistance targets.
.
Relative Strength Index (RSI): Floating around 55–58 (Neutral zone), indicating market equilibrium with room for momentum in either direction without being overbought or oversold.
Candlestick Pattern Insights
Rejection Shadows (Wicks): Recent lower shadow wicks around the $0.0000046 support zone demonstrate aggressive dip-buying, preventing deeper retracements.
Market Structure: As seen on multi-month technical charts, major market movements in PEPE are defined by rapid expansion phases (large bullish green candles) followed by prolonged consolidation channels.
#BTCRebounds80K #PEEPEE #BiralCrypto #SuadiArabia #ADPUSPrivateEmployersAdd86000JobsInOctober
$PEPE remains one of the premier meme tokens in the cryptocurrency market. While fundamentally driven by social sentiment and speculative market momentum, its technical structure on daily and weekly timeframes presents clear support and resistance levels for traders.
Key Technical Indicators & Structure
Current Price Zone: PEPE is currently consolidating around $0.0000050.
Moving Averages (EMA): The price is holding near the 50-day and 200-day Exponential Moving Averages (EMAs). Trading above these key moving averages indicates a stable medium-term baseline, where pullbacks often attract buying interest.
Support & Resistance:
Immediate Support: $0.0000046 – $0.0000047. A breakdown below this level opens up lower liquidity zones near $0.0000038.
Main Resistance: $0.0000053 – $0.0000056. Clearing this zone is required for bulls to retest higher resistance targets.
.
Relative Strength Index (RSI): Floating around 55–58 (Neutral zone), indicating market equilibrium with room for momentum in either direction without being overbought or oversold.
Candlestick Pattern Insights
Rejection Shadows (Wicks): Recent lower shadow wicks around the $0.0000046 support zone demonstrate aggressive dip-buying, preventing deeper retracements.
Market Structure: As seen on multi-month technical charts, major market movements in PEPE are defined by rapid expansion phases (large bullish green candles) followed by prolonged consolidation channels.
#BTCRebounds80K #PEEPEE #BiralCrypto #SuadiArabia #ADPUSPrivateEmployersAdd86000JobsInOctober
72
Log in to explore more content
Join global crypto users on Binance Square
⚡️ Get latest and useful information about crypto.
💬 Trusted by the world’s largest crypto exchange.
👍 Discover real insights from verified creators.
Email / Phone number
Trending Topics
1
#BTCRebounds80K
25,412 views
517 Discussing
2
#Binance98PercentReplenished
22,936 views
460 Discussing
3
#USMidterms-WhatAreMarketsExpecting?
289,846 views
1,943 Discussing
4
#USOctoberNFP-AreRateCutsStillPossible
368,265 views
2,756 Discussing
5
#AMDBeatsExpectations-AINarrativeContinues
83,154 views
740 Discussing
6
#CircleQ3Revenue865M
22,247 views
416 Discussing
7
#BinanceIncidentReport
491,420 views
2,075 Discussing
8
#USStocksOpenHigherAsDowGains1.9%
3,150 views
66 Discussing
9
#ADPUSPrivateEmployersAdd86000JobsInOctober
2,536 views
45 Discussing
10
#FrenchAssemblyPassesSelfCustodiedCryptoReportingAmendment
761 views
21 Discussing