
#overbought
overbought
93,186 views
602 Discussing
Hot
Latest

·
--
Bullish
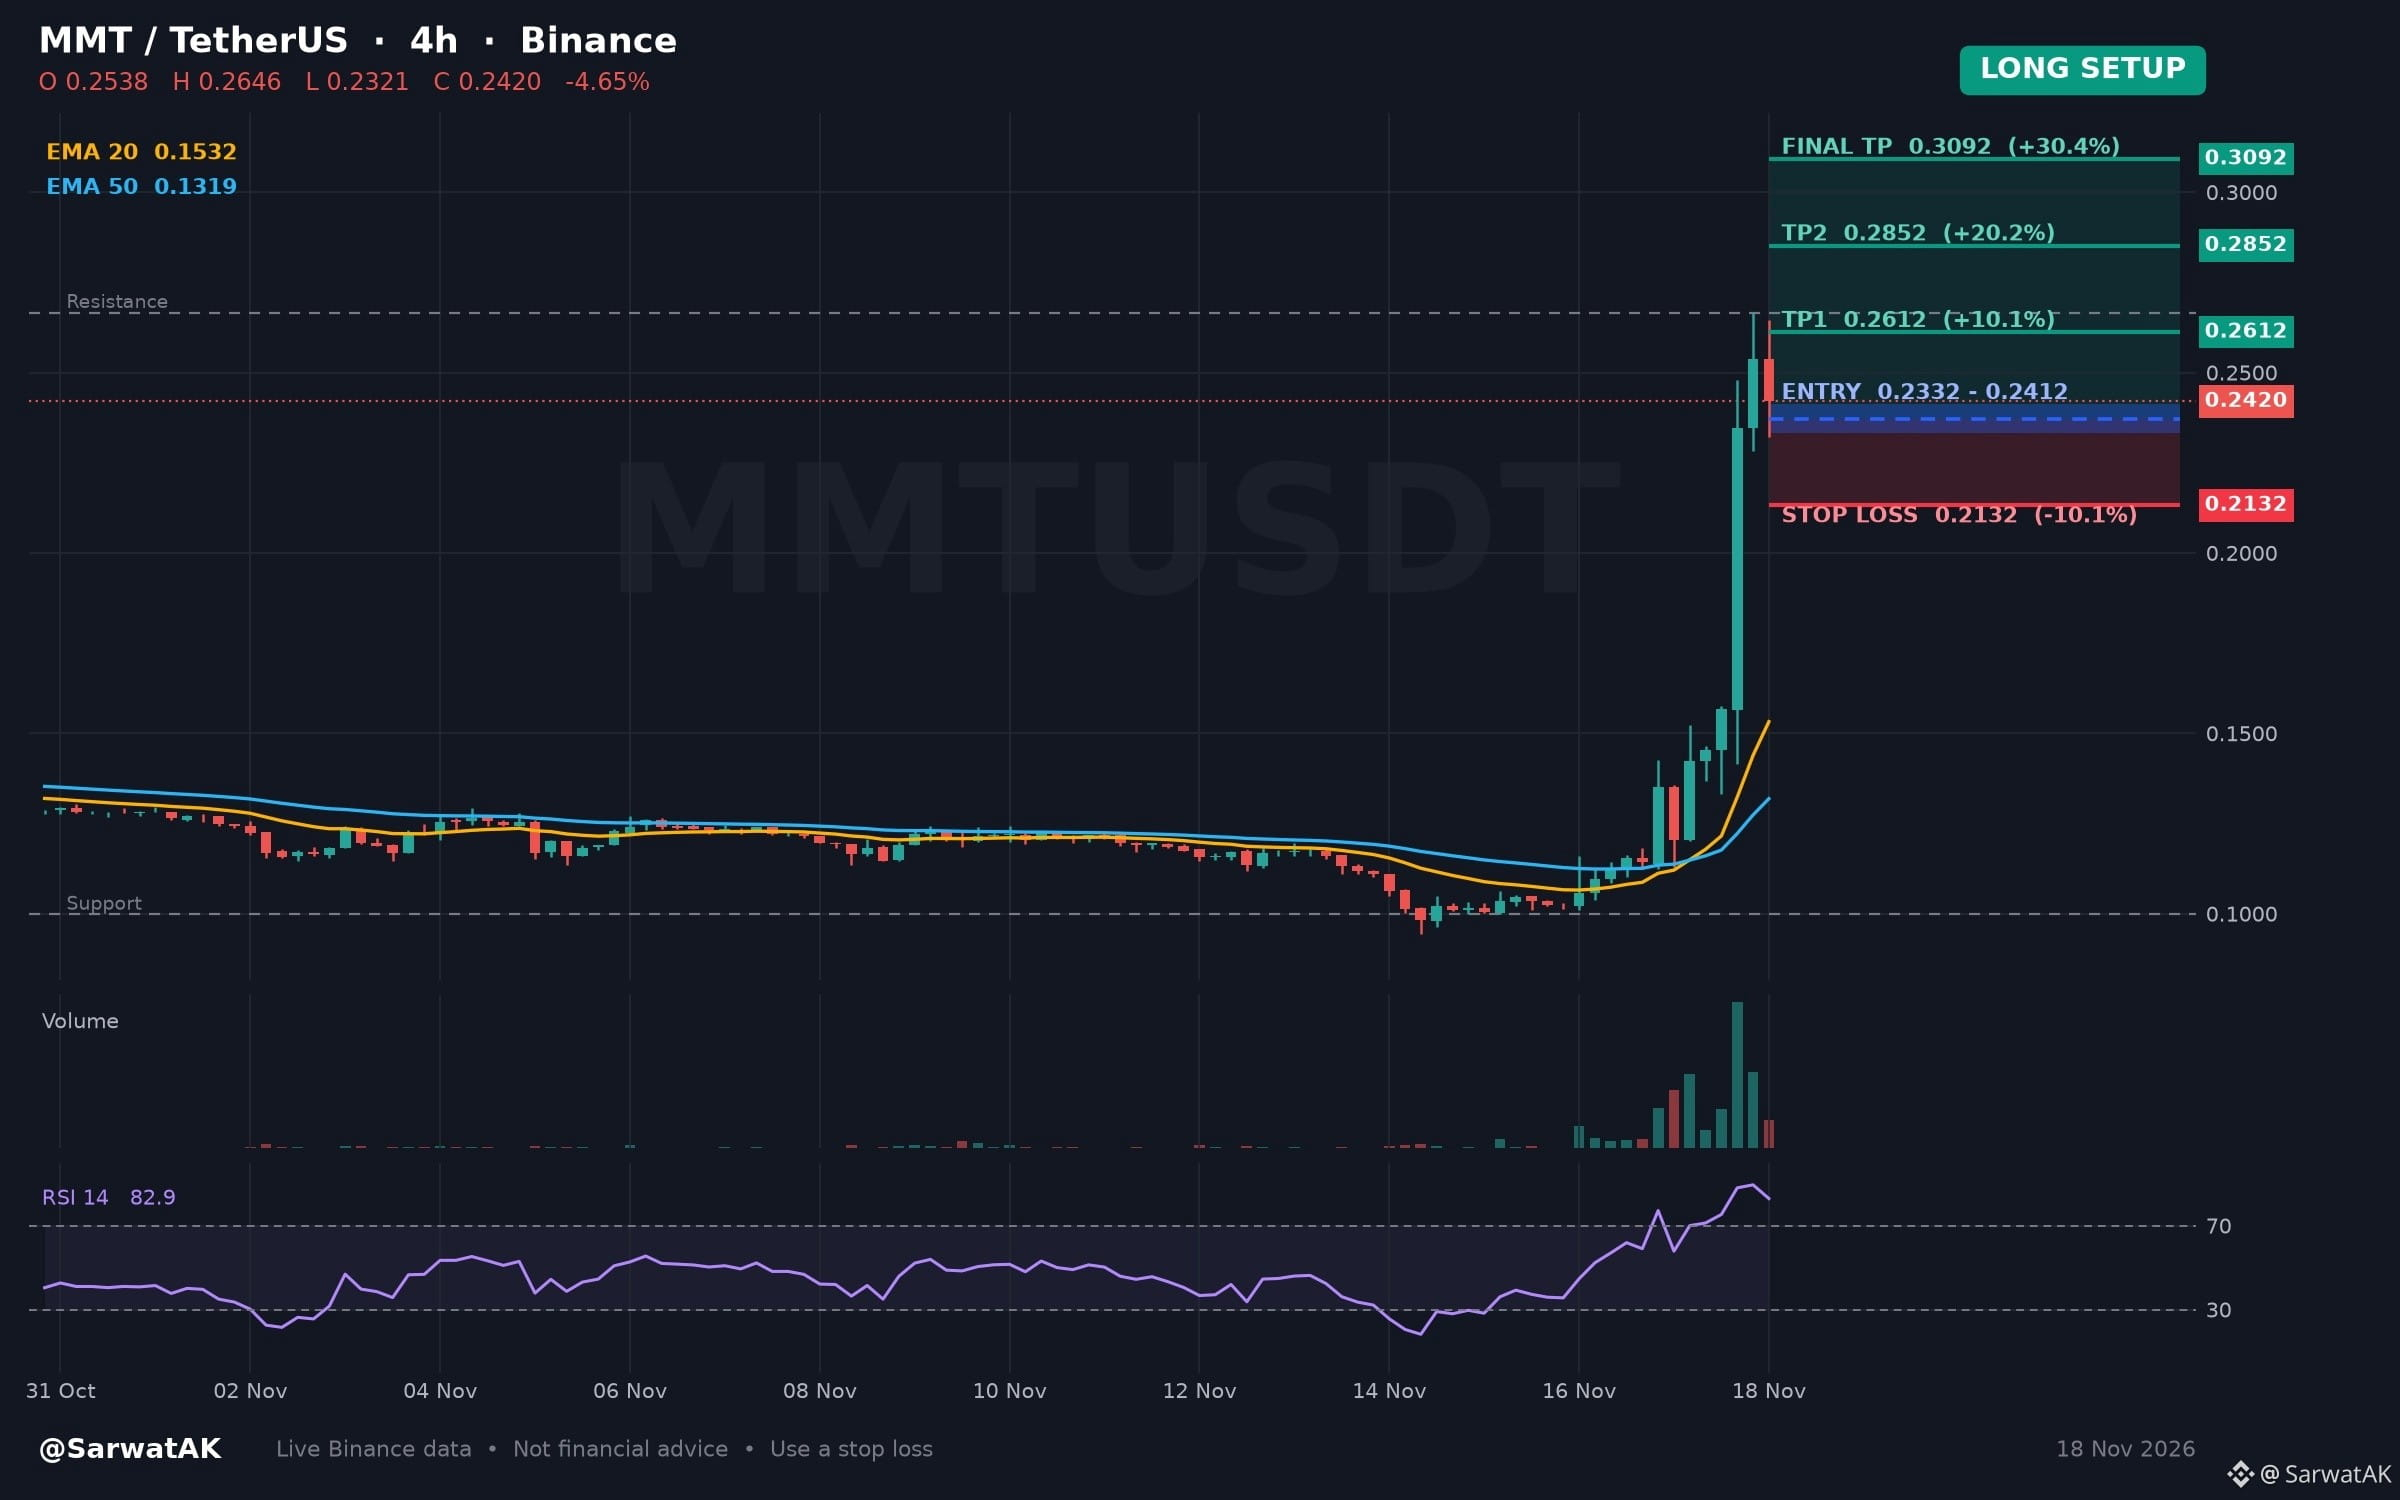
$MMT LONG SETUP ... NEXT TARGET 0.3092
Overbought RSI Meets Upward Momentum on Four-Hour Chart
Entry: 0.2332 - 0.2412 (Long)
TP1: 0.2612
TP2: 0.2852
Final TP: 0.3092
SL: 0.2132
The relative strength index on the four-hour chart is positioned in the overbought zone, indicating that recent buying pressure may be nearing exhaustion. Simultaneously, the price has advanced in the past twenty-four hours, suggesting momentum remains supportive.
As long as 0.2332 holds, structure stays constructive
Must use stop loss while trading
Trade $MMT
Not financial advice. Always DYOR.
🙏 Tips are always welcome and truly appreciated. Thank you for supporting Open to Discussion.
Like & Follow for Daily Trade Analytics & Insider News. @SarwatAK
#MMT #Overbought #HotTrends
{spot}(MMTUSDT)
$MMT LONG SETUP ... NEXT TARGET 0.3092
Overbought RSI Meets Upward Momentum on Four-Hour Chart
Entry: 0.2332 - 0.2412 (Long)
TP1: 0.2612
TP2: 0.2852
Final TP: 0.3092
SL: 0.2132
The relative strength index on the four-hour chart is positioned in the overbought zone, indicating that recent buying pressure may be nearing exhaustion. Simultaneously, the price has advanced in the past twenty-four hours, suggesting momentum remains supportive.
As long as 0.2332 holds, structure stays constructive
Must use stop loss while trading
Trade $MMT
Not financial advice. Always DYOR.
🙏 Tips are always welcome and truly appreciated. Thank you for supporting Open to Discussion.
Like & Follow for Daily Trade Analytics & Insider News. @SarwatAK
#MMT #Overbought #HotTrends
Overbought RSI Meets Upward Momentum on Four-Hour Chart
Entry: 0.2332 - 0.2412 (Long)
TP1: 0.2612
TP2: 0.2852
Final TP: 0.3092
SL: 0.2132
The relative strength index on the four-hour chart is positioned in the overbought zone, indicating that recent buying pressure may be nearing exhaustion. Simultaneously, the price has advanced in the past twenty-four hours, suggesting momentum remains supportive.
As long as 0.2332 holds, structure stays constructive
Must use stop loss while trading
Trade $MMT
Not financial advice. Always DYOR.
🙏 Tips are always welcome and truly appreciated. Thank you for supporting Open to Discussion.
Like & Follow for Daily Trade Analytics & Insider News. @SarwatAK
#MMT #Overbought #HotTrends
288

·
--
$BREV Four Hour RSI Enters Overbought Territory After Upward Move
$BREV Giving Away You Black Friday Profit - Enter Trade Now
$BREV trades at 0.1000 USD, up 75.7% over the past 24 hours, with 4H RSI at 77.6 (overbought).
The price has moved upward over the past twenty-four hours, pushing the four-hour RSI into overbought territory. Momentum remains firm, though an elevated reading often leads traders to watch for potential consolidation.
KEY LEVELS
▪️ Resistance: 0.1350 USD (20-candle 4H swing high)
▪️ Support: 0.0553 USD (20-candle 4H swing low)
▪️ EMA 20 / EMA 50: 0.0676 / 0.0667 USD (short-term trend filter)
WHAT WOULD CONFIRM CONTINUATION
▪️ RSI holding in the upper zone while price keeps printing higher 4H closes
▪️ Pullbacks holding above EMA 20 (0.0676 USD)
WHAT WOULD SIGNAL COOLING
▪️ A 4H close below EMA 20 (0.0676 USD)
▪️ RSI rolling over while price stalls below 0.1350 USD
Do you expect upward momentum to continue, or will the overbought four-hour RSI lead to consolidation?
Not financial advice. Always DYOR.
Like & Follow for Daily Trade Analytics & Insider News. @MistralAK
#BREV #Overbought #TradingSignals
{spot}(BREVUSDT)
$BREV Four Hour RSI Enters Overbought Territory After Upward Move
$BREV Giving Away You Black Friday Profit - Enter Trade Now
$BREV trades at 0.1000 USD, up 75.7% over the past 24 hours, with 4H RSI at 77.6 (overbought).
The price has moved upward over the past twenty-four hours, pushing the four-hour RSI into overbought territory. Momentum remains firm, though an elevated reading often leads traders to watch for potential consolidation.
KEY LEVELS
▪️ Resistance: 0.1350 USD (20-candle 4H swing high)
▪️ Support: 0.0553 USD (20-candle 4H swing low)
▪️ EMA 20 / EMA 50: 0.0676 / 0.0667 USD (short-term trend filter)
WHAT WOULD CONFIRM CONTINUATION
▪️ RSI holding in the upper zone while price keeps printing higher 4H closes
▪️ Pullbacks holding above EMA 20 (0.0676 USD)
WHAT WOULD SIGNAL COOLING
▪️ A 4H close below EMA 20 (0.0676 USD)
▪️ RSI rolling over while price stalls below 0.1350 USD
Do you expect upward momentum to continue, or will the overbought four-hour RSI lead to consolidation?
Not financial advice. Always DYOR.
Like & Follow for Daily Trade Analytics & Insider News. @MistralAK
#BREV #Overbought #TradingSignals
$BREV Giving Away You Black Friday Profit - Enter Trade Now
$BREV trades at 0.1000 USD, up 75.7% over the past 24 hours, with 4H RSI at 77.6 (overbought).
The price has moved upward over the past twenty-four hours, pushing the four-hour RSI into overbought territory. Momentum remains firm, though an elevated reading often leads traders to watch for potential consolidation.
KEY LEVELS
▪️ Resistance: 0.1350 USD (20-candle 4H swing high)
▪️ Support: 0.0553 USD (20-candle 4H swing low)
▪️ EMA 20 / EMA 50: 0.0676 / 0.0667 USD (short-term trend filter)
WHAT WOULD CONFIRM CONTINUATION
▪️ RSI holding in the upper zone while price keeps printing higher 4H closes
▪️ Pullbacks holding above EMA 20 (0.0676 USD)
WHAT WOULD SIGNAL COOLING
▪️ A 4H close below EMA 20 (0.0676 USD)
▪️ RSI rolling over while price stalls below 0.1350 USD
Do you expect upward momentum to continue, or will the overbought four-hour RSI lead to consolidation?
Not financial advice. Always DYOR.
Like & Follow for Daily Trade Analytics & Insider News. @MistralAK
#BREV #Overbought #TradingSignals

228
·
--
Bullish
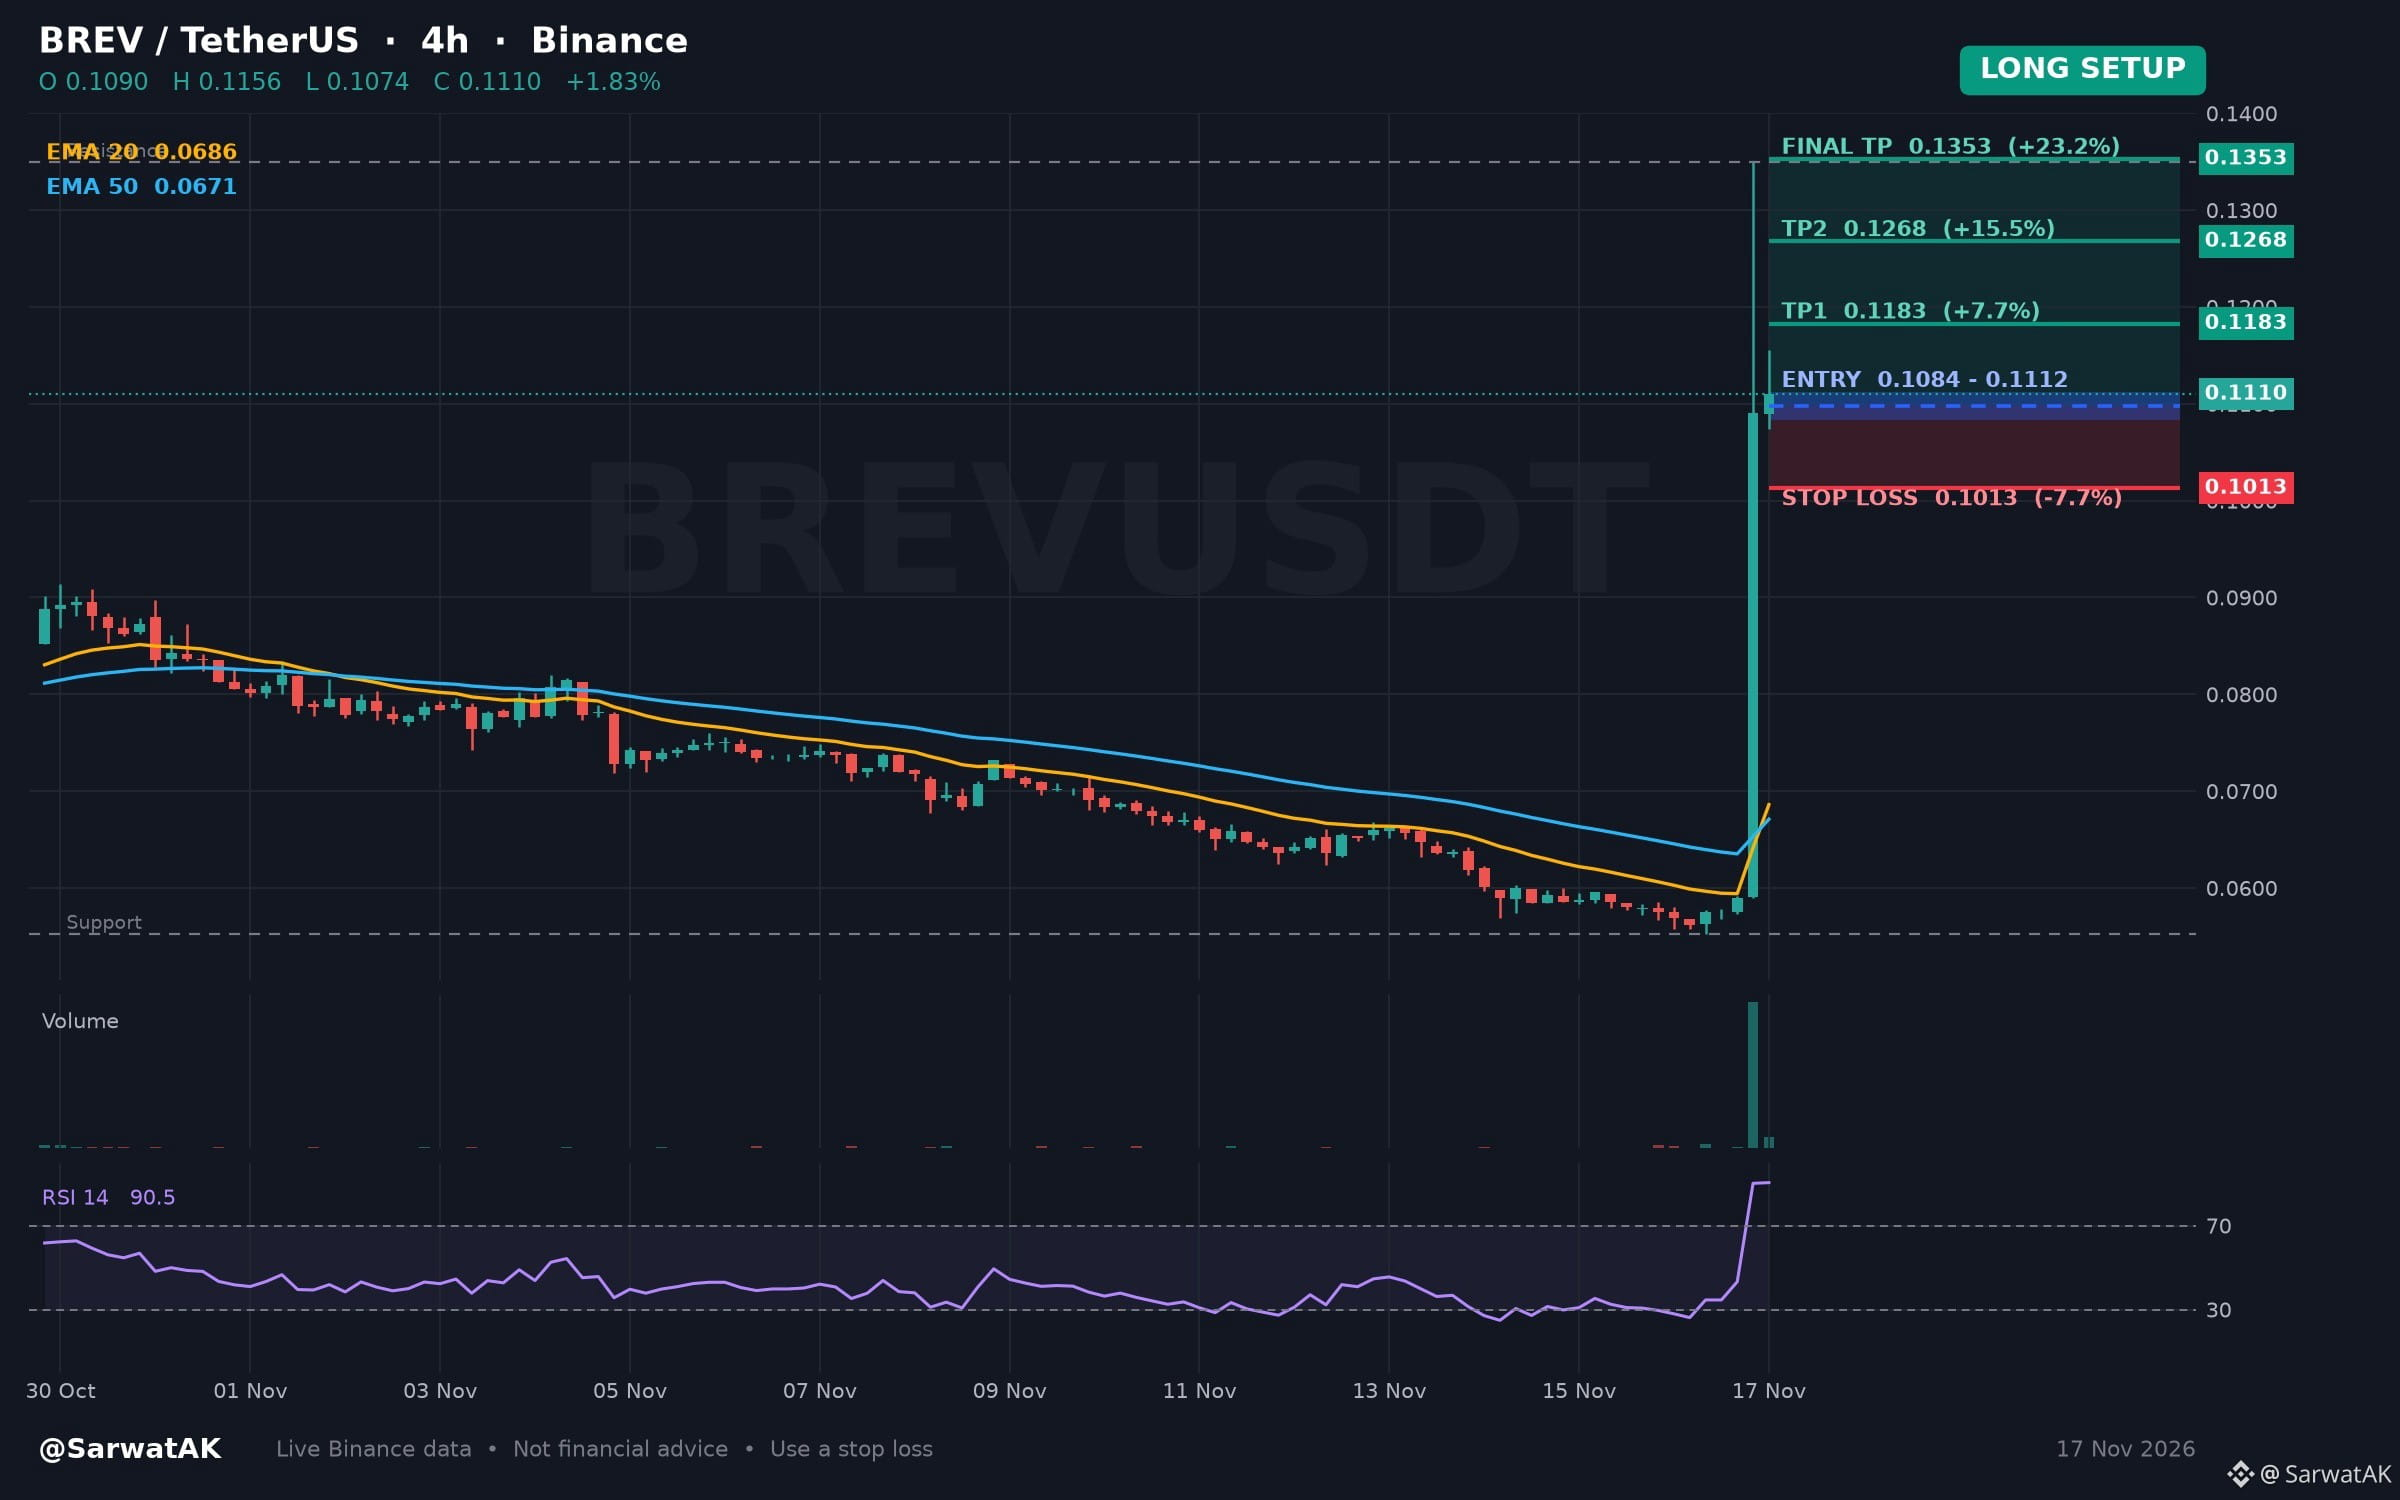
$BREV LONG SETUP ... NEXT TARGET 0.1353
Momentum Elevation and Overbought Signals on the Four-Hour Chart
Entry: 0.1084 - 0.1112 (Long)
TP1: 0.1183
TP2: 0.1268
Final TP: 0.1353
SL: 0.1013
Upward movement over the past twenty-four hours has pushed the relative strength index into overbought territory on the four-hour chart. Traders often monitor such elevated momentum conditions to assess potential consolidation or trend continuation.
As long as 0.1084 holds, structure stays constructive
Must use stop loss while trading
Trade $BREV
Not financial advice. Always DYOR.
🙏 Tips are always welcome and truly appreciated. Thank you for supporting Open to Discussion.
Like & Follow for Daily Trade Analytics & Insider News. @SarwatAK
#BREV #Overbought #TradingSignals
{spot}(BREVUSDT)
$BREV LONG SETUP ... NEXT TARGET 0.1353
Momentum Elevation and Overbought Signals on the Four-Hour Chart
Entry: 0.1084 - 0.1112 (Long)
TP1: 0.1183
TP2: 0.1268
Final TP: 0.1353
SL: 0.1013
Upward movement over the past twenty-four hours has pushed the relative strength index into overbought territory on the four-hour chart. Traders often monitor such elevated momentum conditions to assess potential consolidation or trend continuation.
As long as 0.1084 holds, structure stays constructive
Must use stop loss while trading
Trade $BREV
Not financial advice. Always DYOR.
🙏 Tips are always welcome and truly appreciated. Thank you for supporting Open to Discussion.
Like & Follow for Daily Trade Analytics & Insider News. @SarwatAK
#BREV #Overbought #TradingSignals
Momentum Elevation and Overbought Signals on the Four-Hour Chart
Entry: 0.1084 - 0.1112 (Long)
TP1: 0.1183
TP2: 0.1268
Final TP: 0.1353
SL: 0.1013
Upward movement over the past twenty-four hours has pushed the relative strength index into overbought territory on the four-hour chart. Traders often monitor such elevated momentum conditions to assess potential consolidation or trend continuation.
As long as 0.1084 holds, structure stays constructive
Must use stop loss while trading
Trade $BREV
Not financial advice. Always DYOR.
🙏 Tips are always welcome and truly appreciated. Thank you for supporting Open to Discussion.
Like & Follow for Daily Trade Analytics & Insider News. @SarwatAK
#BREV #Overbought #TradingSignals
297

·
--
🚨 KOMA is going wild! Up 56.3% in 24H, briefly reaching $0.0211!
But here’s the interesting part: down 4.9% in 5 minutes and 5.2% in 1 hour, while OI fell 7.0%; trading volume surged 7.9×, yet retail bullish sentiment climbed to 4.0×. The stronger the rally, the bigger the divide.
📊 What does this mean? A short squeeze may indeed have pushed the price higher, but if you jump in now, the biggest risk is getting the direction right only to end up as the last one holding the bag. The RSI overbought warning isn’t coming out of nowhere, either.
🎯 Key levels:
Resistance: $0.022 / $0.030
Support: $0.0198 / $0.0189
Whether it can hold above $0.021 on strong volume will determine if this rally can continue.
My take: The trend still leans bullish, but absolutely don’t chase blindly! If it holds above $0.021, then watch for $0.022; if it fails to break higher and drops below $0.0189, watch out for a long squeeze.
Do you think KOMA is heading for $0.022 next, or will it pull back to $0.0189 first? 👇
#shortsqueeze #overbought-warning
🚨 KOMA is going wild! Up 56.3% in 24H, briefly reaching $0.0211!
But here’s the interesting part: down 4.9% in 5 minutes and 5.2% in 1 hour, while OI fell 7.0%; trading volume surged 7.9×, yet retail bullish sentiment climbed to 4.0×. The stronger the rally, the bigger the divide.
📊 What does this mean? A short squeeze may indeed have pushed the price higher, but if you jump in now, the biggest risk is getting the direction right only to end up as the last one holding the bag. The RSI overbought warning isn’t coming out of nowhere, either.
🎯 Key levels:
Resistance: $0.022 / $0.030
Support: $0.0198 / $0.0189
Whether it can hold above $0.021 on strong volume will determine if this rally can continue.
My take: The trend still leans bullish, but absolutely don’t chase blindly! If it holds above $0.021, then watch for $0.022; if it fails to break higher and drops below $0.0189, watch out for a long squeeze.
Do you think KOMA is heading for $0.022 next, or will it pull back to $0.0189 first? 👇
#shortsqueeze #overbought-warning
But here’s the interesting part: down 4.9% in 5 minutes and 5.2% in 1 hour, while OI fell 7.0%; trading volume surged 7.9×, yet retail bullish sentiment climbed to 4.0×. The stronger the rally, the bigger the divide.
📊 What does this mean? A short squeeze may indeed have pushed the price higher, but if you jump in now, the biggest risk is getting the direction right only to end up as the last one holding the bag. The RSI overbought warning isn’t coming out of nowhere, either.
🎯 Key levels:
Resistance: $0.022 / $0.030
Support: $0.0198 / $0.0189
Whether it can hold above $0.021 on strong volume will determine if this rally can continue.
My take: The trend still leans bullish, but absolutely don’t chase blindly! If it holds above $0.021, then watch for $0.022; if it fails to break higher and drops below $0.0189, watch out for a long squeeze.
Do you think KOMA is heading for $0.022 next, or will it pull back to $0.0189 first? 👇
#shortsqueeze #overbought-warning
2
·
--
Bullish
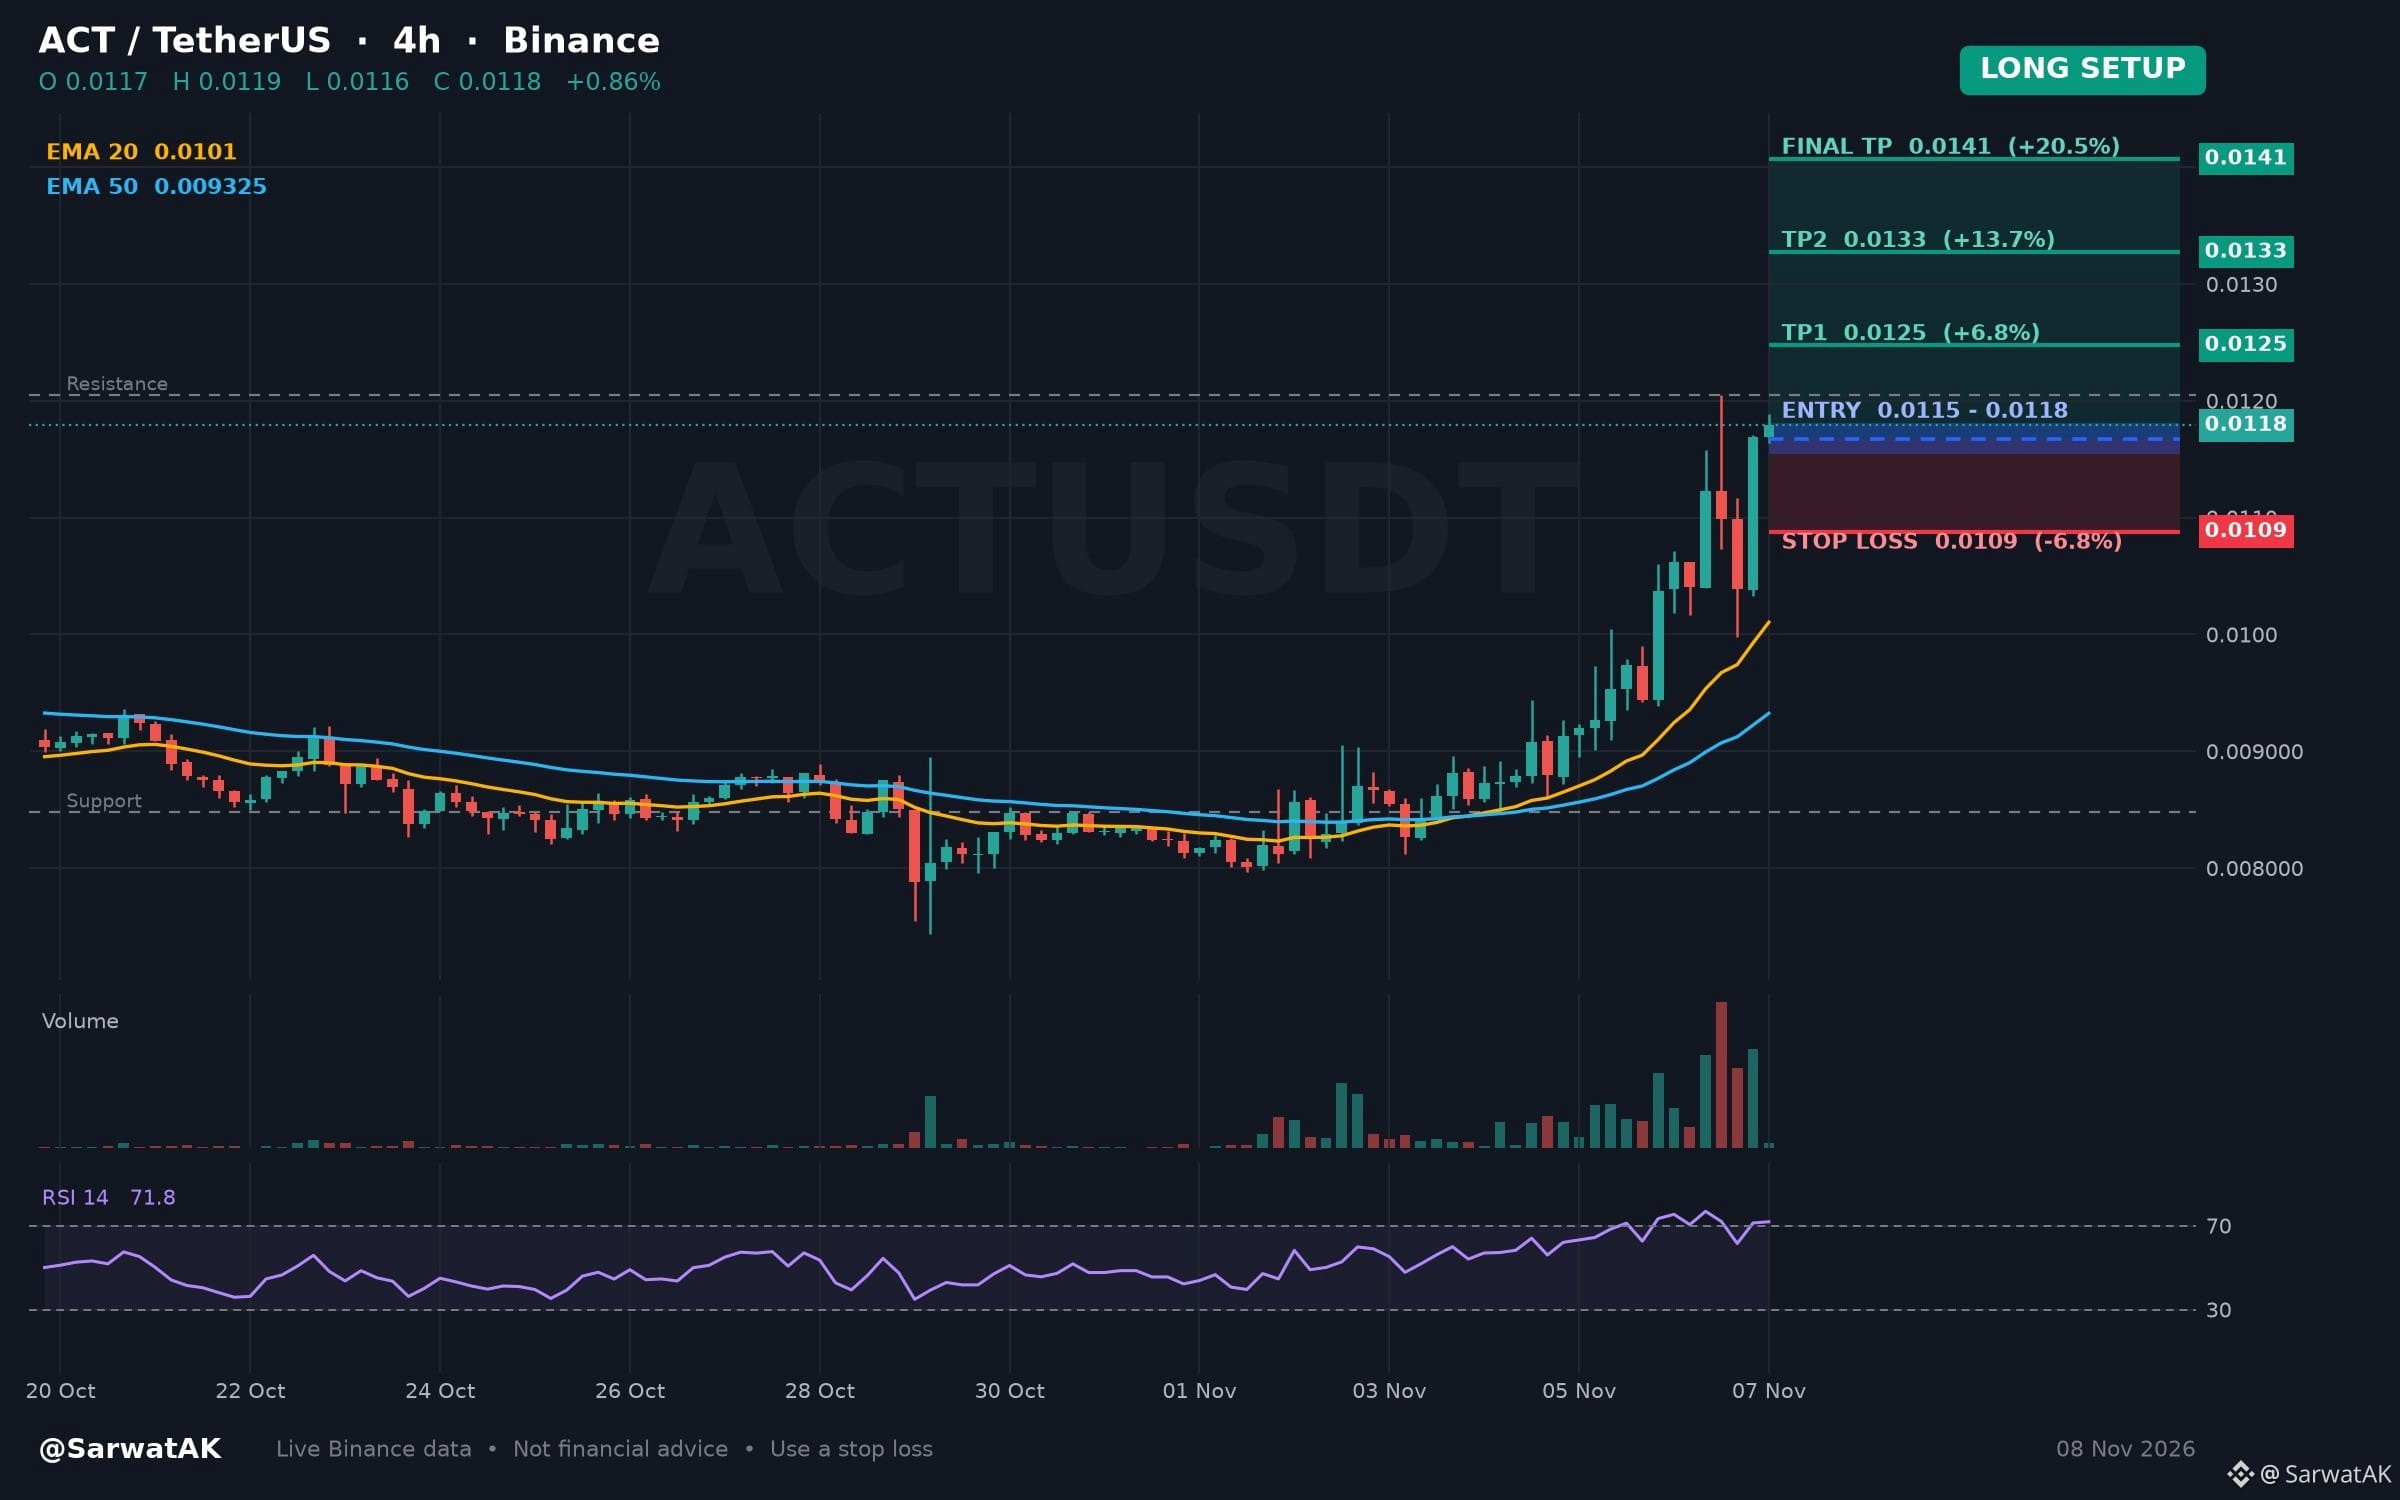
$ACT LONG SETUP ... NEXT TARGET 0.0141
Momentum Reaches Overbought Territory Following Recent Upside Expansion
Entry: 0.0115 - 0.0118 (Long)
TP1: 0.0125
TP2: 0.0133
Final TP: 0.0141
SL: 0.0109
Price action has moved upward over the past twenty-four hours, pushing the RSI into overbought territory on the four-hour chart. Market participants often watch for potential consolidation or cooling after such extended upward moves.
As long as 0.0115 holds, structure stays constructive
Must use stop loss while trading
Trade $ACT
Not financial advice. Always DYOR.
Like & Follow for Daily Trade Analytics & Insider News. @SarwatAK
#ACT #Overbought #TechnicalAnalysis
{spot}(ACTUSDT)
$ACT LONG SETUP ... NEXT TARGET 0.0141
Momentum Reaches Overbought Territory Following Recent Upside Expansion
Entry: 0.0115 - 0.0118 (Long)
TP1: 0.0125
TP2: 0.0133
Final TP: 0.0141
SL: 0.0109
Price action has moved upward over the past twenty-four hours, pushing the RSI into overbought territory on the four-hour chart. Market participants often watch for potential consolidation or cooling after such extended upward moves.
As long as 0.0115 holds, structure stays constructive
Must use stop loss while trading
Trade $ACT
Not financial advice. Always DYOR.
Like & Follow for Daily Trade Analytics & Insider News. @SarwatAK
#ACT #Overbought #TechnicalAnalysis
Momentum Reaches Overbought Territory Following Recent Upside Expansion
Entry: 0.0115 - 0.0118 (Long)
TP1: 0.0125
TP2: 0.0133
Final TP: 0.0141
SL: 0.0109
Price action has moved upward over the past twenty-four hours, pushing the RSI into overbought territory on the four-hour chart. Market participants often watch for potential consolidation or cooling after such extended upward moves.
As long as 0.0115 holds, structure stays constructive
Must use stop loss while trading
Trade $ACT
Not financial advice. Always DYOR.
Like & Follow for Daily Trade Analytics & Insider News. @SarwatAK
#ACT #Overbought #TechnicalAnalysis
195

#Overbought & #oversold
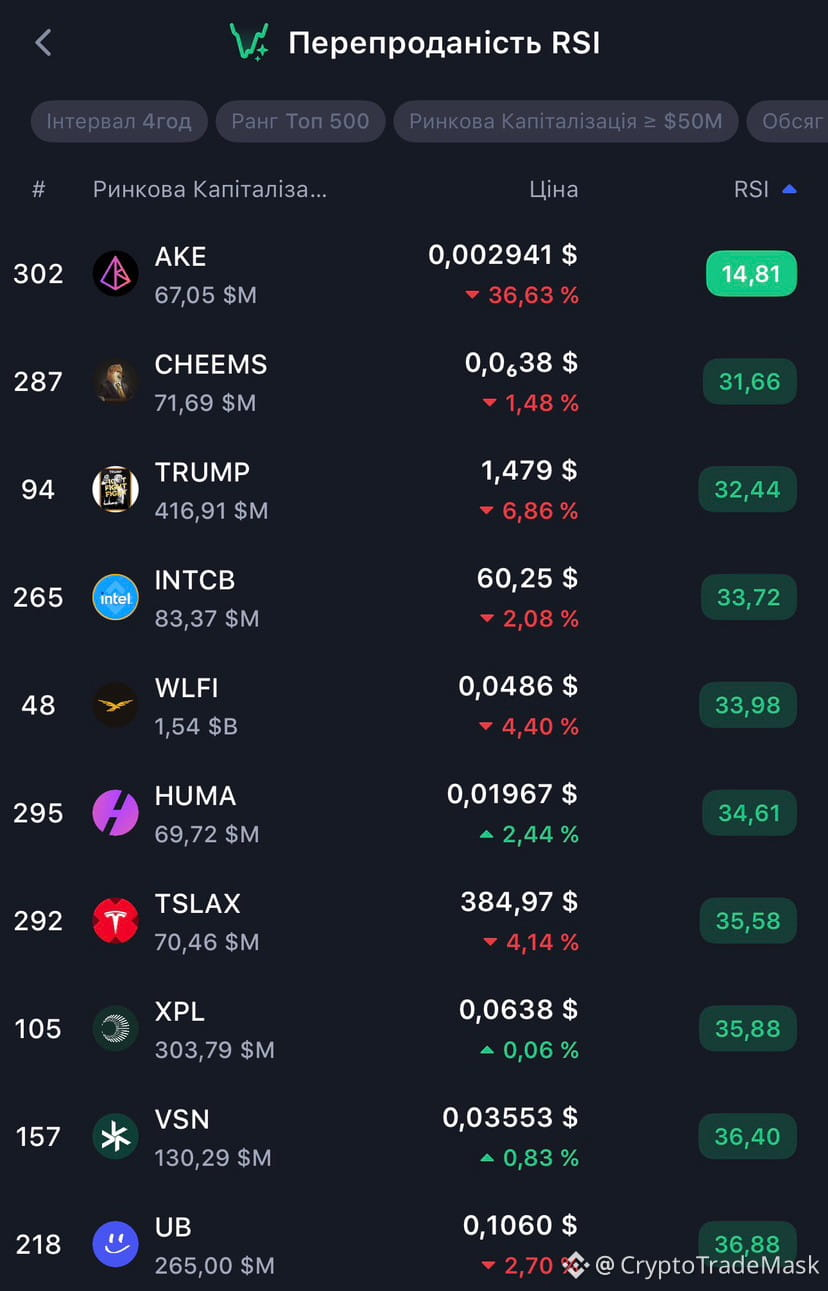
📊 Overbought & Oversold: How does it work? 📈📉
Key market zones that indicate when the price may reverse.
🟢 Oversold
• The price has fallen too low - temporarily or excessively.
• RSI < 30.
• There may be a chance of a rebound - the asset is becoming interesting to buy.
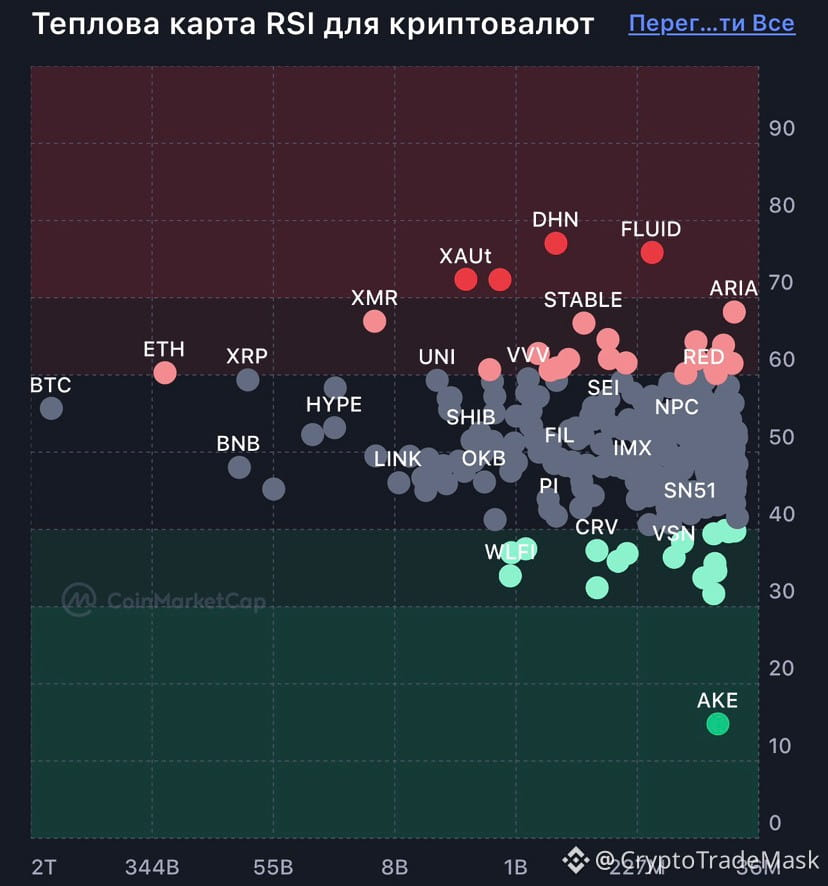
• Many coins are now in this zone: $AKE - a bottom may be forming.
🔴 Overbought
• The price has risen too much.
• RSI > 70.
• A correction or pause after growth is likely - it's time to take profits.
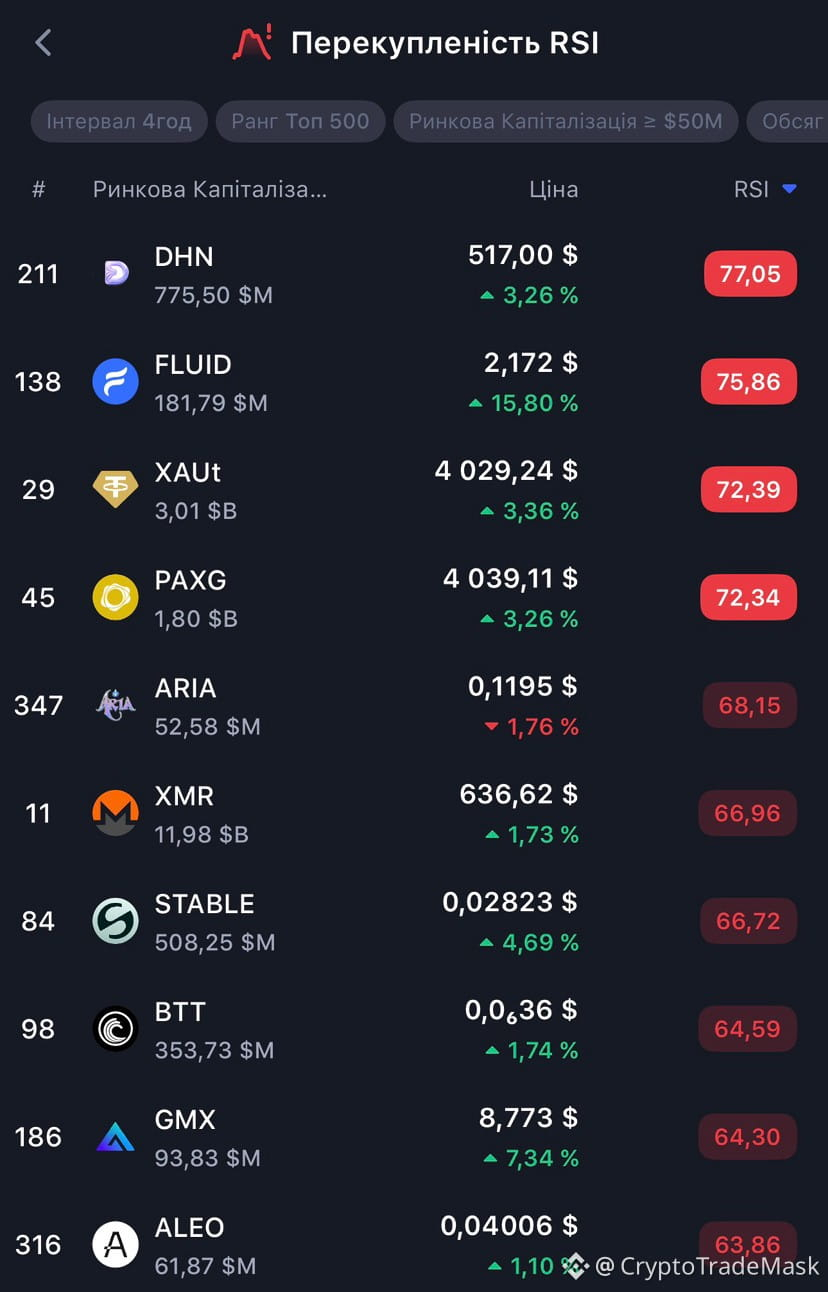
• In this zone now: $FLUID , $PAXG - a cooling after a surge is possible.
⚠️ Rule of thumb: no indicator gives guarantees - they are only hints, not a verdict.
{future}(PAXGUSDT)
{future}(FLUIDUSDT)
{future}(AKEUSDT)
#Overbought & #oversold
📊 Overbought & Oversold: How does it work? 📈📉
Key market zones that indicate when the price may reverse.
🟢 Oversold
• The price has fallen too low - temporarily or excessively.
• RSI < 30.
• There may be a chance of a rebound - the asset is becoming interesting to buy.
• Many coins are now in this zone: $AKE - a bottom may be forming.
🔴 Overbought
• The price has risen too much.
• RSI > 70.
• A correction or pause after growth is likely - it's time to take profits.
• In this zone now: $FLUID , $PAXG - a cooling after a surge is possible.
⚠️ Rule of thumb: no indicator gives guarantees - they are only hints, not a verdict.
📊 Overbought & Oversold: How does it work? 📈📉
Key market zones that indicate when the price may reverse.
🟢 Oversold
• The price has fallen too low - temporarily or excessively.
• RSI < 30.
• There may be a chance of a rebound - the asset is becoming interesting to buy.
• Many coins are now in this zone: $AKE - a bottom may be forming.
🔴 Overbought
• The price has risen too much.
• RSI > 70.
• A correction or pause after growth is likely - it's time to take profits.
• In this zone now: $FLUID , $PAXG - a cooling after a surge is possible.
⚠️ Rule of thumb: no indicator gives guarantees - they are only hints, not a verdict.
1
69

🔴 $EVAA SLIDES INTO OVERBOUGHT ZONE – SHORT ALERT! 🚨
Entry: 1.5299-1.8471 ⚡
Target: 1.360 🚀
Target: 1.155 🚀
Target: 0.9282 🚀
Stop Loss: 2.065 ⚠️
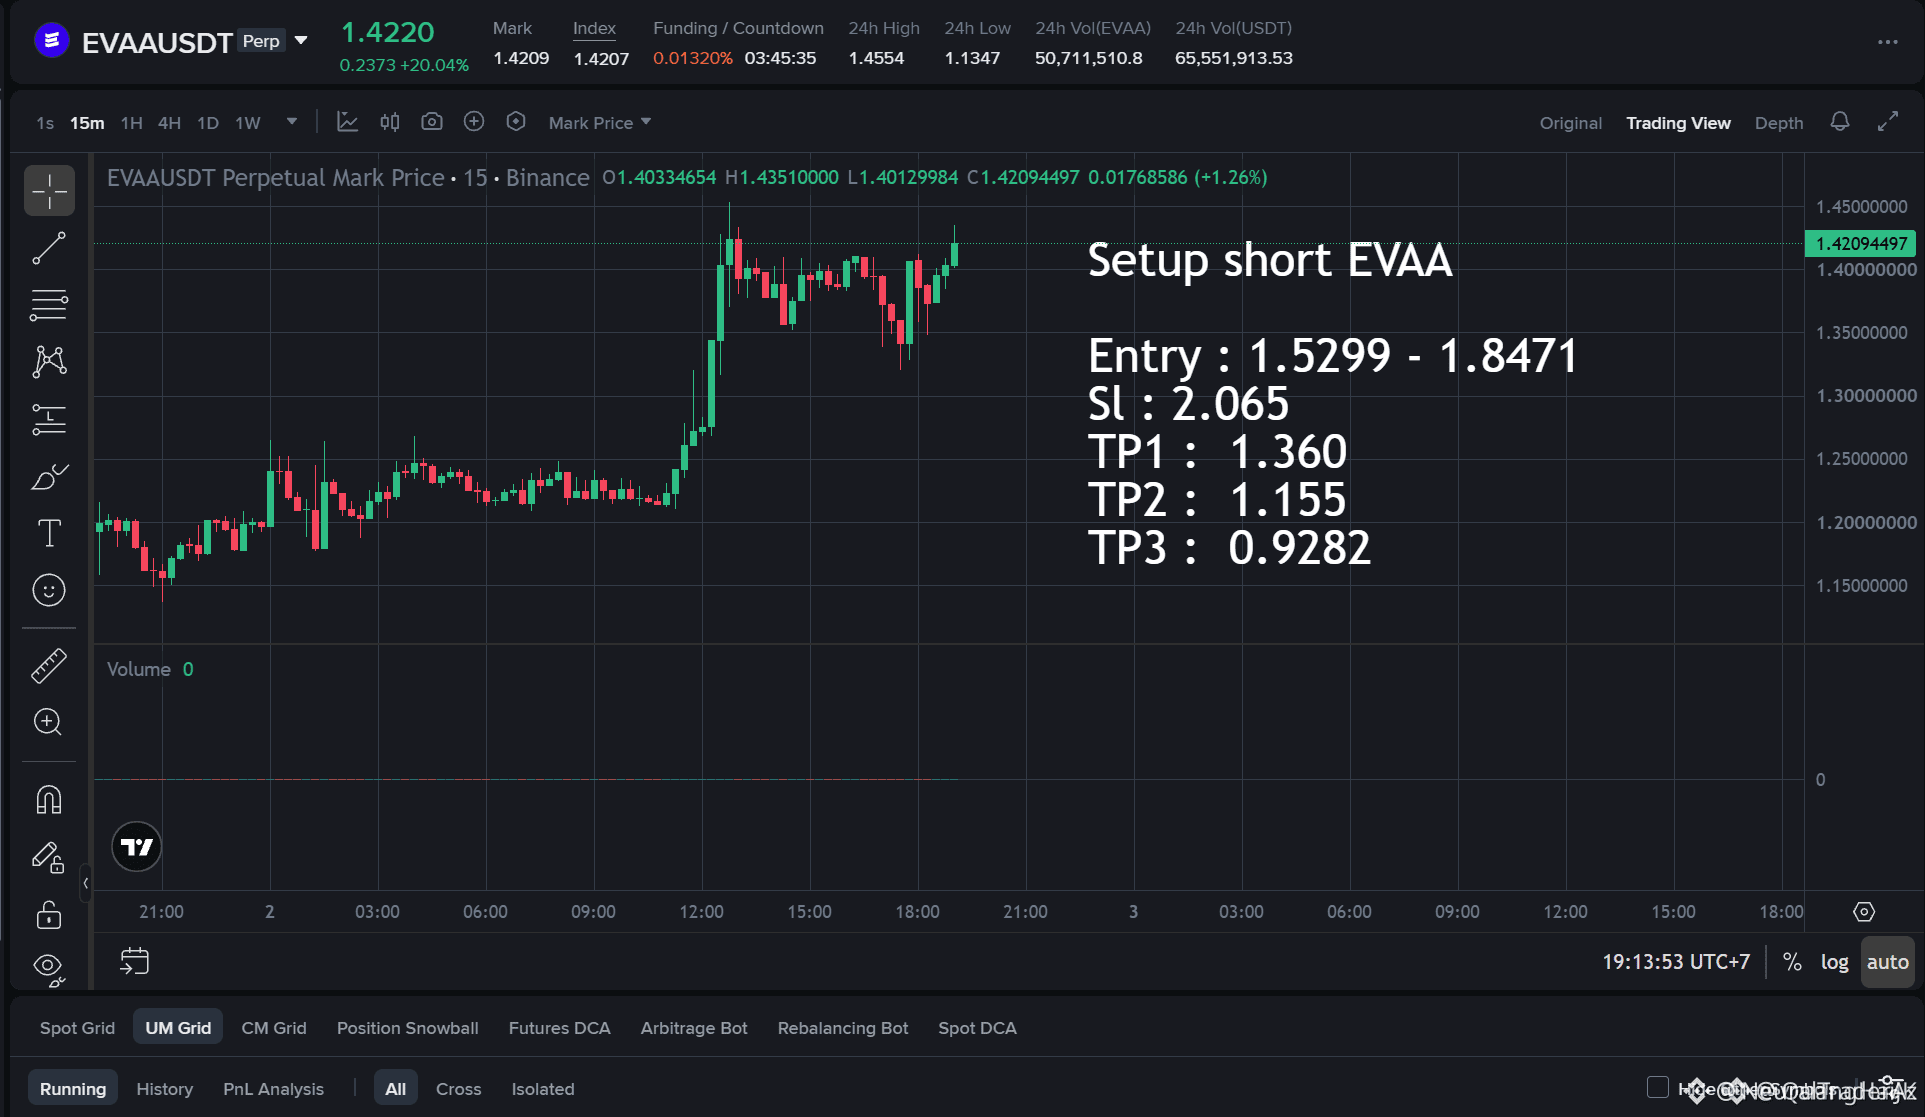
The 1h RSI 6 spiking to 72.68 and RSI 12 at 65.26 flags a classic over‑extension, while price is perched on the upper Bollinger Band around 1.452 – a ripe liquidity pool for smart‑money shorting. 📊⚡
We’re targeting the recent demand cluster between 1.53‑1.85 as a controlled entry zone; the downside corridor to 1.36, 1.155 and 0.9282 aligns with three orderly order‑block breaks, offering a crisp R:R. 📌🌊
💬 Do you see the next liquidity grab below the 1.45 band? 👇
⚠️ Not financial advice. Always manage your risk. 🛡️
🏷️ #EVAA #ShortSetup #Overbought #Crypto
🦈 🔥
🔴 $EVAA SLIDES INTO OVERBOUGHT ZONE – SHORT ALERT! 🚨
Entry: 1.5299-1.8471 ⚡
Target: 1.360 🚀
Target: 1.155 🚀
Target: 0.9282 🚀
Stop Loss: 2.065 ⚠️
The 1h RSI 6 spiking to 72.68 and RSI 12 at 65.26 flags a classic over‑extension, while price is perched on the upper Bollinger Band around 1.452 – a ripe liquidity pool for smart‑money shorting. 📊⚡
We’re targeting the recent demand cluster between 1.53‑1.85 as a controlled entry zone; the downside corridor to 1.36, 1.155 and 0.9282 aligns with three orderly order‑block breaks, offering a crisp R:R. 📌🌊
💬 Do you see the next liquidity grab below the 1.45 band? 👇
⚠️ Not financial advice. Always manage your risk. 🛡️
🏷️ #EVAA #ShortSetup #Overbought #Crypto
🦈 🔥
Entry: 1.5299-1.8471 ⚡
Target: 1.360 🚀
Target: 1.155 🚀
Target: 0.9282 🚀
Stop Loss: 2.065 ⚠️
The 1h RSI 6 spiking to 72.68 and RSI 12 at 65.26 flags a classic over‑extension, while price is perched on the upper Bollinger Band around 1.452 – a ripe liquidity pool for smart‑money shorting. 📊⚡
We’re targeting the recent demand cluster between 1.53‑1.85 as a controlled entry zone; the downside corridor to 1.36, 1.155 and 0.9282 aligns with three orderly order‑block breaks, offering a crisp R:R. 📌🌊
💬 Do you see the next liquidity grab below the 1.45 band? 👇
⚠️ Not financial advice. Always manage your risk. 🛡️
🏷️ #EVAA #ShortSetup #Overbought #Crypto
🦈 🔥
6

🚨 $EVAA SHORT SURGE ON OVERBOUGHT RSI BREAKOUT! 📉
Entry: 1.5299-1.8471 ⚡
Target: 1.360 / 1.155 / 0.9282 🚀
Stop Loss: 2.065 ⚠️
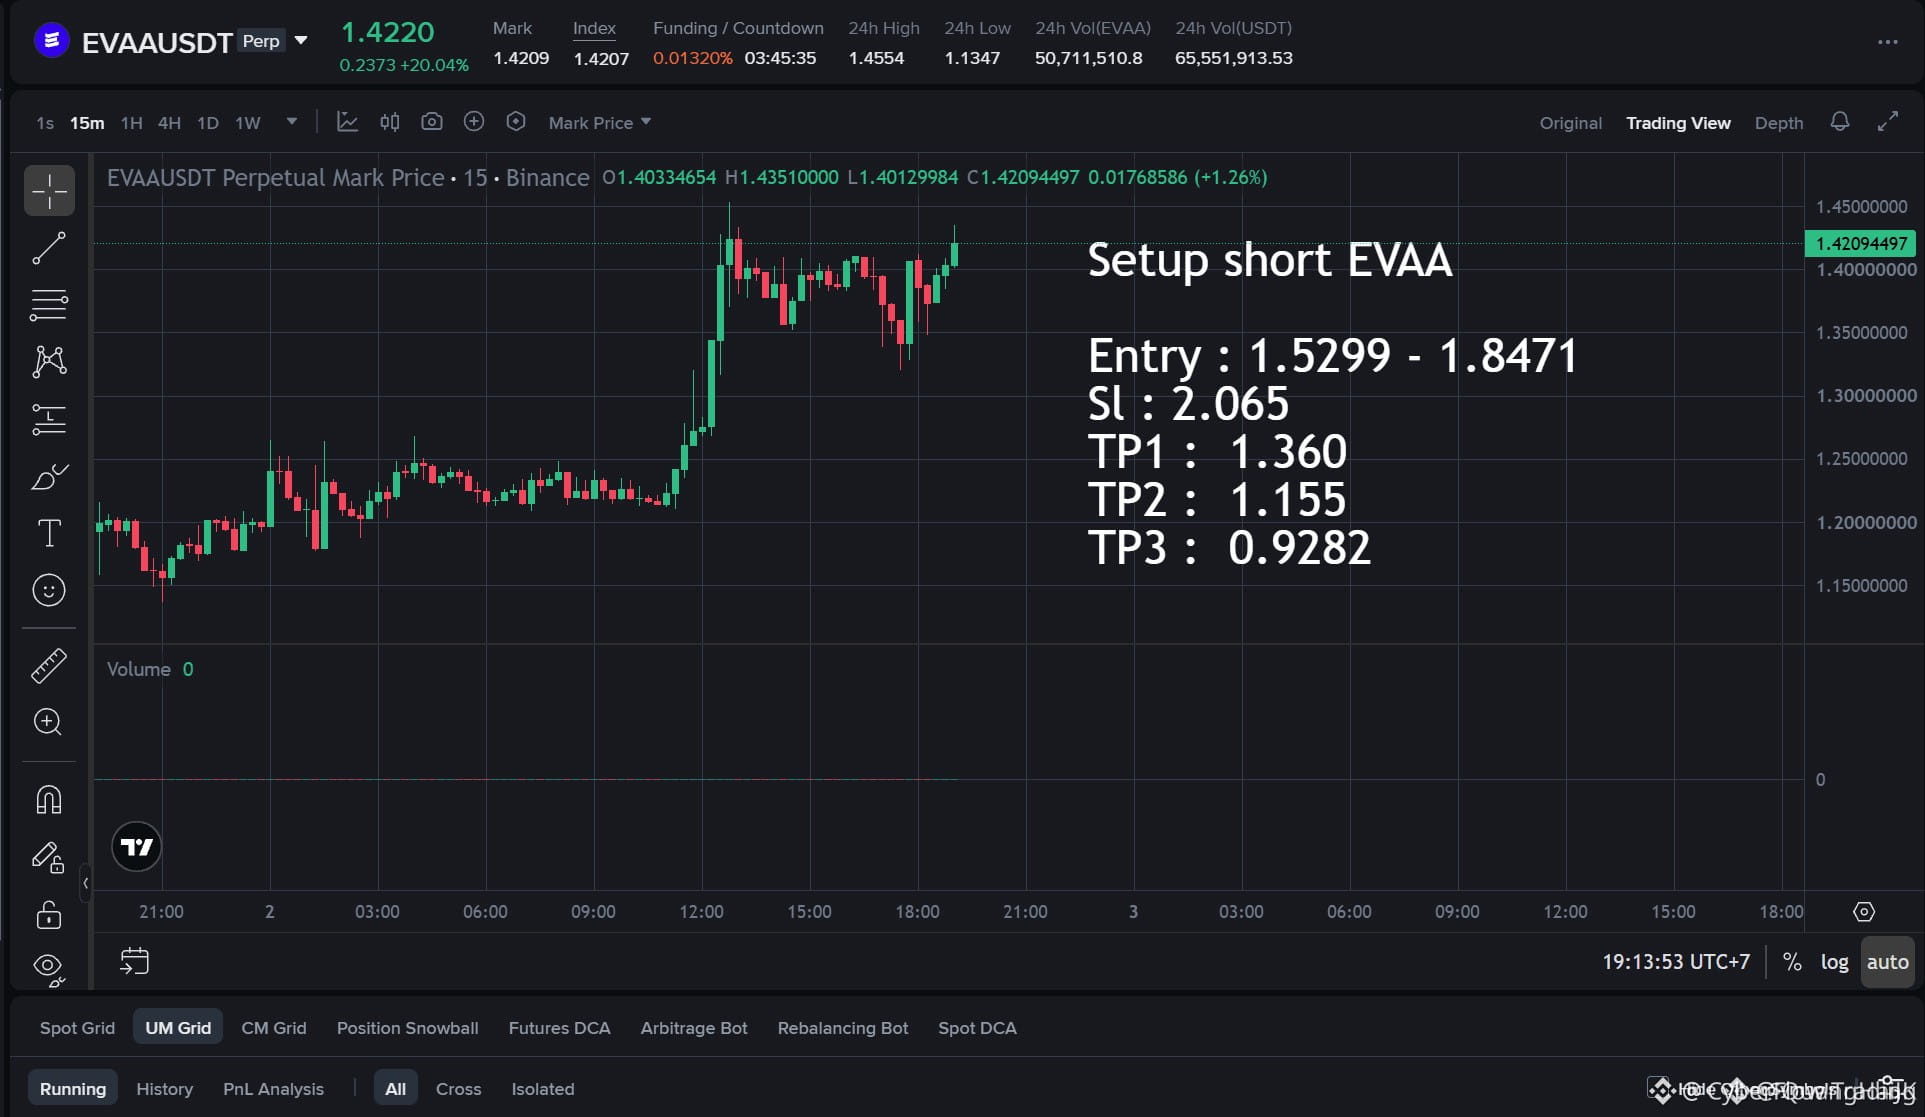
The 1‑hour RSI 6 spiked to 72.68 while RSI 12 sits at 65.26, flashing an overbought flare that’s primed for a quick flip. 📊 Sellers are gathering behind the upper Bollinger Band at 1.452, ready to sweep liquidity.
🦈 Smart‑money sharks have already anchored a demand wall around 1.53‑1.85, so the short entry zone is a tight cage for bears. ⚡ Once the price pierces the band, the path to the 1.36, 1.155 and sub‑0.93 targets is a clean downhill sprint.
💬 Are you ready to ride the downside or waiting for the next squeeze? 👇
⚠️ Not financial advice. Always manage your risk. 🛡️
🏷️ #EVAA #ShortSetup #Overbought #Crypto
🔥 💎
🚨 $EVAA SHORT SURGE ON OVERBOUGHT RSI BREAKOUT! 📉
Entry: 1.5299-1.8471 ⚡
Target: 1.360 / 1.155 / 0.9282 🚀
Stop Loss: 2.065 ⚠️
The 1‑hour RSI 6 spiked to 72.68 while RSI 12 sits at 65.26, flashing an overbought flare that’s primed for a quick flip. 📊 Sellers are gathering behind the upper Bollinger Band at 1.452, ready to sweep liquidity.
🦈 Smart‑money sharks have already anchored a demand wall around 1.53‑1.85, so the short entry zone is a tight cage for bears. ⚡ Once the price pierces the band, the path to the 1.36, 1.155 and sub‑0.93 targets is a clean downhill sprint.
💬 Are you ready to ride the downside or waiting for the next squeeze? 👇
⚠️ Not financial advice. Always manage your risk. 🛡️
🏷️ #EVAA #ShortSetup #Overbought #Crypto
🔥 💎
Entry: 1.5299-1.8471 ⚡
Target: 1.360 / 1.155 / 0.9282 🚀
Stop Loss: 2.065 ⚠️
The 1‑hour RSI 6 spiked to 72.68 while RSI 12 sits at 65.26, flashing an overbought flare that’s primed for a quick flip. 📊 Sellers are gathering behind the upper Bollinger Band at 1.452, ready to sweep liquidity.
🦈 Smart‑money sharks have already anchored a demand wall around 1.53‑1.85, so the short entry zone is a tight cage for bears. ⚡ Once the price pierces the band, the path to the 1.36, 1.155 and sub‑0.93 targets is a clean downhill sprint.
💬 Are you ready to ride the downside or waiting for the next squeeze? 👇
⚠️ Not financial advice. Always manage your risk. 🛡️
🏷️ #EVAA #ShortSetup #Overbought #Crypto
🔥 💎
3
·
--
Bullish
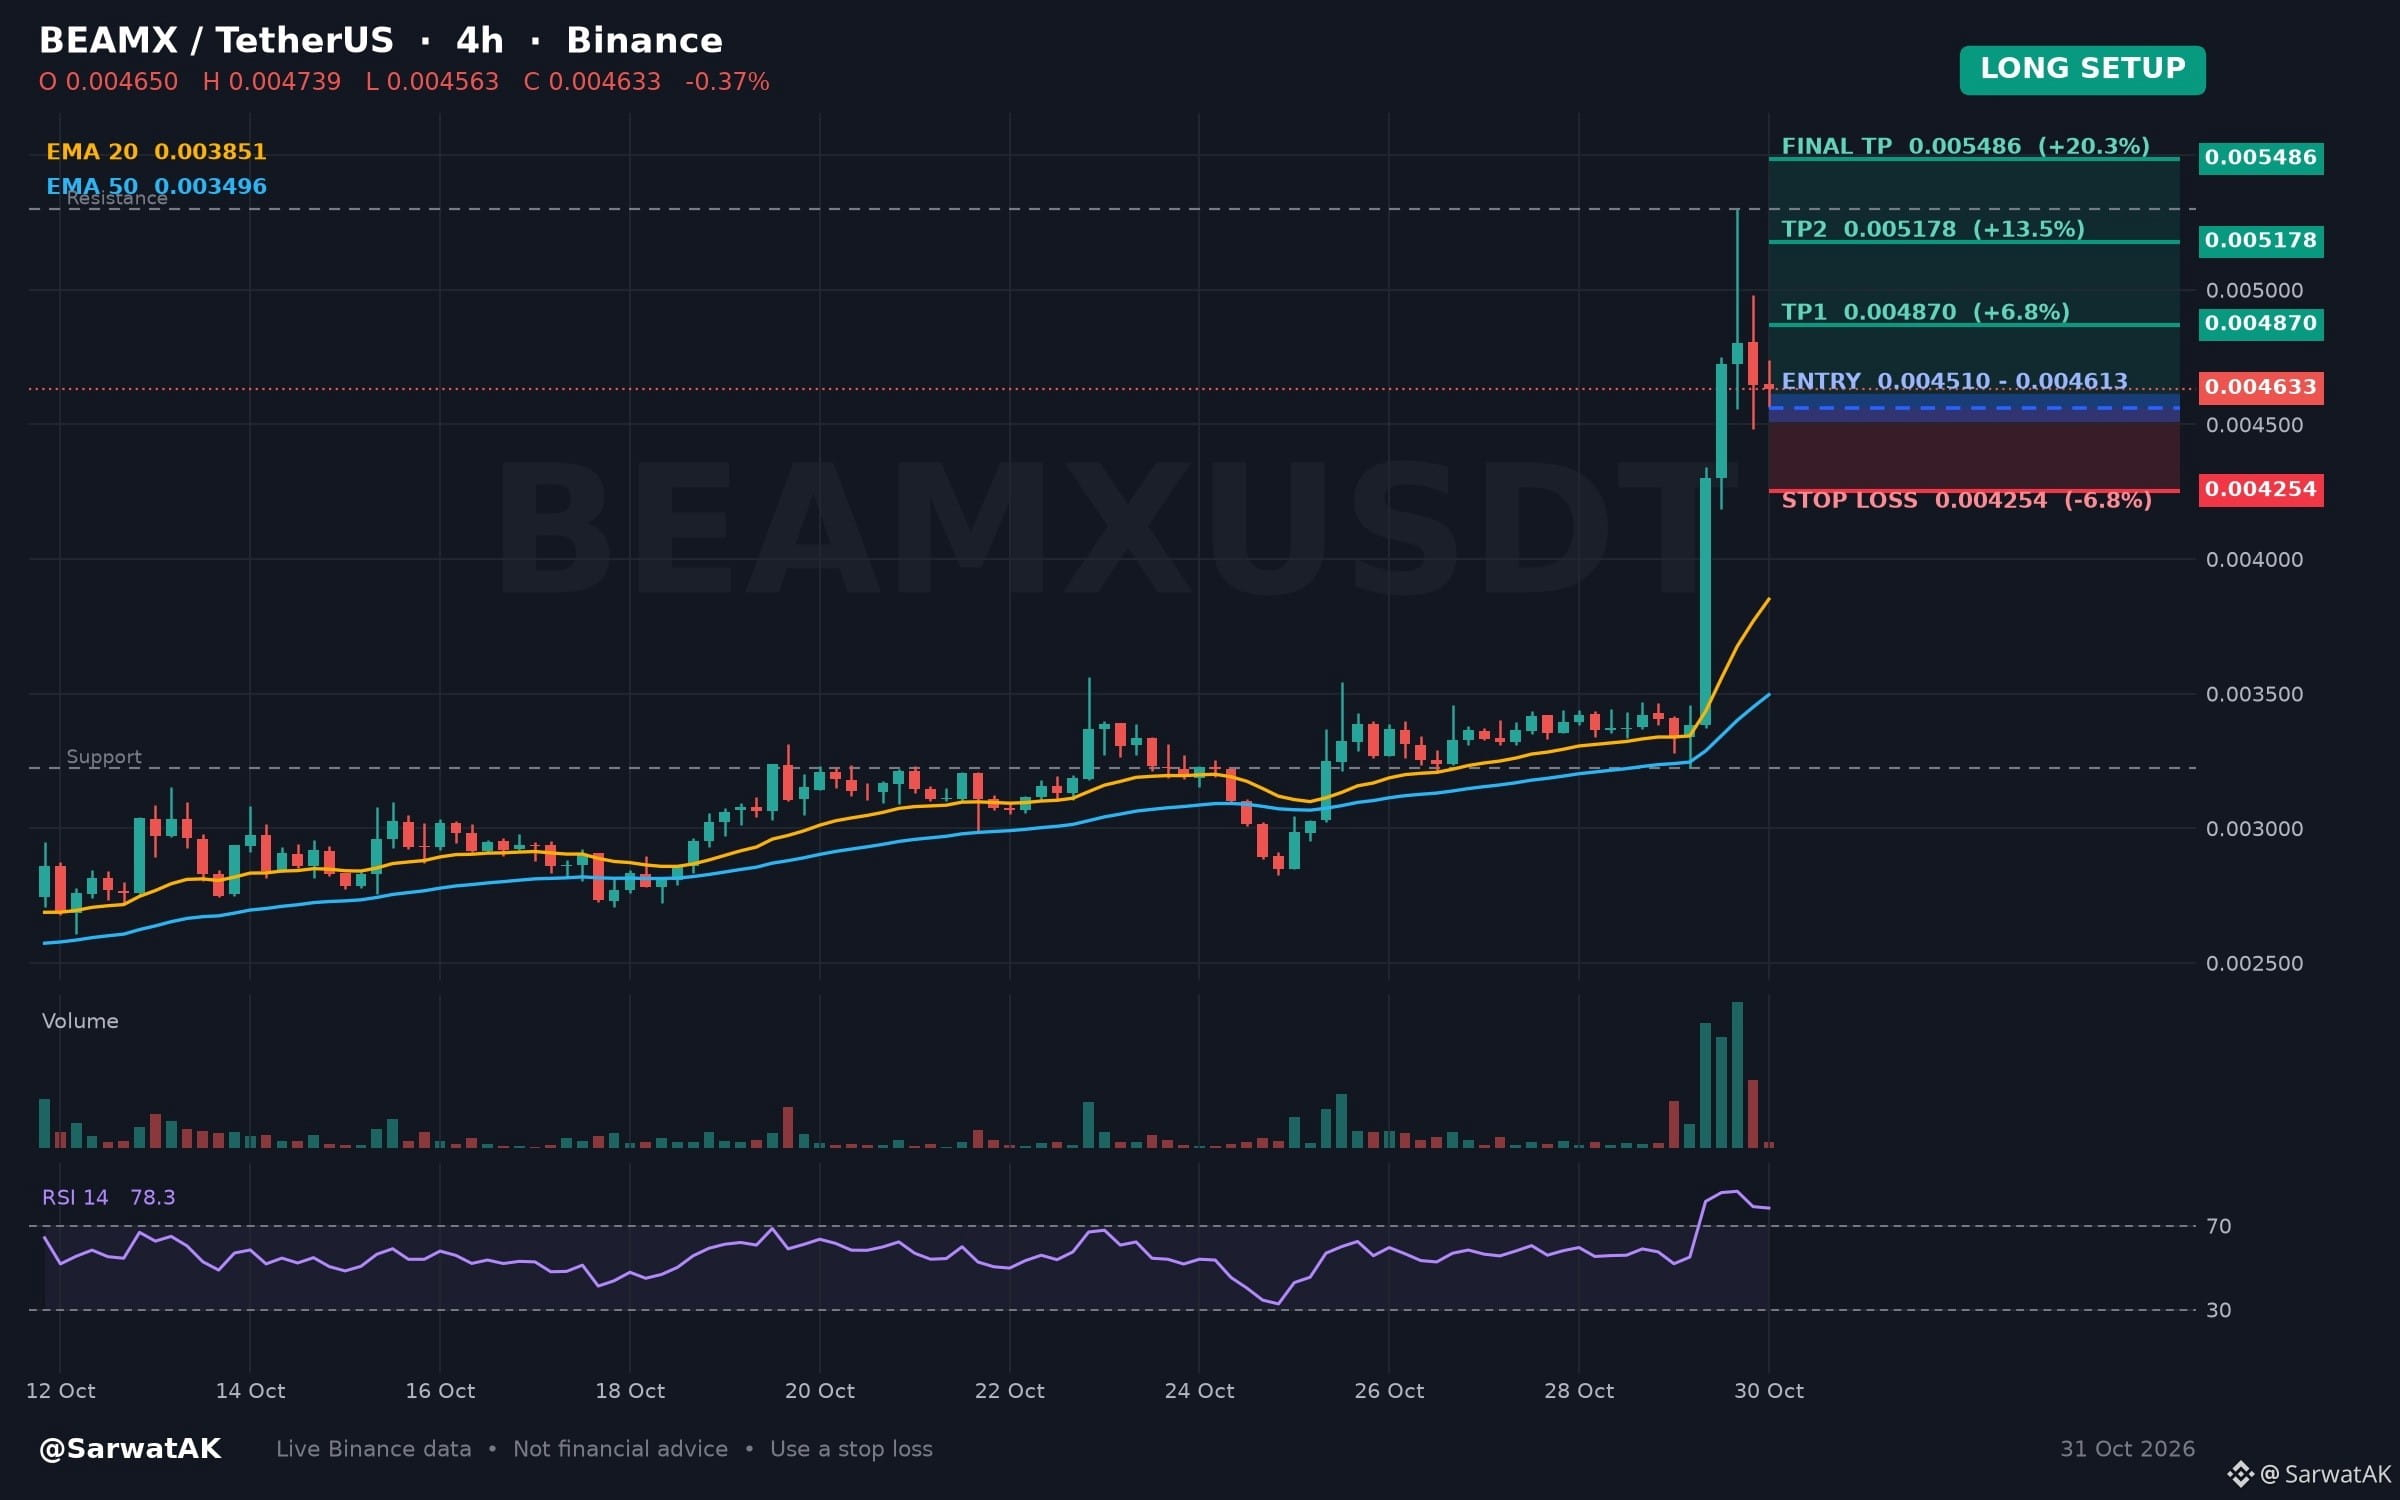
$BEAMX LONG SETUP ... NEXT TARGET 0.005486
Four Hour Momentum Indicator Signals Overbought Status Amid Price Gain
Entry: 0.004510 - 0.004613 (Long)
TP1: 0.004870
TP2: 0.005178
Final TP: 0.005486
SL: 0.004254
Upward movement over the past twenty-four hours has driven the relative strength index on the four-hour chart into overbought territory. Traders often observe these conditions to see if momentum continues or if consolidation develops.
As long as 0.004510 holds, structure stays constructive
Must use stop loss while trading
Trade $BEAMX
Not financial advice. Always DYOR.
Like & Follow for Daily Trade Analytics & Insider News. @SarwatAK
#BEAMX #Overbought #TradingSignals
{future}(BEAMXUSDT)
$BEAMX LONG SETUP ... NEXT TARGET 0.005486
Four Hour Momentum Indicator Signals Overbought Status Amid Price Gain
Entry: 0.004510 - 0.004613 (Long)
TP1: 0.004870
TP2: 0.005178
Final TP: 0.005486
SL: 0.004254
Upward movement over the past twenty-four hours has driven the relative strength index on the four-hour chart into overbought territory. Traders often observe these conditions to see if momentum continues or if consolidation develops.
As long as 0.004510 holds, structure stays constructive
Must use stop loss while trading
Trade $BEAMX
Not financial advice. Always DYOR.
Like & Follow for Daily Trade Analytics & Insider News. @SarwatAK
#BEAMX #Overbought #TradingSignals
Four Hour Momentum Indicator Signals Overbought Status Amid Price Gain
Entry: 0.004510 - 0.004613 (Long)
TP1: 0.004870
TP2: 0.005178
Final TP: 0.005486
SL: 0.004254
Upward movement over the past twenty-four hours has driven the relative strength index on the four-hour chart into overbought territory. Traders often observe these conditions to see if momentum continues or if consolidation develops.
As long as 0.004510 holds, structure stays constructive
Must use stop loss while trading
Trade $BEAMX
Not financial advice. Always DYOR.
Like & Follow for Daily Trade Analytics & Insider News. @SarwatAK
#BEAMX #Overbought #TradingSignals
1
1
98

·
--
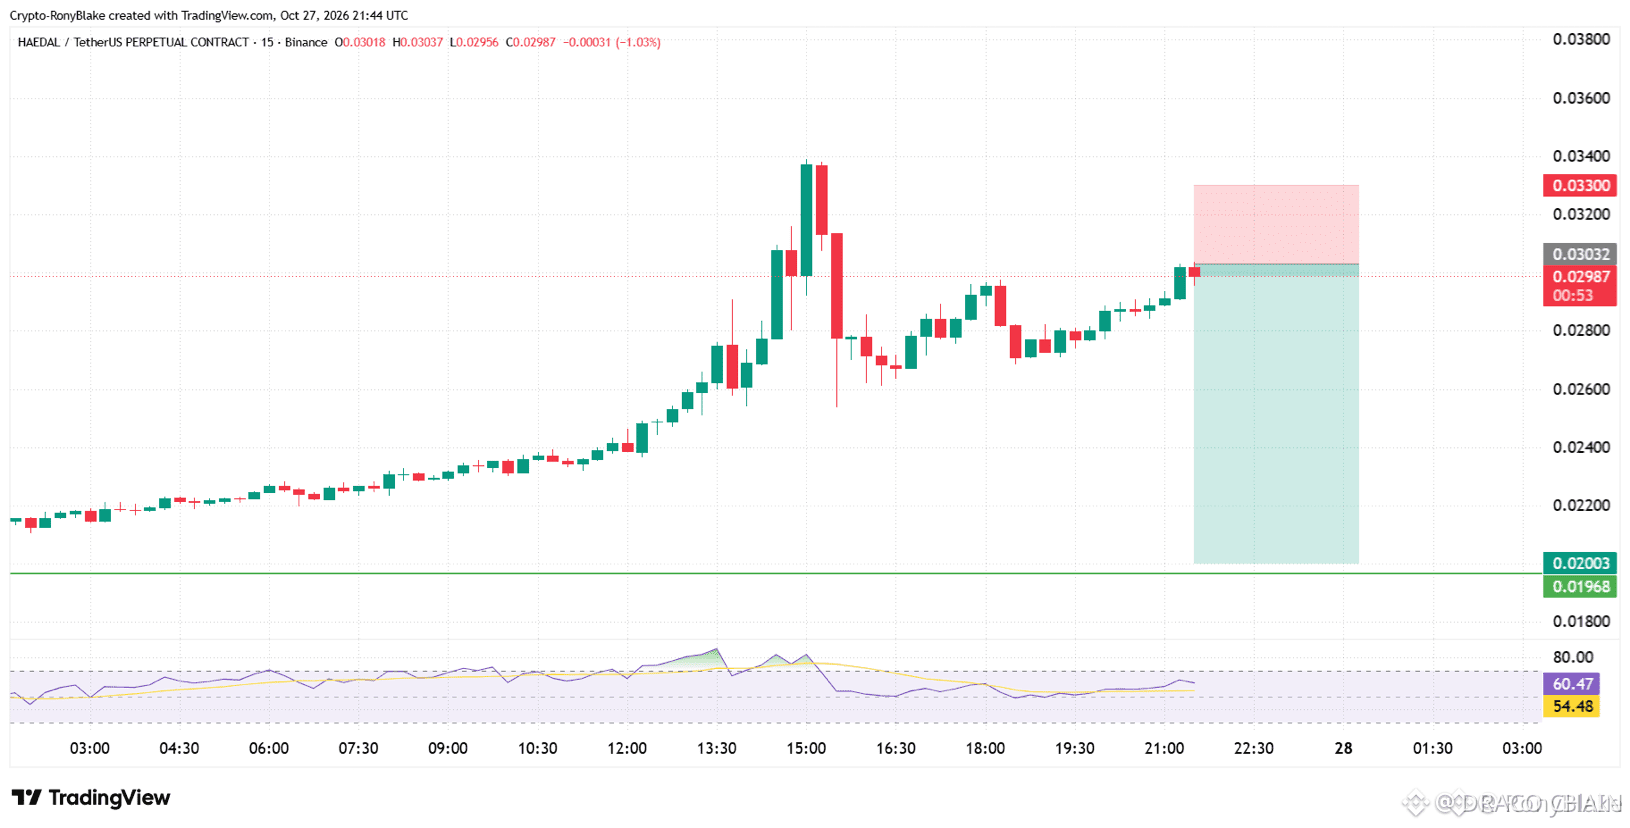
🔴 $HAEDAL SLIPPING INTO OVERBOUGHT TRAP – SHORT TIMEFRAME ALERT! 📉
Target: 0.024 / 0.020 🚀
Stop Loss: 0.033 ⚠️
The 4‑hour RSI is deep in the overbought zone, flashing a clear exhaustion signal 📊. Volume has been tapering while price still climbs, a classic sign that buying pressure is evaporating 🦈.
Liquidity is stacking above the $0.033 barrier, primed for a swift dump. A short positioned now captures the imminent reversal with a clean risk‑to‑reward profile 💡.
💬 Are you ready to ride the pullback or waiting for a deeper break? 👇
⚠️ Not financial advice. Always manage your risk. 🛡️
🏷️ #HAEDAL #ShortSetup #Overbought #Crypto
🚀 🔥
🔴 $HAEDAL SLIPPING INTO OVERBOUGHT TRAP – SHORT TIMEFRAME ALERT! 📉
Target: 0.024 / 0.020 🚀
Stop Loss: 0.033 ⚠️
The 4‑hour RSI is deep in the overbought zone, flashing a clear exhaustion signal 📊. Volume has been tapering while price still climbs, a classic sign that buying pressure is evaporating 🦈.
Liquidity is stacking above the $0.033 barrier, primed for a swift dump. A short positioned now captures the imminent reversal with a clean risk‑to‑reward profile 💡.
💬 Are you ready to ride the pullback or waiting for a deeper break? 👇
⚠️ Not financial advice. Always manage your risk. 🛡️
🏷️ #HAEDAL #ShortSetup #Overbought #Crypto
🚀 🔥
Target: 0.024 / 0.020 🚀
Stop Loss: 0.033 ⚠️
The 4‑hour RSI is deep in the overbought zone, flashing a clear exhaustion signal 📊. Volume has been tapering while price still climbs, a classic sign that buying pressure is evaporating 🦈.
Liquidity is stacking above the $0.033 barrier, primed for a swift dump. A short positioned now captures the imminent reversal with a clean risk‑to‑reward profile 💡.
💬 Are you ready to ride the pullback or waiting for a deeper break? 👇
⚠️ Not financial advice. Always manage your risk. 🛡️
🏷️ #HAEDAL #ShortSetup #Overbought #Crypto
🚀 🔥
4
#Overbought & #oversold
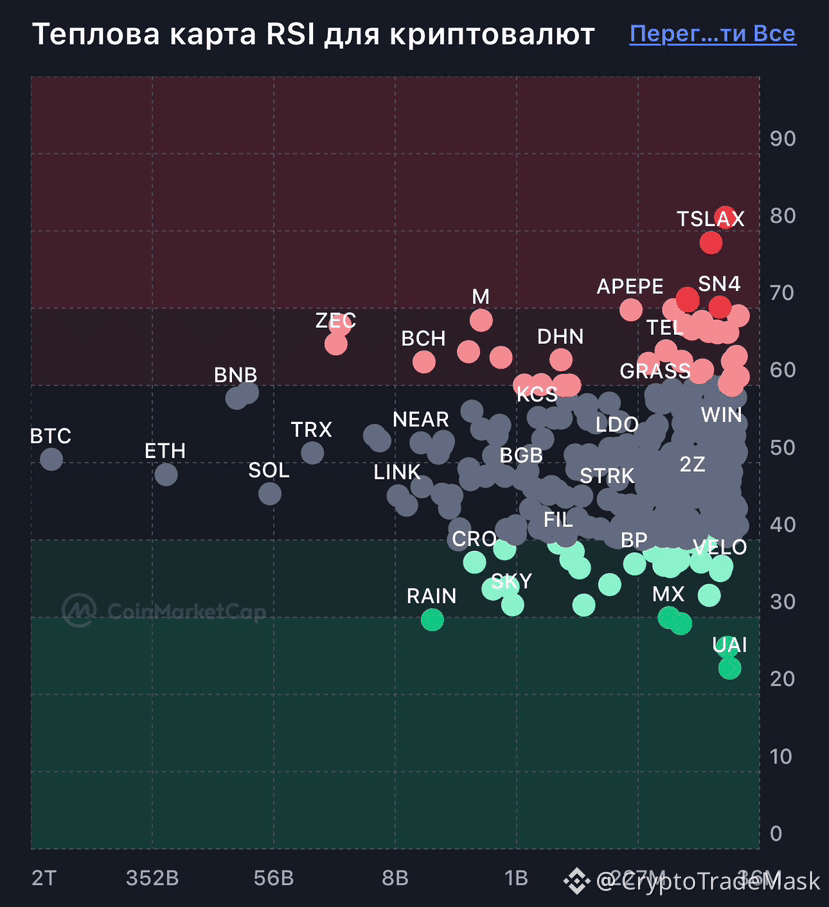
📊 Overbought & Oversold: How does it work? 📈📉
Key market zones that indicate when the price may reverse.
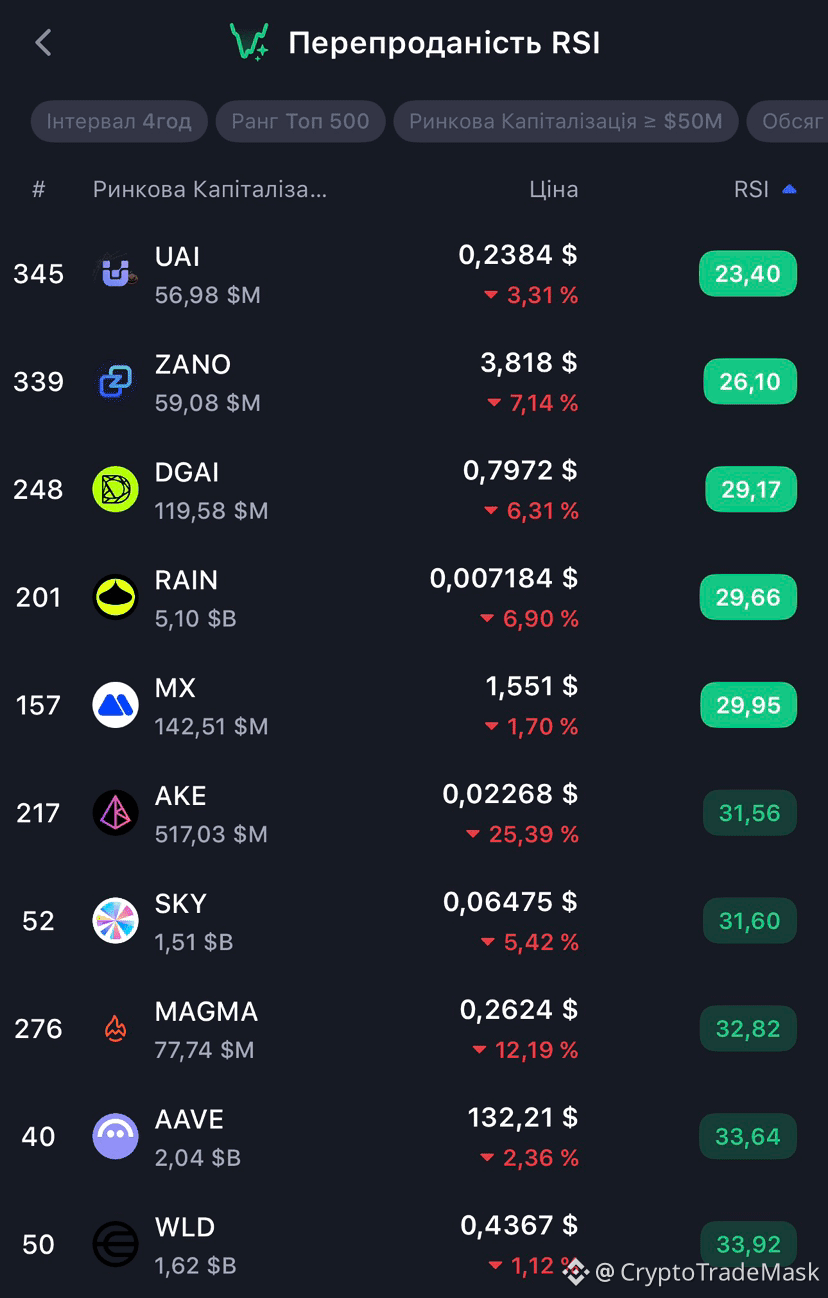
🟢 Oversold
• The price has fallen too low - temporarily or excessively.
• RSI < 30.
• There may be a chance of a rebound - the asset is becoming interesting to buy.
• Many coins are now in this zone: $UAI - a bottom may be forming.
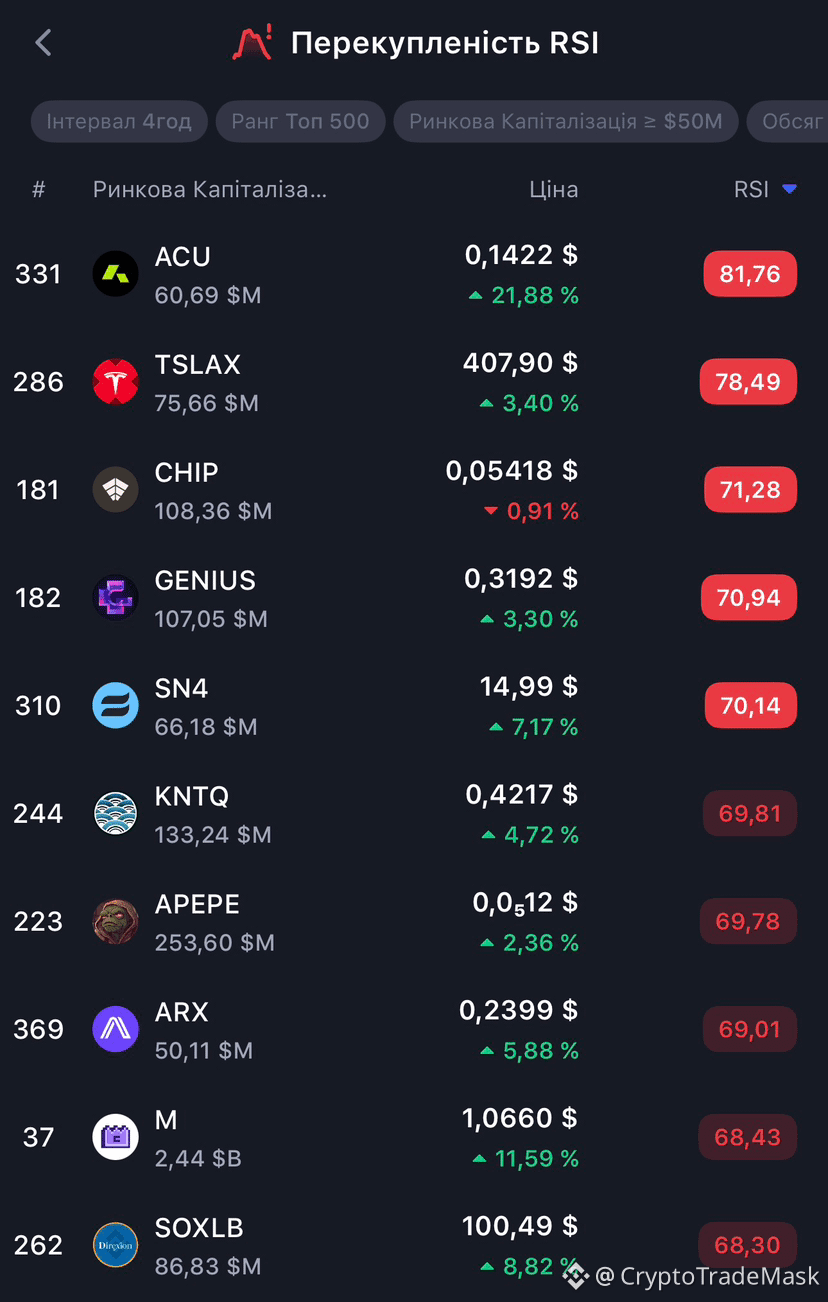
🔴 Overbought
• The price has risen too much.
• RSI > 70.
• A correction or pause after growth is likely - it's time to take profits.
• In this zone now: $ACU , $CHIP - a cooling after a surge is possible.
⚠️ Rule of thumb: no indicator gives guarantees - they are only hints, not a verdict.
{future}(CHIPUSDT)
{future}(ACUUSDT)
{future}(UAIUSDT)
#Overbought & #oversold
📊 Overbought & Oversold: How does it work? 📈📉
Key market zones that indicate when the price may reverse.
🟢 Oversold
• The price has fallen too low - temporarily or excessively.
• RSI < 30.
• There may be a chance of a rebound - the asset is becoming interesting to buy.
• Many coins are now in this zone: $UAI - a bottom may be forming.
🔴 Overbought
• The price has risen too much.
• RSI > 70.
• A correction or pause after growth is likely - it's time to take profits.
• In this zone now: $ACU , $CHIP - a cooling after a surge is possible.
⚠️ Rule of thumb: no indicator gives guarantees - they are only hints, not a verdict.
📊 Overbought & Oversold: How does it work? 📈📉
Key market zones that indicate when the price may reverse.
🟢 Oversold
• The price has fallen too low - temporarily or excessively.
• RSI < 30.
• There may be a chance of a rebound - the asset is becoming interesting to buy.
• Many coins are now in this zone: $UAI - a bottom may be forming.
🔴 Overbought
• The price has risen too much.
• RSI > 70.
• A correction or pause after growth is likely - it's time to take profits.
• In this zone now: $ACU , $CHIP - a cooling after a surge is possible.
⚠️ Rule of thumb: no indicator gives guarantees - they are only hints, not a verdict.
1
851
#Overbought & #oversold
📊 Overbought & Oversold: How does it work? 📈📉
Key market zones that indicate when the price may reverse.
🟢 Oversold
• The price has fallen too low - temporarily or excessively.
• RSI < 30.
• There may be a chance of a rebound - the asset is becoming interesting to buy.
• Many coins are now in this zone: $XAUT ,$RLC
- a bottom may be forming.
🔴 Overbought
• The price has risen too much.
• RSI > 70.
• A correction or pause after growth is likely - it's time to take profits.
• In this zone now: $ELF - a cooling after a surge is possible.
⚠️ Rule of thumb: no indicator gives guarantees - they are only hints, not a verdict.
{future}(PAXGUSDT)
{future}(RLCUSDT)
{future}(XAUTUSDT)
#Overbought & #oversold
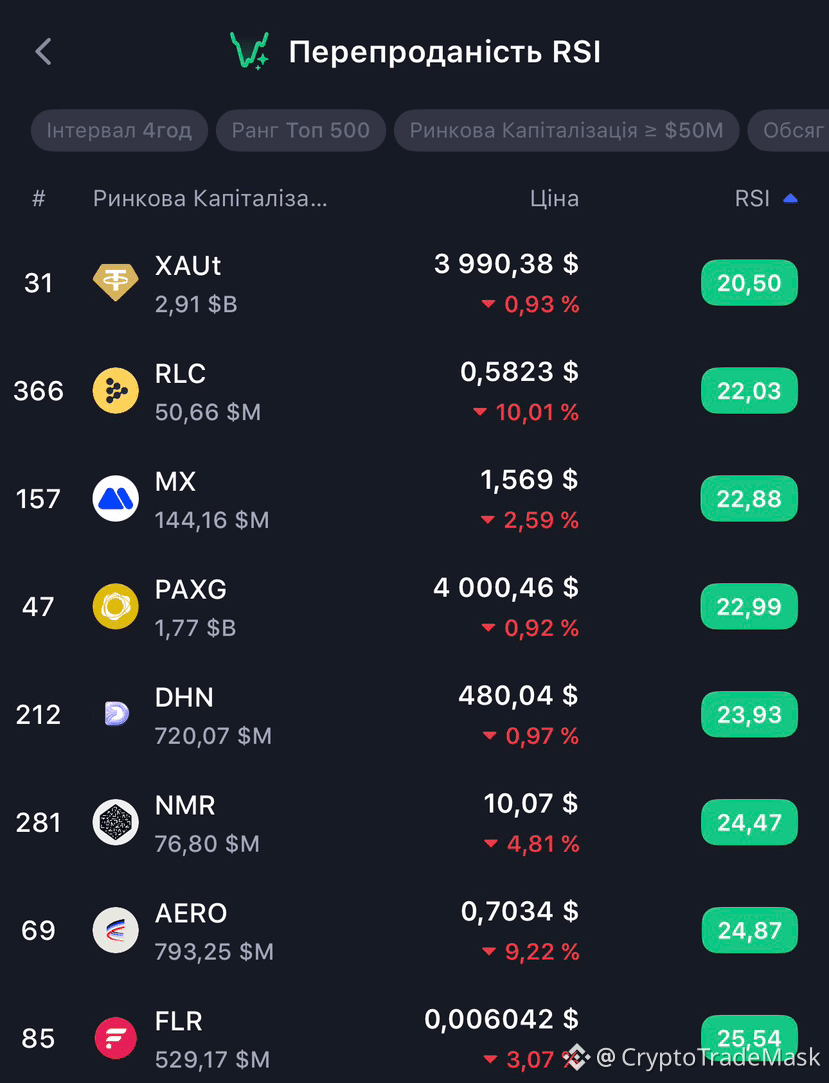
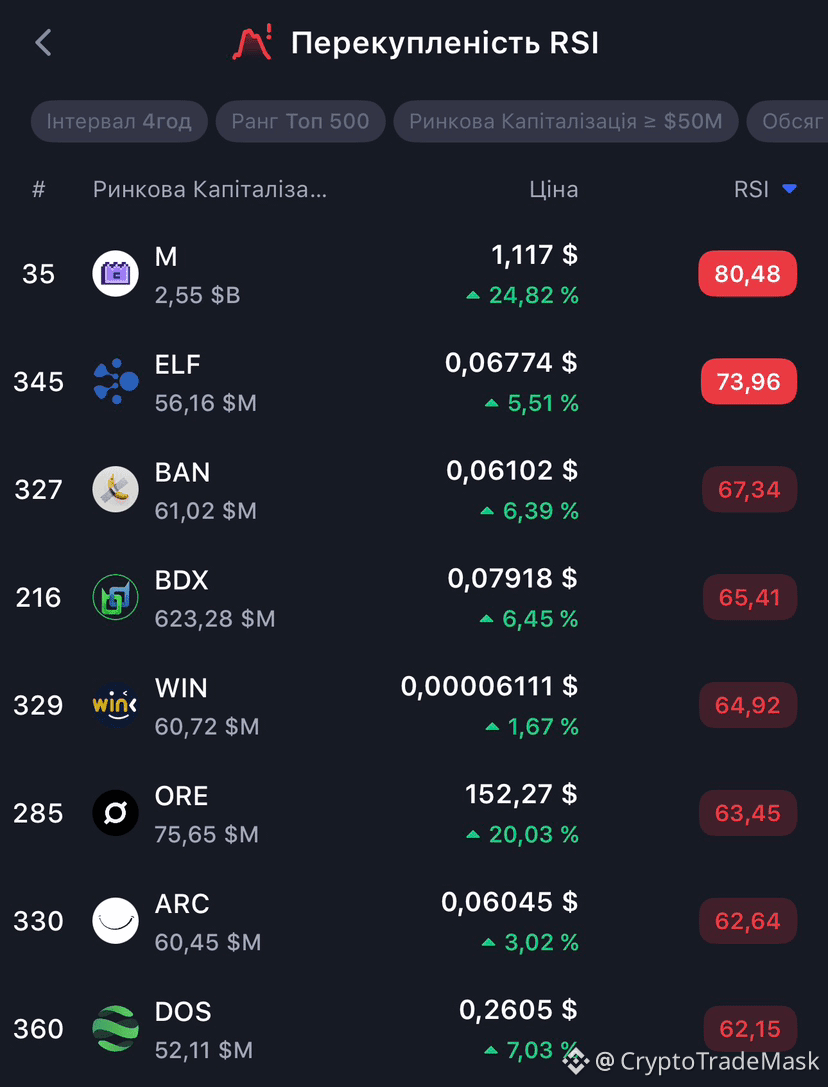
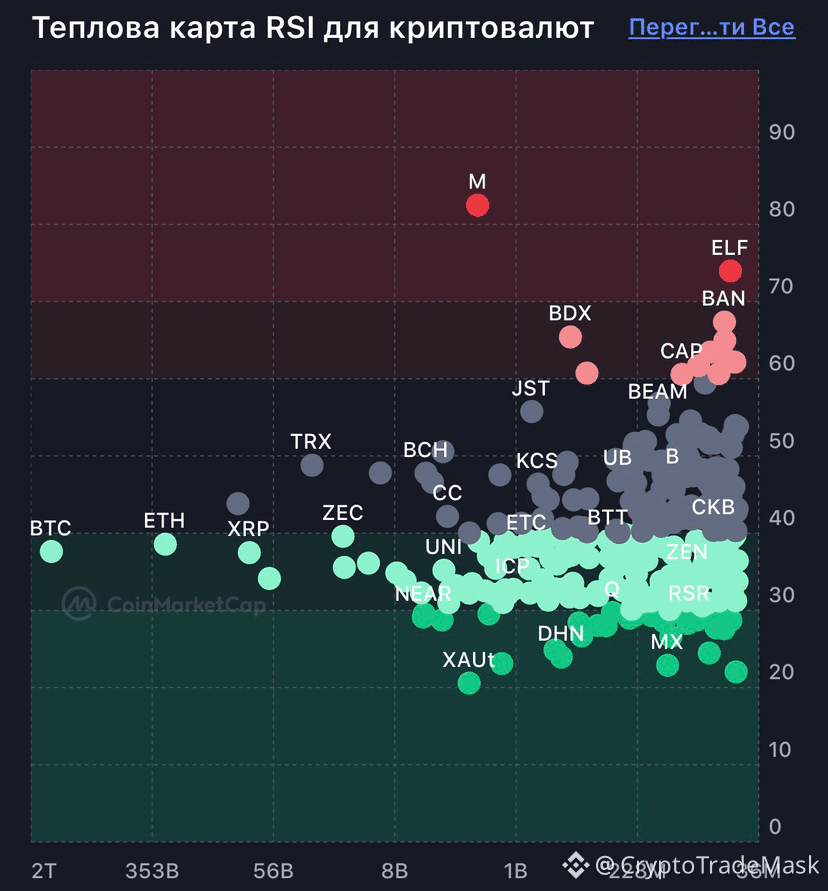
📊 Overbought & Oversold: How does it work? 📈📉
Key market zones that indicate when the price may reverse.
🟢 Oversold
• The price has fallen too low - temporarily or excessively.
• RSI < 30.
• There may be a chance of a rebound - the asset is becoming interesting to buy.
• Many coins are now in this zone: $XAUT ,$RLC
- a bottom may be forming.
🔴 Overbought
• The price has risen too much.
• RSI > 70.
• A correction or pause after growth is likely - it's time to take profits.
• In this zone now: $ELF - a cooling after a surge is possible.
⚠️ Rule of thumb: no indicator gives guarantees - they are only hints, not a verdict.
📊 Overbought & Oversold: How does it work? 📈📉
Key market zones that indicate when the price may reverse.
🟢 Oversold
• The price has fallen too low - temporarily or excessively.
• RSI < 30.
• There may be a chance of a rebound - the asset is becoming interesting to buy.
• Many coins are now in this zone: $XAUT ,$RLC
- a bottom may be forming.
🔴 Overbought
• The price has risen too much.
• RSI > 70.
• A correction or pause after growth is likely - it's time to take profits.
• In this zone now: $ELF - a cooling after a surge is possible.
⚠️ Rule of thumb: no indicator gives guarantees - they are only hints, not a verdict.
1
639

·
--
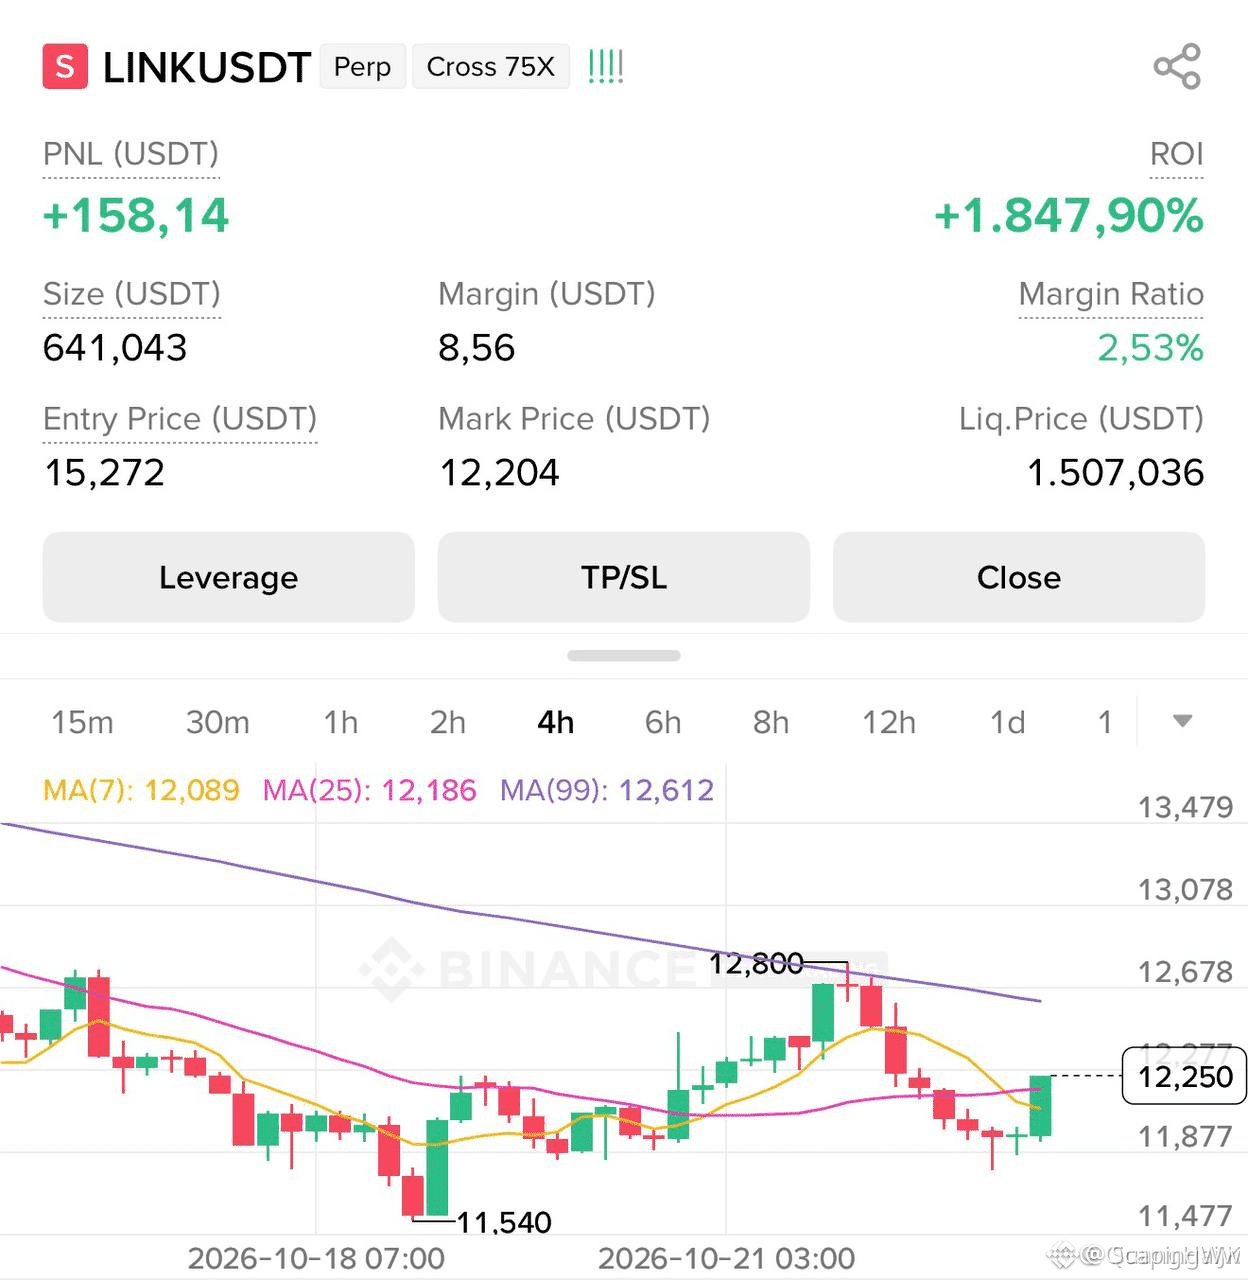
🚨 $LINK CRASH ALERT: SHORT THE OVERBOUGHT SPIKE! 🔴
Entry: 12.8-14.2 ⚡
Target: 11.9 🚀
Target: 10.3 🚀
Target: 9.6 🚀
Stop Loss: 15.6 ⚠️
RSI_6 just blew past 80, and $LINK punched the upper Bollinger Band at $12.19, screaming a classic overbought flare‑up. The momentum engine is revving, but the price is perched on a fragile peak ready to tumble. 📊⚡
Smart money is likely flushing out lingering longs, hunting the next liquidity pool. A clean short from 12.8‑14.2 targets 11.9, 10.3 and 9.6, while the stop sits at 15.6 to guard against a sudden reversal. 🌊💡
💬 Are you positioning your bids for the downside swing?
⚠️ Not financial advice. Always manage your risk. 🛡️
🏷️ #LINK #ShortSetup #Overbought #Crypto
🔥 💎
🚨 $LINK CRASH ALERT: SHORT THE OVERBOUGHT SPIKE! 🔴
Entry: 12.8-14.2 ⚡
Target: 11.9 🚀
Target: 10.3 🚀
Target: 9.6 🚀
Stop Loss: 15.6 ⚠️
RSI_6 just blew past 80, and $LINK punched the upper Bollinger Band at $12.19, screaming a classic overbought flare‑up. The momentum engine is revving, but the price is perched on a fragile peak ready to tumble. 📊⚡
Smart money is likely flushing out lingering longs, hunting the next liquidity pool. A clean short from 12.8‑14.2 targets 11.9, 10.3 and 9.6, while the stop sits at 15.6 to guard against a sudden reversal. 🌊💡
💬 Are you positioning your bids for the downside swing?
⚠️ Not financial advice. Always manage your risk. 🛡️
🏷️ #LINK #ShortSetup #Overbought #Crypto
🔥 💎
Entry: 12.8-14.2 ⚡
Target: 11.9 🚀
Target: 10.3 🚀
Target: 9.6 🚀
Stop Loss: 15.6 ⚠️
RSI_6 just blew past 80, and $LINK punched the upper Bollinger Band at $12.19, screaming a classic overbought flare‑up. The momentum engine is revving, but the price is perched on a fragile peak ready to tumble. 📊⚡
Smart money is likely flushing out lingering longs, hunting the next liquidity pool. A clean short from 12.8‑14.2 targets 11.9, 10.3 and 9.6, while the stop sits at 15.6 to guard against a sudden reversal. 🌊💡
💬 Are you positioning your bids for the downside swing?
⚠️ Not financial advice. Always manage your risk. 🛡️
🏷️ #LINK #ShortSetup #Overbought #Crypto
🔥 💎
20
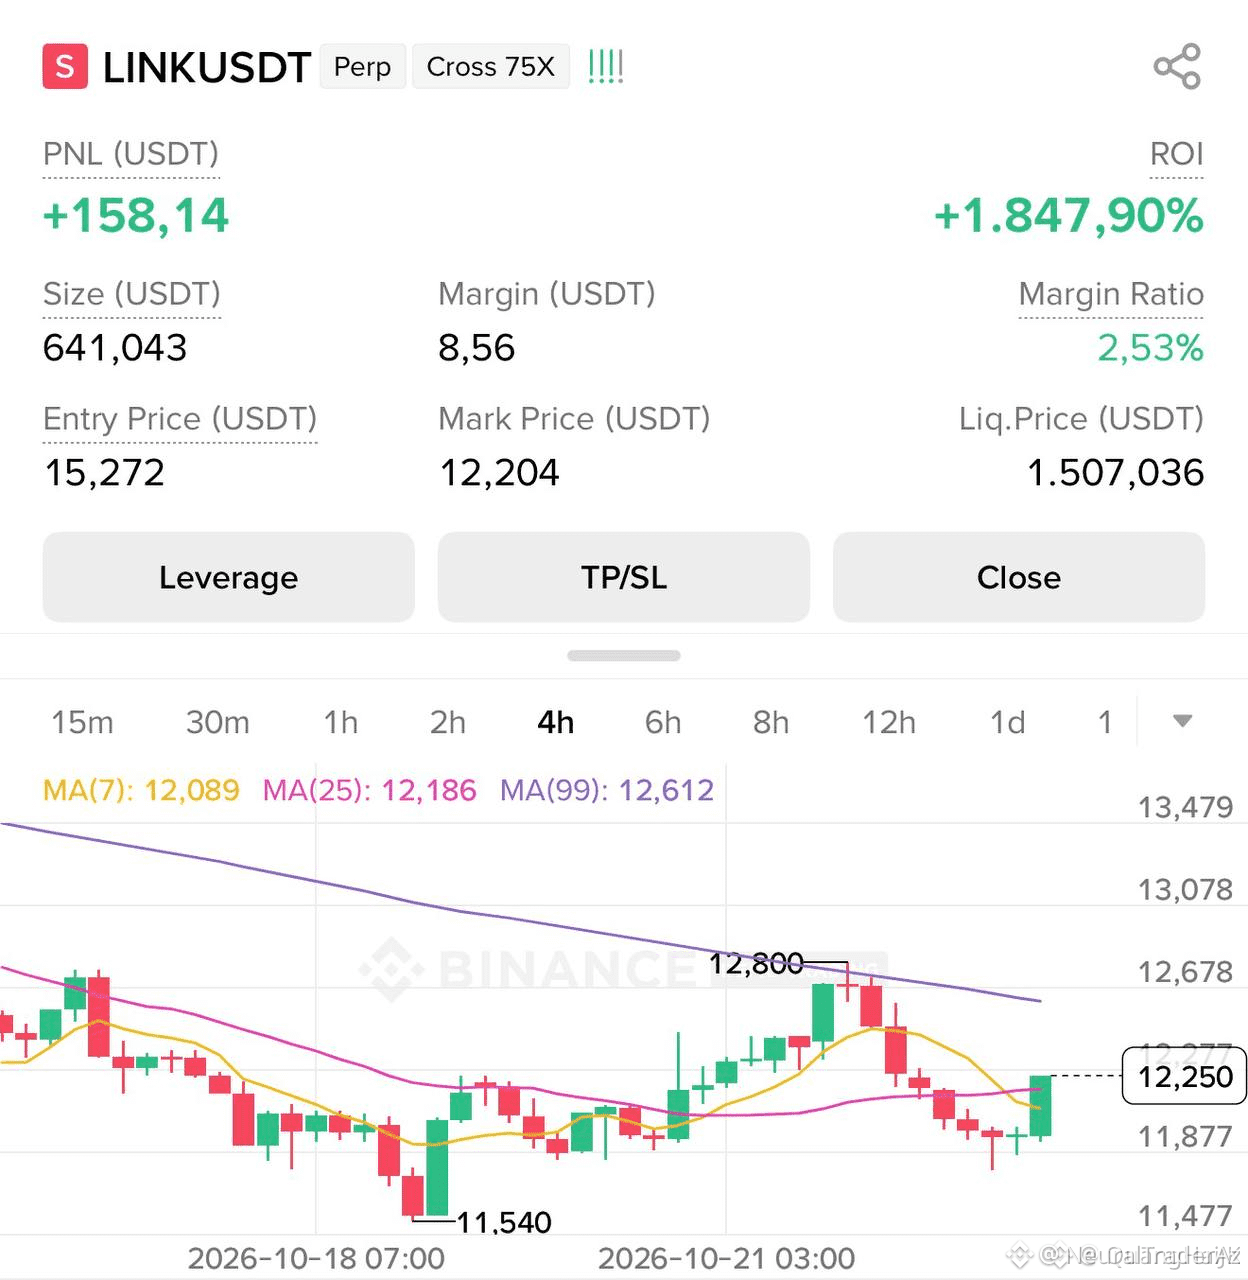
🔴 $LINK SINKS INTO OVERBOUGHT PIT – SHORT ALERT! ⚡
Entry: 12.8-14.2 ⚡
Target: 11.9 🚀
Target: 10.3 🚀
Target: 9.6 🚀
Stop Loss: 15.6 ⚠️
📊 RSI_6 exploded to 80.12 while price tore through the upper Bollinger Band at $12.19, signaling a sharp mean‑reversion pullback. 🔍 The overbought pressure aligns with a classic liquidity sweep, priming smart money to absorb sellers at the 12.8‑14.2 demand zone.
📌 The short range captures the imbalance left by aggressive buying, offering a clean 1:3+ risk‑reward profile as price targets cascade down the next support clusters. 💬 How aggressively are you sizing into this short wave? 👇
⚠️ Not financial advice. Always manage your risk. 🛡️
🏷️ #LINK #ShortSetup #Overbought #Crypto
🦈 🔥
🔴 $LINK SINKS INTO OVERBOUGHT PIT – SHORT ALERT! ⚡
Entry: 12.8-14.2 ⚡
Target: 11.9 🚀
Target: 10.3 🚀
Target: 9.6 🚀
Stop Loss: 15.6 ⚠️
📊 RSI_6 exploded to 80.12 while price tore through the upper Bollinger Band at $12.19, signaling a sharp mean‑reversion pullback. 🔍 The overbought pressure aligns with a classic liquidity sweep, priming smart money to absorb sellers at the 12.8‑14.2 demand zone.
📌 The short range captures the imbalance left by aggressive buying, offering a clean 1:3+ risk‑reward profile as price targets cascade down the next support clusters. 💬 How aggressively are you sizing into this short wave? 👇
⚠️ Not financial advice. Always manage your risk. 🛡️
🏷️ #LINK #ShortSetup #Overbought #Crypto
🦈 🔥
Entry: 12.8-14.2 ⚡
Target: 11.9 🚀
Target: 10.3 🚀
Target: 9.6 🚀
Stop Loss: 15.6 ⚠️
📊 RSI_6 exploded to 80.12 while price tore through the upper Bollinger Band at $12.19, signaling a sharp mean‑reversion pullback. 🔍 The overbought pressure aligns with a classic liquidity sweep, priming smart money to absorb sellers at the 12.8‑14.2 demand zone.
📌 The short range captures the imbalance left by aggressive buying, offering a clean 1:3+ risk‑reward profile as price targets cascade down the next support clusters. 💬 How aggressively are you sizing into this short wave? 👇
⚠️ Not financial advice. Always manage your risk. 🛡️
🏷️ #LINK #ShortSetup #Overbought #Crypto
🦈 🔥
7
·
--
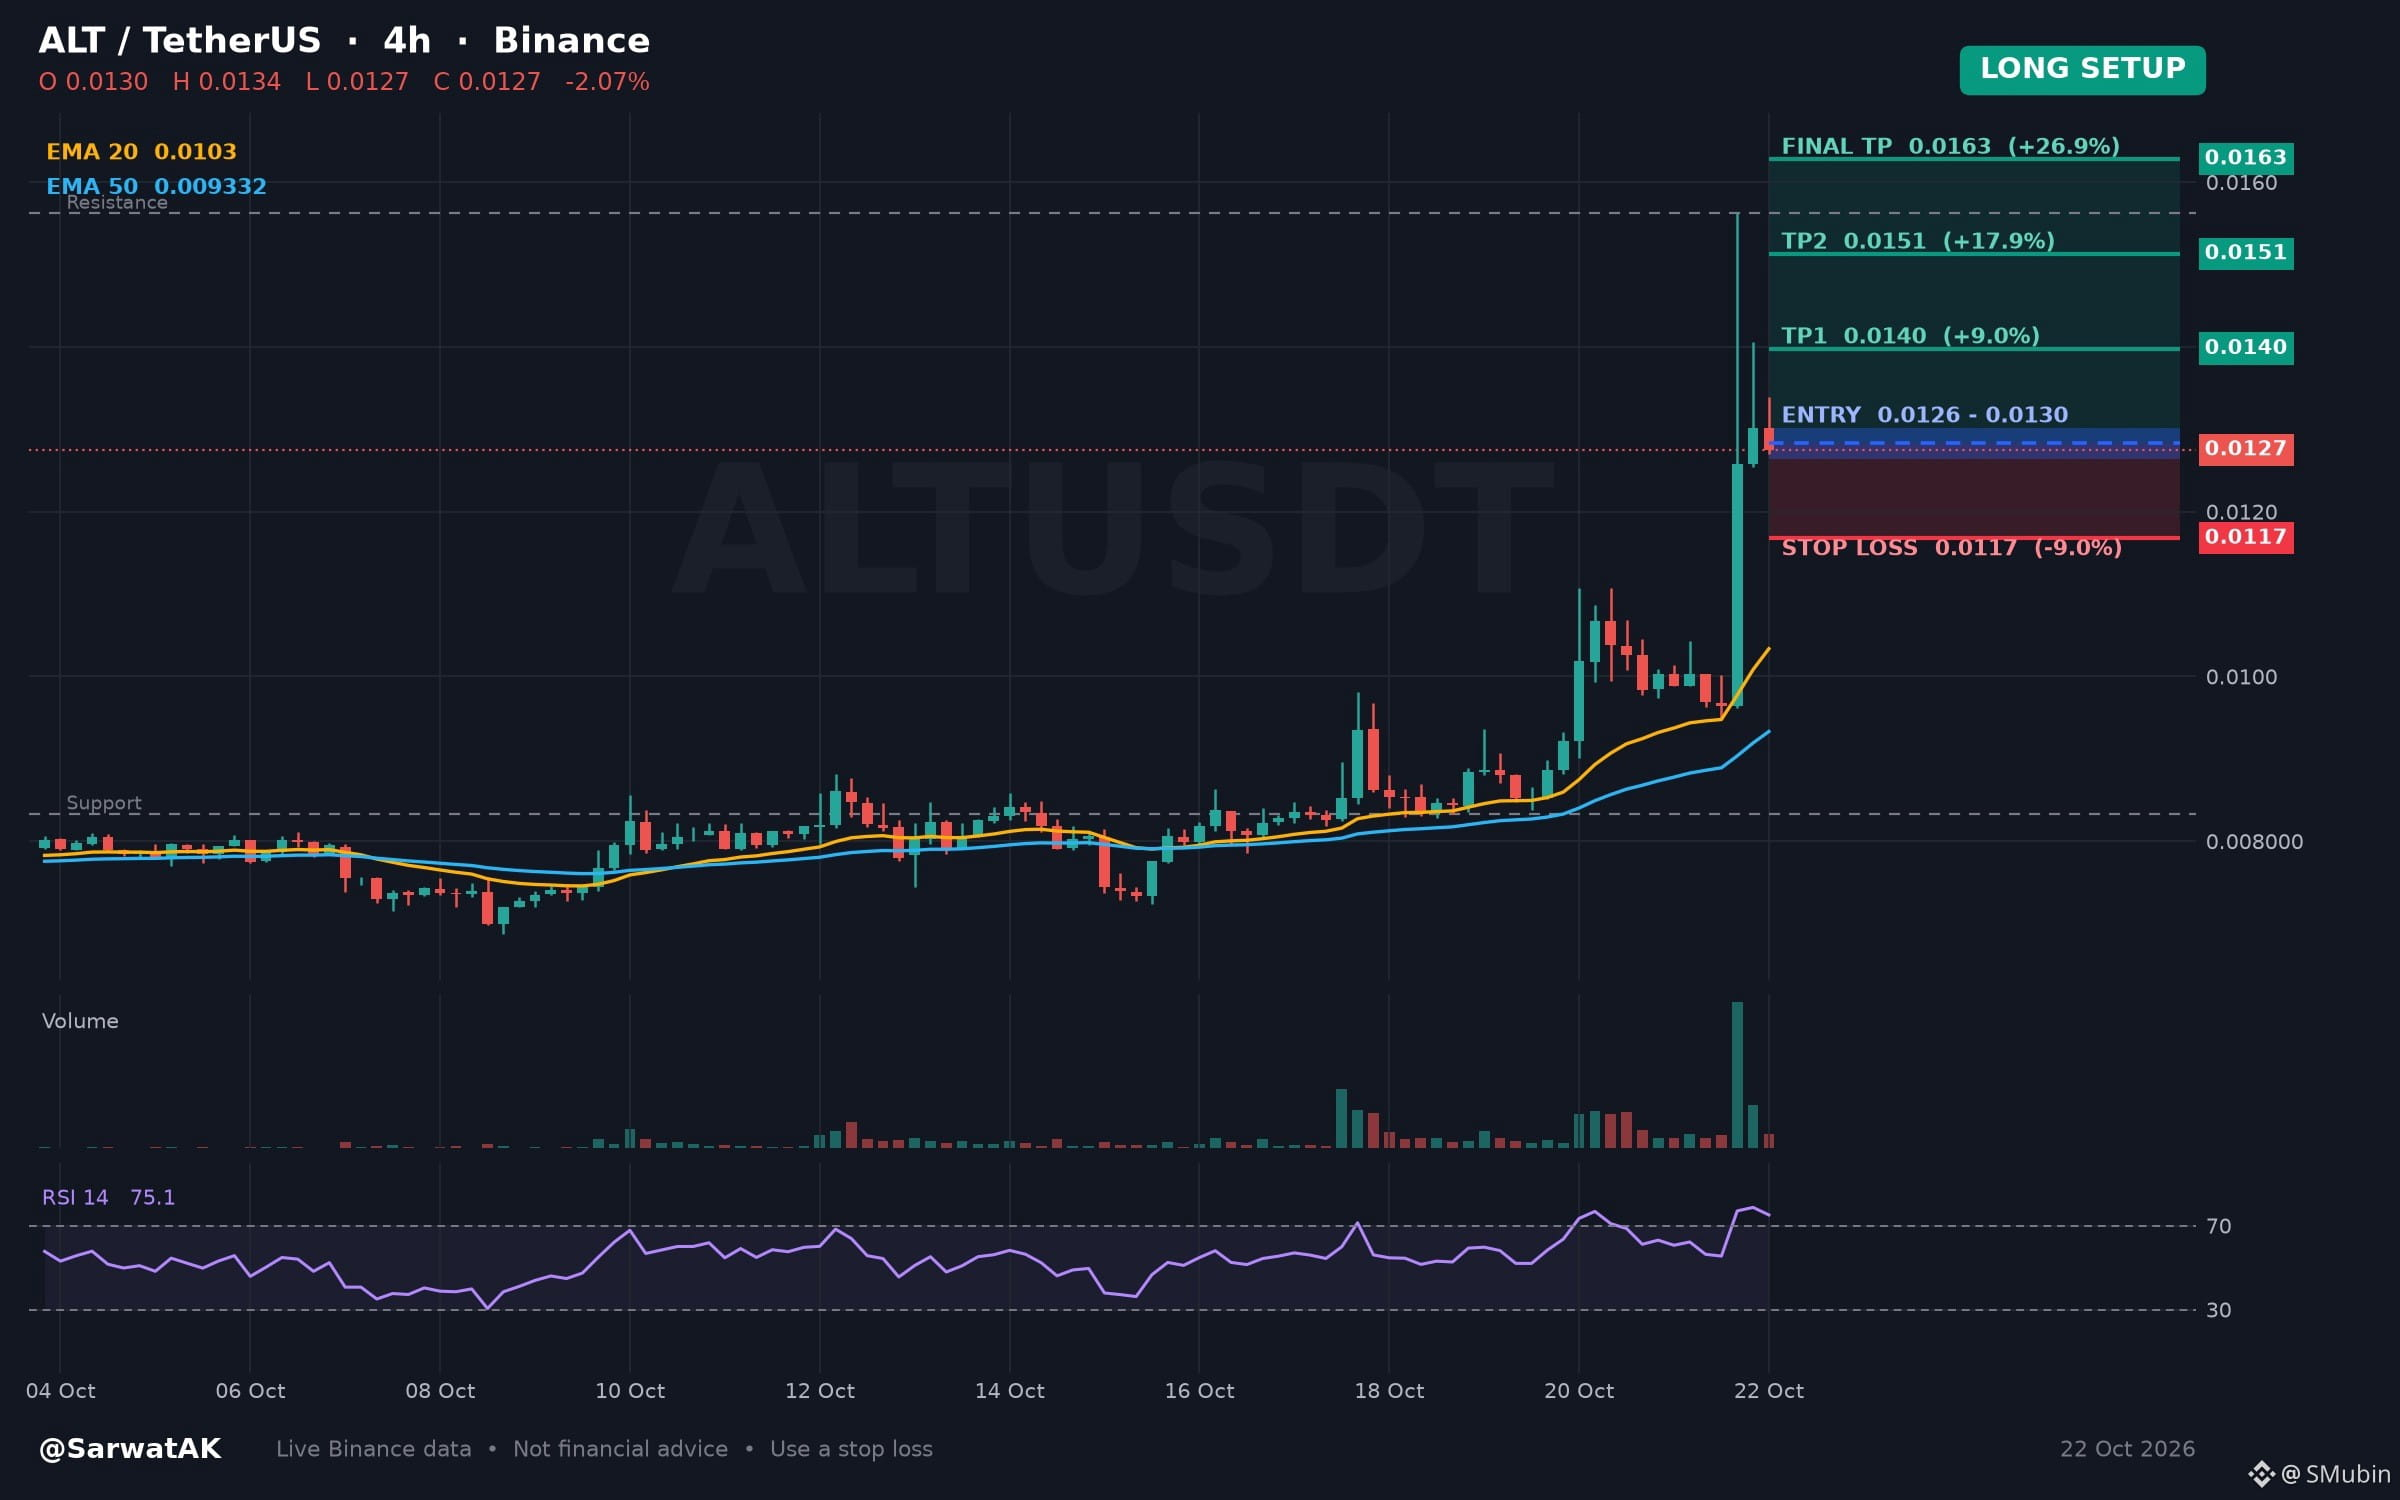
$ALT LONG SETUP ... NEXT TARGET 0.0163
Four-Hour Momentum Enters Overbought Conditions Following Recent Upward Price Movement
Entry: 0.0126 - 0.0130 (Long)
TP1: 0.0140
TP2: 0.0151
Final TP: 0.0163
SL: 0.0117
Upward price action over the past twenty-four hours has driven the four-hour relative strength index into overbought territory. Such conditions typically lead observers to monitor for momentum exhaustion or sustained consolidation.
As long as 0.0126 holds, structure stays constructive
Must use stop loss while trading
Trade $ALT
Not financial advice. Always DYOR.
Like & Follow for Daily Trade Analytics & Insider News. @SarwatAK
#ALT #Overbought #TradingSignals
$ALT LONG SETUP ... NEXT TARGET 0.0163
Four-Hour Momentum Enters Overbought Conditions Following Recent Upward Price Movement
Entry: 0.0126 - 0.0130 (Long)
TP1: 0.0140
TP2: 0.0151
Final TP: 0.0163
SL: 0.0117
Upward price action over the past twenty-four hours has driven the four-hour relative strength index into overbought territory. Such conditions typically lead observers to monitor for momentum exhaustion or sustained consolidation.
As long as 0.0126 holds, structure stays constructive
Must use stop loss while trading
Trade $ALT
Not financial advice. Always DYOR.
Like & Follow for Daily Trade Analytics & Insider News. @SarwatAK
#ALT #Overbought #TradingSignals
Four-Hour Momentum Enters Overbought Conditions Following Recent Upward Price Movement
Entry: 0.0126 - 0.0130 (Long)
TP1: 0.0140
TP2: 0.0151
Final TP: 0.0163
SL: 0.0117
Upward price action over the past twenty-four hours has driven the four-hour relative strength index into overbought territory. Such conditions typically lead observers to monitor for momentum exhaustion or sustained consolidation.
As long as 0.0126 holds, structure stays constructive
Must use stop loss while trading
Trade $ALT
Not financial advice. Always DYOR.
Like & Follow for Daily Trade Analytics & Insider News. @SarwatAK
#ALT #Overbought #TradingSignals
126
·
--
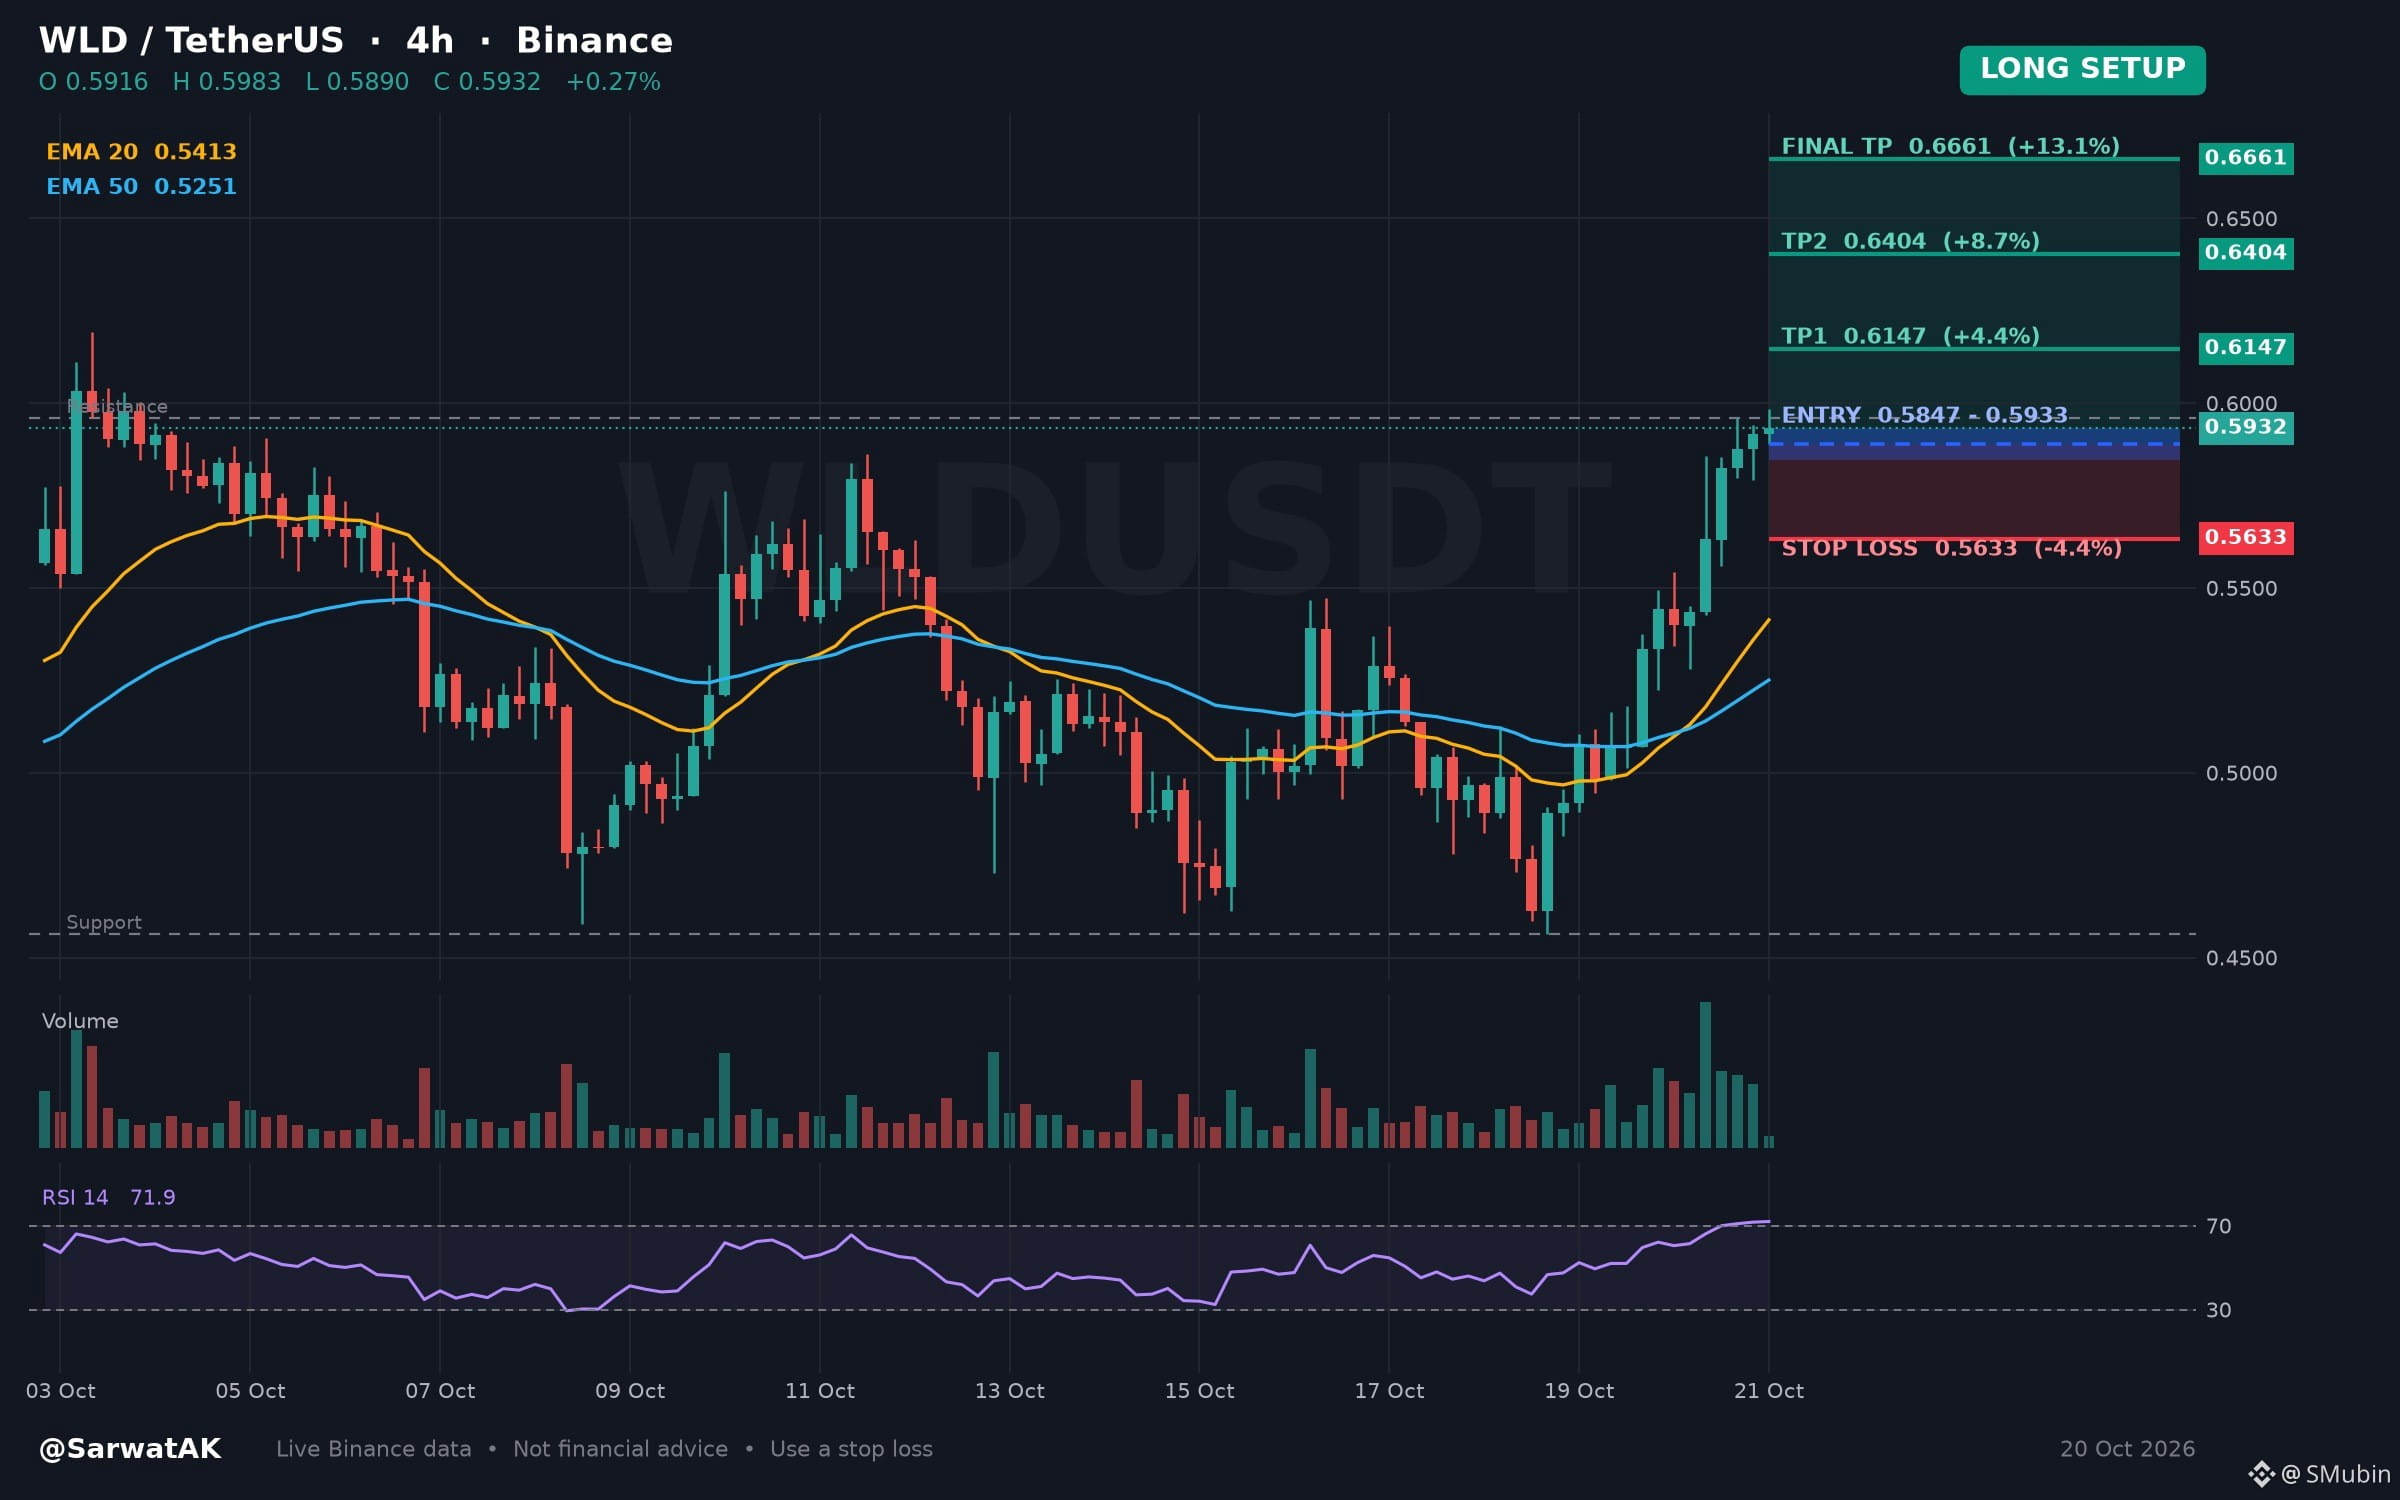
$WLD LONG SETUP ... NEXT TARGET 0.6661
Upward Twenty-Four Hour Movement Meets Overbought Four-Hour Momentum Reading
Entry: 0.5847 - 0.5933 (Long)
TP1: 0.6147
TP2: 0.6404
Final TP: 0.6661
SL: 0.5633
Price has pushed higher over the past twenty-four hours, placing the four-hour relative strength index into overbought territory. This alignment reflects persistent upward strength alongside conditions where momentum often pauses.
As long as 0.5847 holds, structure stays constructive
Must use stop loss while trading
Trade $WLD
Not financial advice. Always DYOR.
Like & Follow for Daily Trade Analytics & Insider News. @SarwatAK
#WLD #Overbought #TrendingTopic
{spot}(WLDUSDT)
$WLD LONG SETUP ... NEXT TARGET 0.6661
Upward Twenty-Four Hour Movement Meets Overbought Four-Hour Momentum Reading
Entry: 0.5847 - 0.5933 (Long)
TP1: 0.6147
TP2: 0.6404
Final TP: 0.6661
SL: 0.5633
Price has pushed higher over the past twenty-four hours, placing the four-hour relative strength index into overbought territory. This alignment reflects persistent upward strength alongside conditions where momentum often pauses.
As long as 0.5847 holds, structure stays constructive
Must use stop loss while trading
Trade $WLD
Not financial advice. Always DYOR.
Like & Follow for Daily Trade Analytics & Insider News. @SarwatAK
#WLD #Overbought #TrendingTopic
Upward Twenty-Four Hour Movement Meets Overbought Four-Hour Momentum Reading
Entry: 0.5847 - 0.5933 (Long)
TP1: 0.6147
TP2: 0.6404
Final TP: 0.6661
SL: 0.5633
Price has pushed higher over the past twenty-four hours, placing the four-hour relative strength index into overbought territory. This alignment reflects persistent upward strength alongside conditions where momentum often pauses.
As long as 0.5847 holds, structure stays constructive
Must use stop loss while trading
Trade $WLD
Not financial advice. Always DYOR.
Like & Follow for Daily Trade Analytics & Insider News. @SarwatAK
#WLD #Overbought #TrendingTopic
160

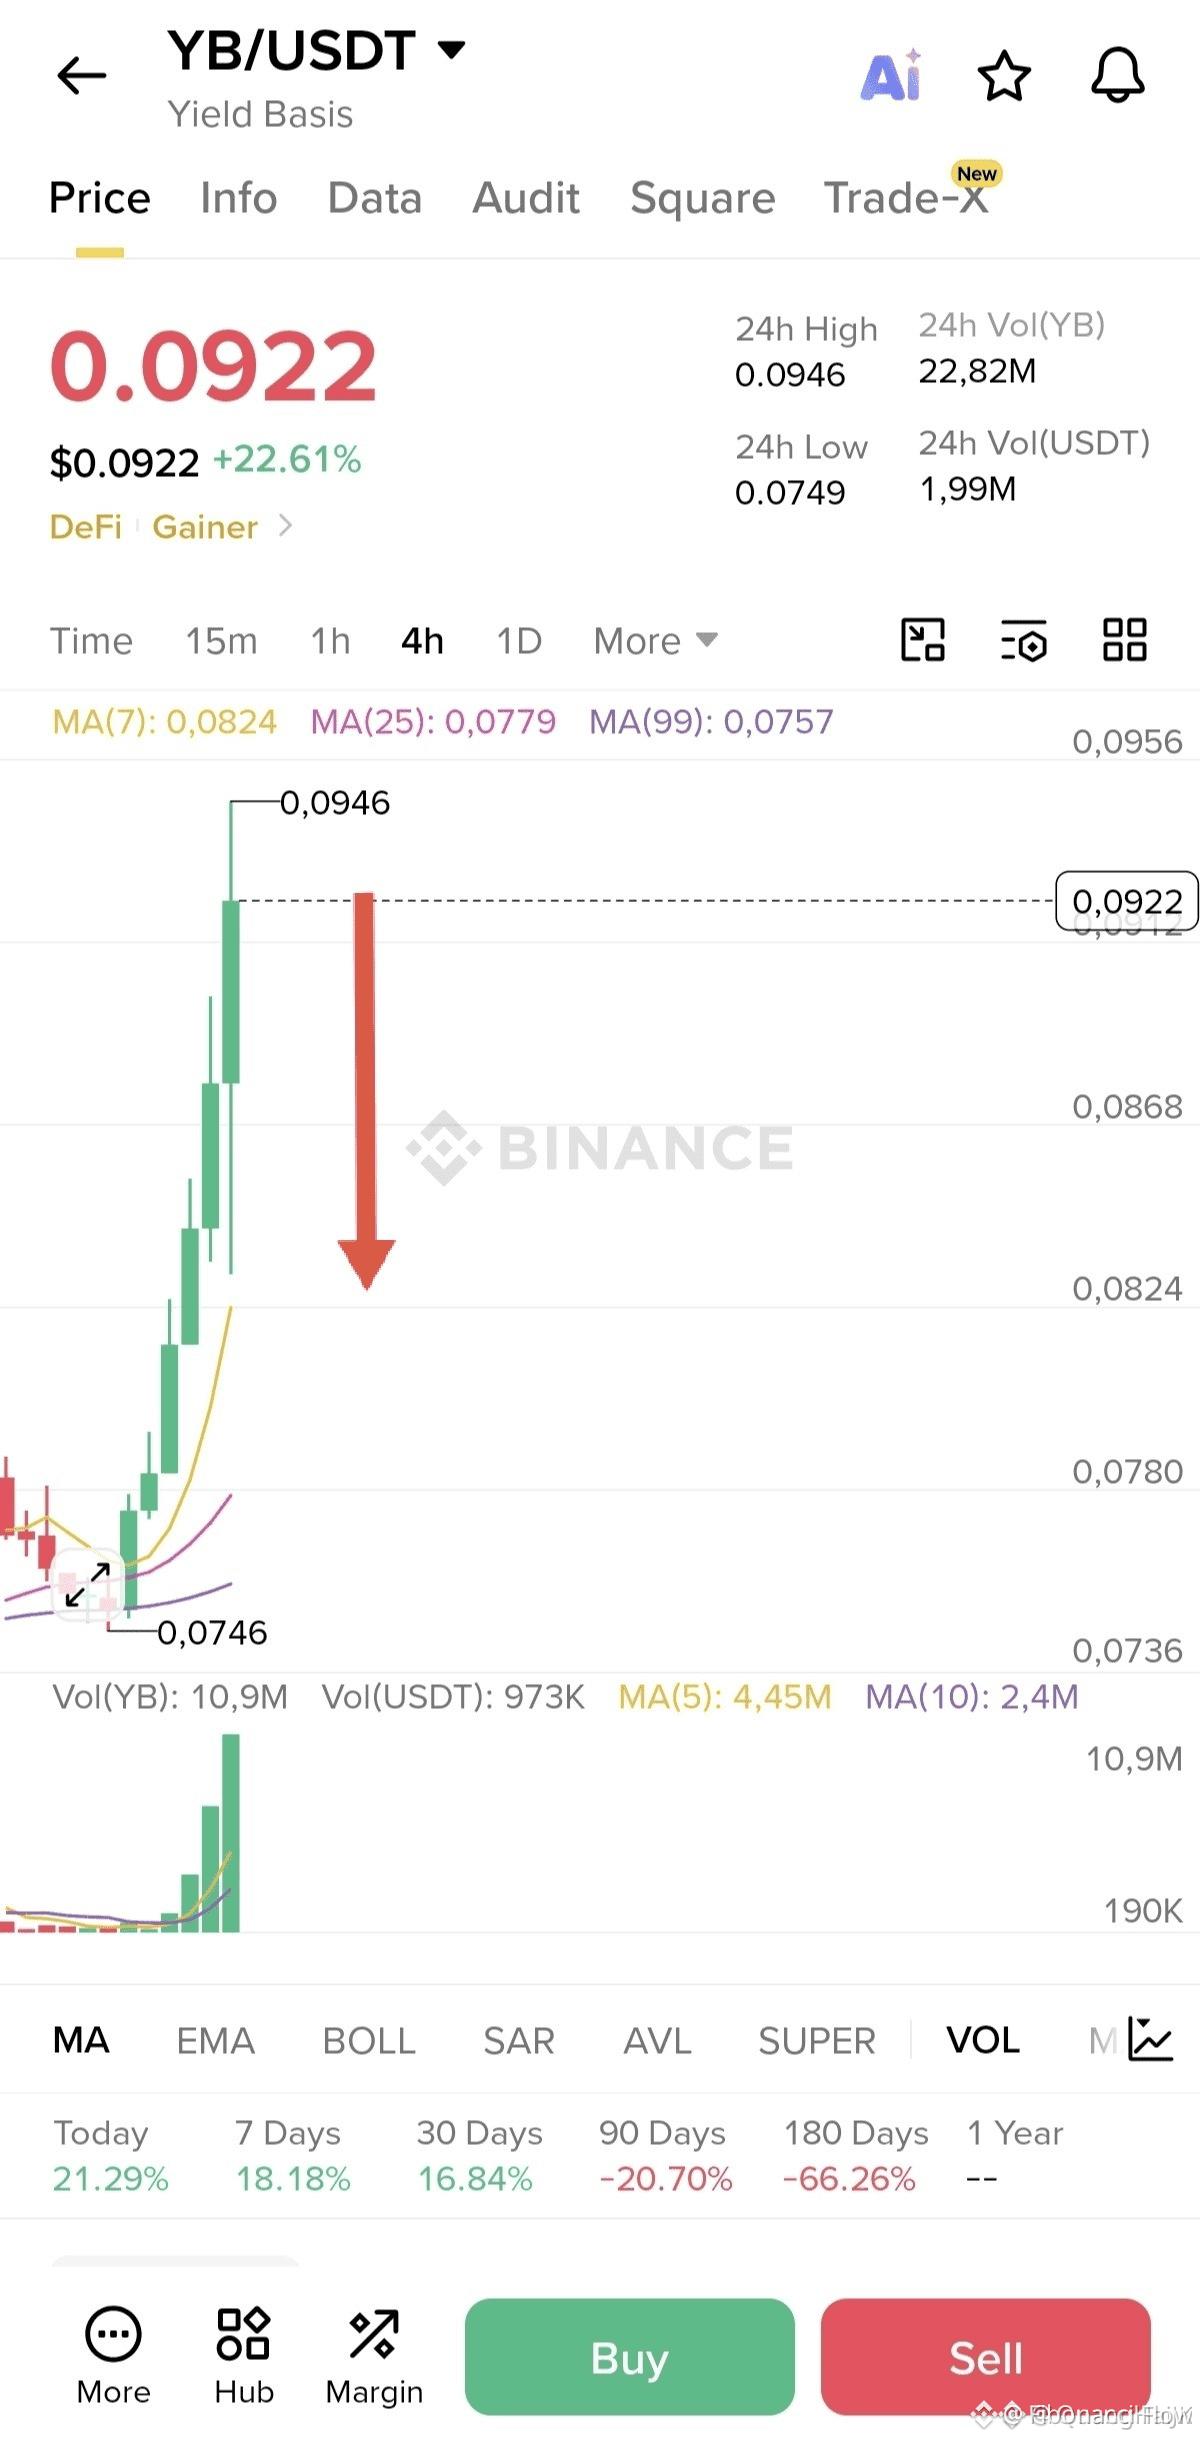
$YB IS OVERBOUGHT WITH RSI(6) ABOVE 80 – SHORT SETUP ACTIVE 🚨
Entry: 0.09698 – 0.1202 🔥
Target: 0.09056 / 0.08078 / 0.0672 🚀
Stop Loss: 0.1420 ⚠️
This is the kind of overextended move I wait for. RSI(6) spiked above 80 during the recent surge – historically that's the zone where sellers step in and the bid weakens fast. The entry range gives you room to scale in while keeping risk tight below the recent highs.
Three clear targets stacked from 0.09056 down to 0.0672. That's a potential 30% move if the correction runs. Are you shorting this pump or waiting for confirmation?
Not financial advice. Always manage your risk.
#YB #ShortSetup #Overbought #Crypto
🚨
$YB IS OVERBOUGHT WITH RSI(6) ABOVE 80 – SHORT SETUP ACTIVE 🚨
Entry: 0.09698 – 0.1202 🔥
Target: 0.09056 / 0.08078 / 0.0672 🚀
Stop Loss: 0.1420 ⚠️
This is the kind of overextended move I wait for. RSI(6) spiked above 80 during the recent surge – historically that's the zone where sellers step in and the bid weakens fast. The entry range gives you room to scale in while keeping risk tight below the recent highs.
Three clear targets stacked from 0.09056 down to 0.0672. That's a potential 30% move if the correction runs. Are you shorting this pump or waiting for confirmation?
Not financial advice. Always manage your risk.
#YB #ShortSetup #Overbought #Crypto
🚨
Entry: 0.09698 – 0.1202 🔥
Target: 0.09056 / 0.08078 / 0.0672 🚀
Stop Loss: 0.1420 ⚠️
This is the kind of overextended move I wait for. RSI(6) spiked above 80 during the recent surge – historically that's the zone where sellers step in and the bid weakens fast. The entry range gives you room to scale in while keeping risk tight below the recent highs.
Three clear targets stacked from 0.09056 down to 0.0672. That's a potential 30% move if the correction runs. Are you shorting this pump or waiting for confirmation?
Not financial advice. Always manage your risk.
#YB #ShortSetup #Overbought #Crypto
🚨
47
#Overbought & #oversold
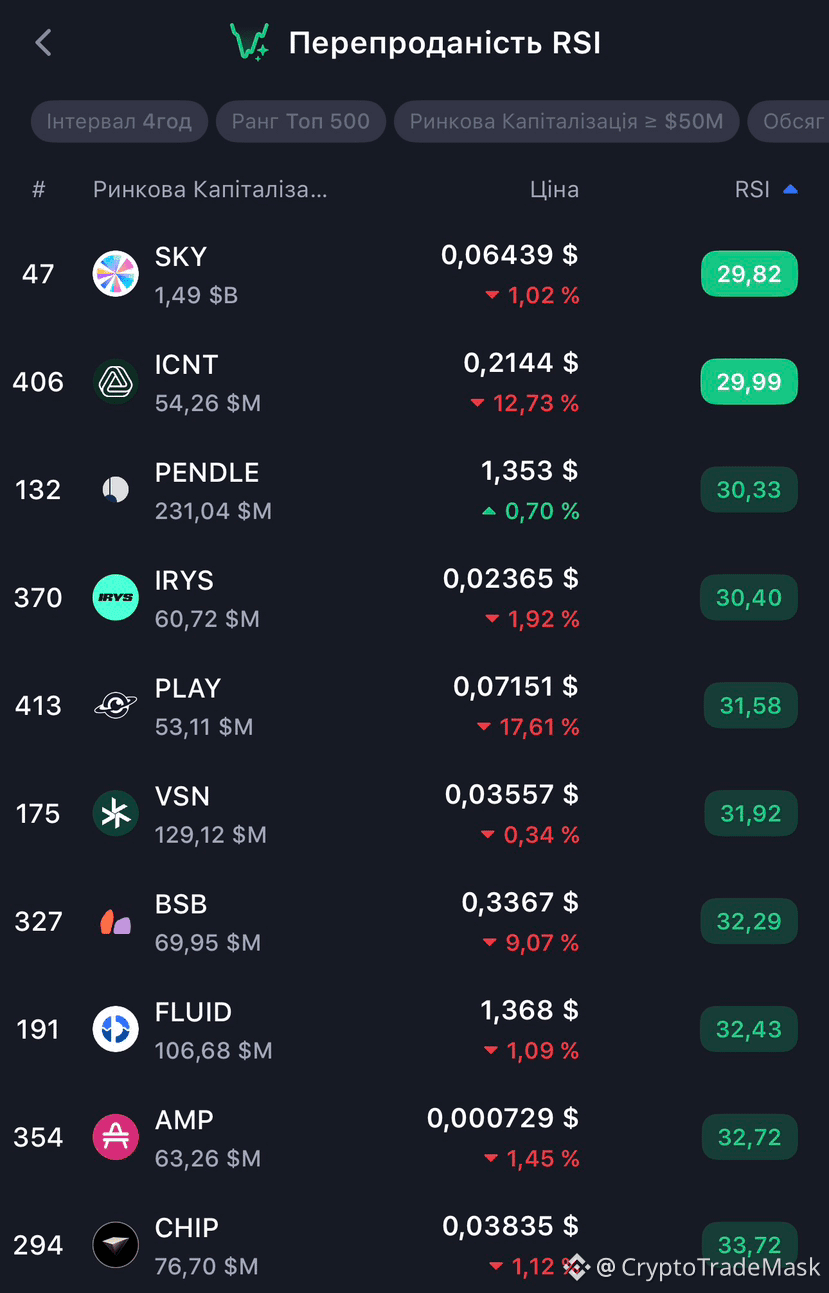
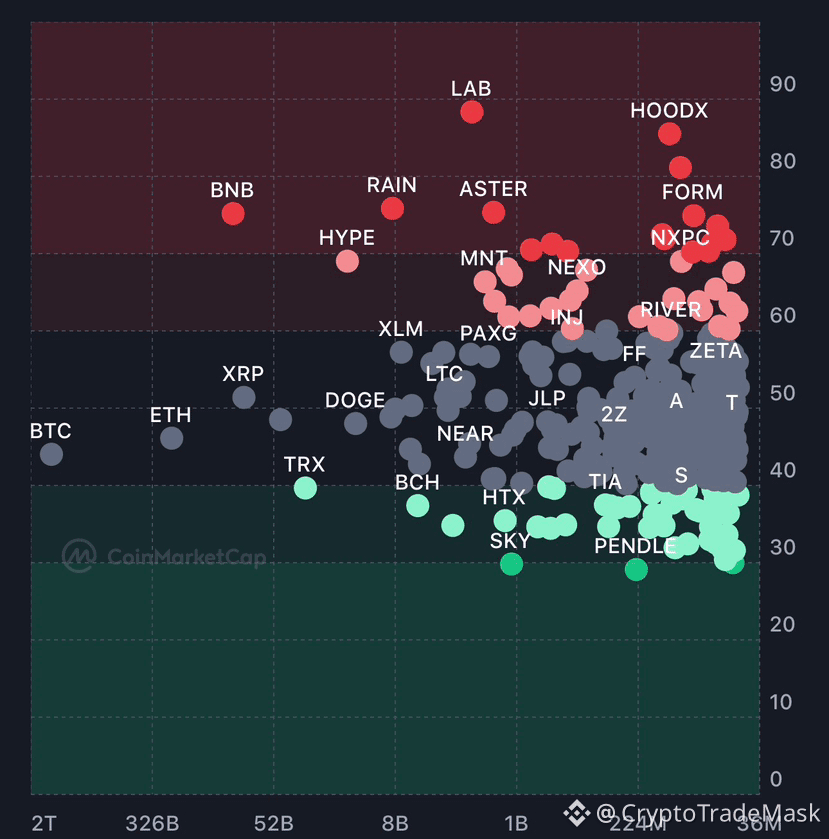
📊 Overbought & Oversold: How does it work? 📈📉
Key market zones that indicate when the price may reverse.
🟢 Oversold
• The price has fallen too low - temporarily or excessively.
• RSI < 30.
• There may be a chance of a rebound - the asset is becoming interesting to buy.
• Many coins are now in this zone: $SKY - a bottom may be forming.
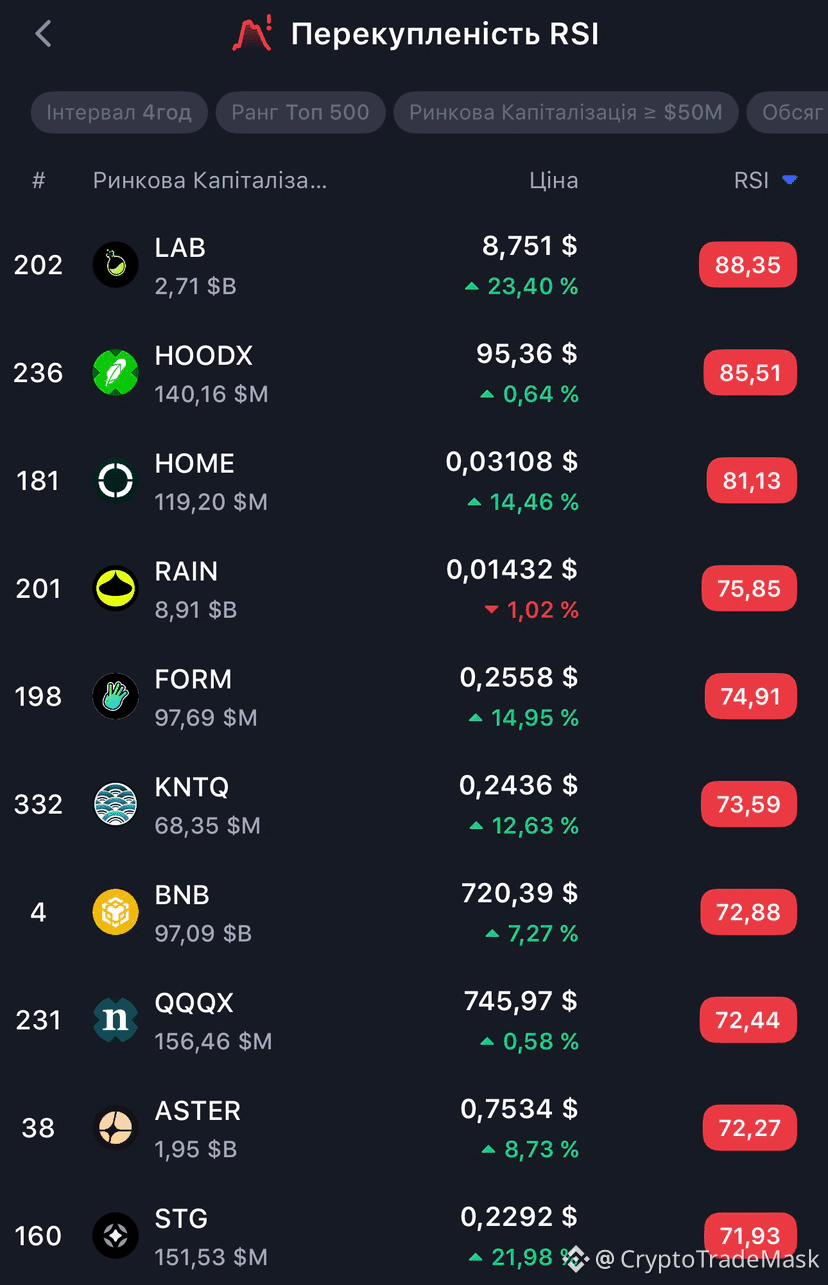
🔴 Overbought
• The price has risen too much.
• RSI > 70.
• A correction or pause after growth is likely - it's time to take profits.
• In this zone now: $LAB , $HOME - a cooling after a surge is possible.
⚠️ Rule of thumb: no indicator gives guarantees - they are only hints, not a verdict.
{future}(HOMEUSDT)
{future}(LABUSDT)
{future}(SKYUSDT)
#Overbought & #oversold
📊 Overbought & Oversold: How does it work? 📈📉
Key market zones that indicate when the price may reverse.
🟢 Oversold
• The price has fallen too low - temporarily or excessively.
• RSI < 30.
• There may be a chance of a rebound - the asset is becoming interesting to buy.
• Many coins are now in this zone: $SKY - a bottom may be forming.
🔴 Overbought
• The price has risen too much.
• RSI > 70.
• A correction or pause after growth is likely - it's time to take profits.
• In this zone now: $LAB , $HOME - a cooling after a surge is possible.
⚠️ Rule of thumb: no indicator gives guarantees - they are only hints, not a verdict.
📊 Overbought & Oversold: How does it work? 📈📉
Key market zones that indicate when the price may reverse.
🟢 Oversold
• The price has fallen too low - temporarily or excessively.
• RSI < 30.
• There may be a chance of a rebound - the asset is becoming interesting to buy.
• Many coins are now in this zone: $SKY - a bottom may be forming.
🔴 Overbought
• The price has risen too much.
• RSI > 70.
• A correction or pause after growth is likely - it's time to take profits.
• In this zone now: $LAB , $HOME - a cooling after a surge is possible.
⚠️ Rule of thumb: no indicator gives guarantees - they are only hints, not a verdict.
374

·
--
Bullish
🚨 $HEI /USDT: Extreme Overbought Alert! Correction Imminent?
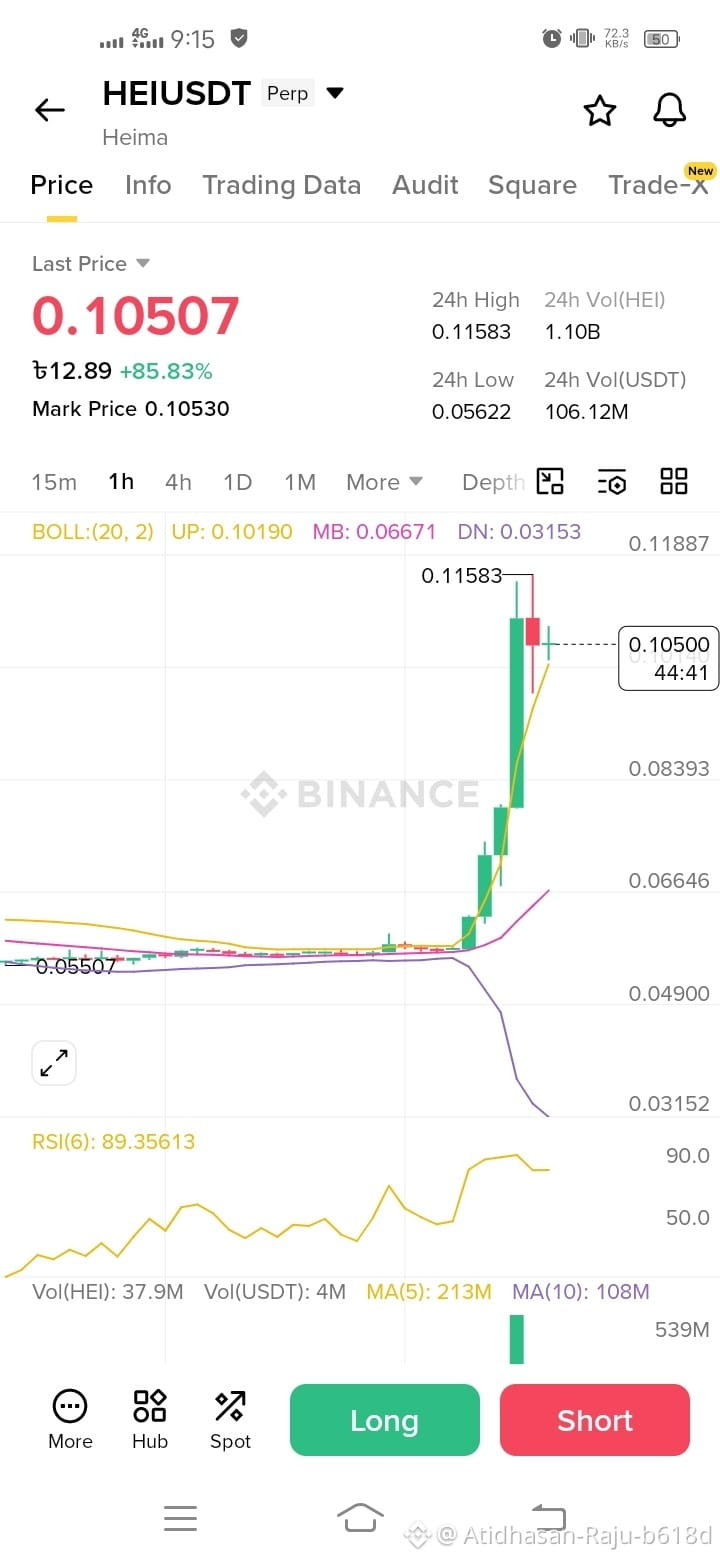
HEI has experienced an explosive parabolic move, pumping over 85% in the last 24 hours! However, looking at the 1H chart, the price has severely overextended, piercing straight through the Upper Bollinger Band (UP: 0.10190) and hitting a high of 0.11583. The RSI (6) is sitting at an extreme 89.35, which is heavily overbought. The current candle is flashing a potential exhaustion signal. A sharp technical cooling-off/correction back toward the middle band looks highly overdue here!
Direction: SHORT / SELL 🔴 (Scalp Setup)
Entry Range: 0.10500 - 0.10900Leverage: 2x - 3x (Keep it low, extremely high volatility)
Take Profit (TP):🎯 TP1: 0.09500 (Immediate local support)
🎯 TP2: 0.08300 (Key psychological level)🎯 TP3: 0.06800 (Towards Middle Bollinger Band)
Stop Loss (SL): 🛑 0.11850 (Strictly enforced above the 24h High)
👉 Is HEI ready to crash back down, or will the short squeeze push it higher? Drop your thoughts below! 👇
$HEI
{future}(HEIUSDT)
Will HEI drop below 0.09000 soon?
[Yes, dump is starting! 📉 / No, pumping to 0.15! 🚀]
#HEI #Heima #CryptoTrading #FuturesTrading #TradingSignals #BinanceSquare #TechnicalAnalysis #Overbought #CryptoShort
🚨 $HEI /USDT: Extreme Overbought Alert! Correction Imminent?
HEI has experienced an explosive parabolic move, pumping over 85% in the last 24 hours! However, looking at the 1H chart, the price has severely overextended, piercing straight through the Upper Bollinger Band (UP: 0.10190) and hitting a high of 0.11583. The RSI (6) is sitting at an extreme 89.35, which is heavily overbought. The current candle is flashing a potential exhaustion signal. A sharp technical cooling-off/correction back toward the middle band looks highly overdue here!
Direction: SHORT / SELL 🔴 (Scalp Setup)
Entry Range: 0.10500 - 0.10900Leverage: 2x - 3x (Keep it low, extremely high volatility)
Take Profit (TP):🎯 TP1: 0.09500 (Immediate local support)
🎯 TP2: 0.08300 (Key psychological level)🎯 TP3: 0.06800 (Towards Middle Bollinger Band)
Stop Loss (SL): 🛑 0.11850 (Strictly enforced above the 24h High)
👉 Is HEI ready to crash back down, or will the short squeeze push it higher? Drop your thoughts below! 👇
$HEI
Will HEI drop below 0.09000 soon?
[Yes, dump is starting! 📉 / No, pumping to 0.15! 🚀]
#HEI #Heima #CryptoTrading #FuturesTrading #TradingSignals #BinanceSquare #TechnicalAnalysis #Overbought #CryptoShort
HEI has experienced an explosive parabolic move, pumping over 85% in the last 24 hours! However, looking at the 1H chart, the price has severely overextended, piercing straight through the Upper Bollinger Band (UP: 0.10190) and hitting a high of 0.11583. The RSI (6) is sitting at an extreme 89.35, which is heavily overbought. The current candle is flashing a potential exhaustion signal. A sharp technical cooling-off/correction back toward the middle band looks highly overdue here!
Direction: SHORT / SELL 🔴 (Scalp Setup)
Entry Range: 0.10500 - 0.10900Leverage: 2x - 3x (Keep it low, extremely high volatility)
Take Profit (TP):🎯 TP1: 0.09500 (Immediate local support)
🎯 TP2: 0.08300 (Key psychological level)🎯 TP3: 0.06800 (Towards Middle Bollinger Band)
Stop Loss (SL): 🛑 0.11850 (Strictly enforced above the 24h High)
👉 Is HEI ready to crash back down, or will the short squeeze push it higher? Drop your thoughts below! 👇
$HEI
Will HEI drop below 0.09000 soon?
[Yes, dump is starting! 📉 / No, pumping to 0.15! 🚀]
#HEI #Heima #CryptoTrading #FuturesTrading #TradingSignals #BinanceSquare #TechnicalAnalysis #Overbought #CryptoShort
147

·
--
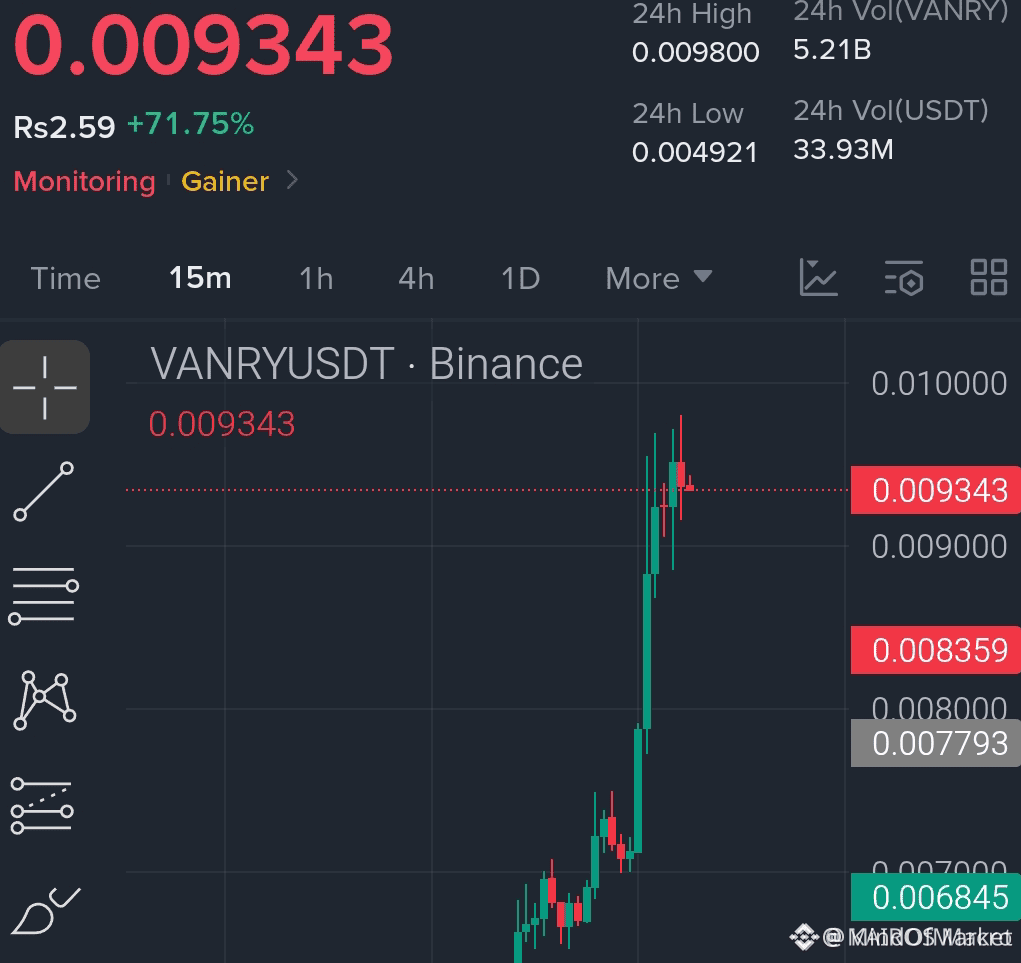
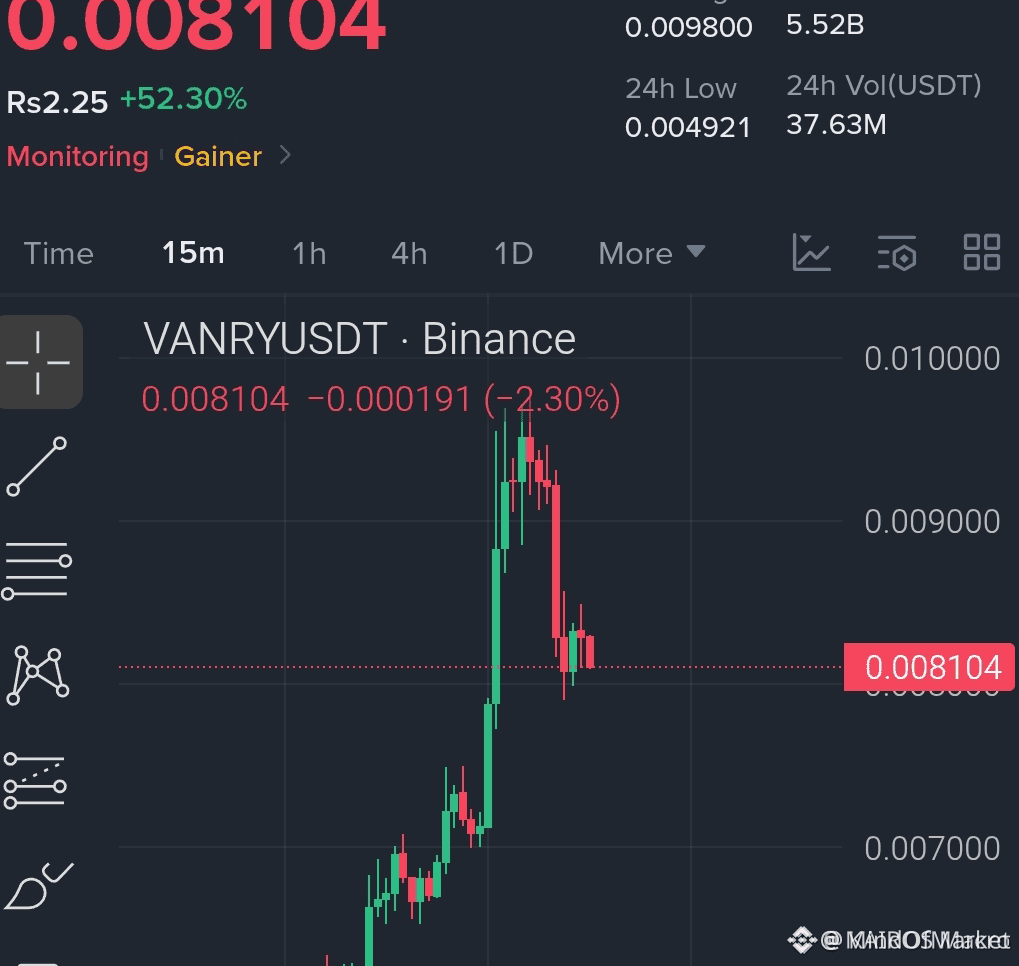
$VANRY OVERBOUGHT AND REJECTING KEY RESISTANCE – SHORT SETUP IN PLAY 🔥
Entry: 0.0081 - 0.0083 🔥
Target: 0.0077 🚀
Stop Loss: 0.0089 ⚠️
RSI on the 4H has been pinned above 80 for consecutive candles, a zone that has preceded every correction in the last three weeks. Price is now stalling at a prior order block with visible sell-side liquidity clustering above.
The structure suggests a liquidity sweep before a move lower toward the first target. Volume divergence is already showing on shorter timeframes. Are you shorting this rejection or waiting for a retest of resistance?
Not financial advice. Always manage your risk.
#VANRY #ShortSetup #Overbought #Crypto
🔥
$VANRY OVERBOUGHT AND REJECTING KEY RESISTANCE – SHORT SETUP IN PLAY 🔥
Entry: 0.0081 - 0.0083 🔥
Target: 0.0077 🚀
Stop Loss: 0.0089 ⚠️
RSI on the 4H has been pinned above 80 for consecutive candles, a zone that has preceded every correction in the last three weeks. Price is now stalling at a prior order block with visible sell-side liquidity clustering above.
The structure suggests a liquidity sweep before a move lower toward the first target. Volume divergence is already showing on shorter timeframes. Are you shorting this rejection or waiting for a retest of resistance?
Not financial advice. Always manage your risk.
#VANRY #ShortSetup #Overbought #Crypto
🔥
Entry: 0.0081 - 0.0083 🔥
Target: 0.0077 🚀
Stop Loss: 0.0089 ⚠️
RSI on the 4H has been pinned above 80 for consecutive candles, a zone that has preceded every correction in the last three weeks. Price is now stalling at a prior order block with visible sell-side liquidity clustering above.
The structure suggests a liquidity sweep before a move lower toward the first target. Volume divergence is already showing on shorter timeframes. Are you shorting this rejection or waiting for a retest of resistance?
Not financial advice. Always manage your risk.
#VANRY #ShortSetup #Overbought #Crypto
🔥
118
Log in to explore more content
Join global crypto users on Binance Square
⚡️ Get latest and useful information about crypto.
💬 Trusted by the world’s largest crypto exchange.
👍 Discover real insights from verified creators.
Email / Phone number
Trending Topics
1
#CanBTCReboundAfterFallingBelow60K?
0 views
411 Discussing
2
#GlobalStocksFaceLongestLosingStreakSince2023
0 views
444 Discussing
3
#AnthropicPlungesTowardIPOPriceonDay2
0 views
151 Discussing
4
#GaoTengBitcoinETFListsOnHKEX
0 views
355 Discussing
5
#TradFiForBeginners
946,825 views
5,749 Discussing
6
#NvidiaBoardReportedlySplitOverHuang’sReturn
258,674 views
2,543 Discussing
7
#TetherBurns8BillionUSDTInPast20Days
0 views
145 Discussing
8
#BitcoinWalletSignatureFlawExploitableWithinSeconds
0 views
69 Discussing
9
#CanGTA6'sLaunchLiftTTWOShares?
207,868 views
1,788 Discussing
10
#HongKongProposesSFCLicensingForFourVirtualAssetServices
404 views
35 Discussing