

#nasdaq
nasdaq
2.1M views
5,377 Discussing
Hot
Latest

Today marks a new chapter for $BNC .🎗️
BNB Standard Corp CEO Alex Odagiu stood at the Nasdaq podium ahead of the Opening Bell, joined by Changpeng Zhao. The ceremony highlights the company’s rebrand and its push as a major corporate $BNB treasury vehicle tied to the BNB Chain ecosystem.
{spot}(BNCBUSDT)
{spot}(BNBUSDT)
A public-market moment that puts BNB infrastructure further into institutional view.
#BNC #BNB #BNBChain #Nasdaq #CoinVahini
Today marks a new chapter for $BNC .🎗️
BNB Standard Corp CEO Alex Odagiu stood at the Nasdaq podium ahead of the Opening Bell, joined by Changpeng Zhao. The ceremony highlights the company’s rebrand and its push as a major corporate $BNB treasury vehicle tied to the BNB Chain ecosystem.
A public-market moment that puts BNB infrastructure further into institutional view.
#BNC #BNB #BNBChain #Nasdaq #CoinVahini

6

·
--
🚀 $BNB MAKES NASDAQ DEBUT, CRYPTO‑FINANCE MERGE IN ACTION! 🟢
📊 CZ ringing the Nasdaq opening bell turned a nine‑year‑old exchange token into a listed reserve asset, and the market felt the tremor instantly. The BNB Standard narrative now rides a trad‑fi showcase, handing institutional wallets a direct line to the Binance ecosystem. 🦈
Liquidity hunters are already eyeing the fresh inflow as smart‑money whales prep to stack BNB on the new doorway, while the chain’s utility engine keeps humming. 🌊💡 This convergence accelerates the crypto‑tradfi bridge, and the next wave could rewrite how investors allocate capital. 💬 How do you see BNB’s role evolving in the coming months? 👇
⚠️ Not financial advice. Always manage your risk. 🛡️
🏷️ #BNB #Nasdaq #CryptoFinance #Bullish
🚀 🦈
15


Article
CZ Rings the Nasdaq Bell: BNB Steps Onto Wall Street's Biggest Stage 🔔Nine years ago, $BNB started as a simple exchange token.
Today, Binance founder @CZ stood at the Nasdaq podium for the Opening Bell, next to the CEO of $BNC, a BNB treasury company.
In his own words: "When BNB started 9 years ago, I never thought I would be ringing the bell for a blockchain token (treasury) on NASDAQ one day. I don't know what shows crypto and tradfi converging more than this."
Why this moment
🏛️ Crypto meets TradFi. A company built around holding BNB is being celebrated on one of the world's biggest stock exchanges. A few years ago that would have sounded impossible.
📈 A new door for investors. Treasury companies give traditional stock market investors a way to get exposure to a crypto asset through a listed company.
💛 The "BNB Standard." CZ tagged the post #BNB Standard, which signals a vision of BNB as a serious reserve asset and not just a utility token.
The community reacted fast
CZ's post passed 100K views within hours, with hundreds of replies. The BNB Chain team called it "the beginning."
My take
As a creator who has watched this space grow, this is the kind of headline that changes how outsiders see crypto. From a token on a single exchange to the Nasdaq stage in under a decade, the line between "crypto" and "finance" is getting thinner every year.
The question now isn't if crypto and TradFi will merge. It's how fast. 🚀
#NASDAQ #CryptoManMab
CZ Rings the Nasdaq Bell: BNB Steps Onto Wall Street's Biggest Stage 🔔
Nine years ago, $BNB started as a simple exchange token.
Today, Binance founder @CZ stood at the Nasdaq podium for the Opening Bell, next to the CEO of $BNC, a BNB treasury company.
In his own words: "When BNB started 9 years ago, I never thought I would be ringing the bell for a blockchain token (treasury) on NASDAQ one day. I don't know what shows crypto and tradfi converging more than this."
Why this moment
🏛️ Crypto meets TradFi. A company built around holding BNB is being celebrated on one of the world's biggest stock exchanges. A few years ago that would have sounded impossible.
📈 A new door for investors. Treasury companies give traditional stock market investors a way to get exposure to a crypto asset through a listed company.
💛 The "BNB Standard." CZ tagged the post #BNB Standard, which signals a vision of BNB as a serious reserve asset and not just a utility token.
The community reacted fast
CZ's post passed 100K views within hours, with hundreds of replies. The BNB Chain team called it "the beginning."
My take
As a creator who has watched this space grow, this is the kind of headline that changes how outsiders see crypto. From a token on a single exchange to the Nasdaq stage in under a decade, the line between "crypto" and "finance" is getting thinner every year.
The question now isn't if crypto and TradFi will merge. It's how fast. 🚀
#NASDAQ #CryptoManMab
3
243

·
--
Bullish
🔔 BNB and Nasdaq: what’s behind the headline?
October 26 marks BNB Standard’s Nasdaq opening bell ceremony. But “BNB just listed on Nasdaq” is misleading.
The company’s shares already trade under the ticker $BNCB . Formerly CEA Industries, it is celebrating its new name and the appointment of Alex Odagiu as CEO not a new token listing.
What matters beyond the headline?
▪️ The company reported holding 515,544 BNB as of July 31, 2026, describing it as the world’s largest corporate BNB treasury.
▪️ It plans to operate a BNB Chain validator and build businesses within the ecosystem. These remain plans, not proven earnings streams.
▪️ BNC shares offer indirect exposure to BNB through a public company. Owning shares also brings corporate costs, liabilities and dilution risk.
My take: this gives BNB greater visibility in traditional finance. But ringing the Nasdaq bell does not automatically create demand for the token.
Watch what comes next: actual BNB purchases, BNB holdings per share, and the validator’s operating results. Those will tell us whether the attention translates into economic value.
Don’t forget to [Vote here](https://www.binance.com/en/square/blockchain-100-2026?username=772)
#BNB #NASDAQ $BNB
{spot}(BNBUSDT)
🔔 BNB and Nasdaq: what’s behind the headline?
October 26 marks BNB Standard’s Nasdaq opening bell ceremony. But “BNB just listed on Nasdaq” is misleading.
The company’s shares already trade under the ticker $BNCB . Formerly CEA Industries, it is celebrating its new name and the appointment of Alex Odagiu as CEO not a new token listing.
What matters beyond the headline?
▪️ The company reported holding 515,544 BNB as of July 31, 2026, describing it as the world’s largest corporate BNB treasury.
▪️ It plans to operate a BNB Chain validator and build businesses within the ecosystem. These remain plans, not proven earnings streams.
▪️ BNC shares offer indirect exposure to BNB through a public company. Owning shares also brings corporate costs, liabilities and dilution risk.
My take: this gives BNB greater visibility in traditional finance. But ringing the Nasdaq bell does not automatically create demand for the token.
Watch what comes next: actual BNB purchases, BNB holdings per share, and the validator’s operating results. Those will tell us whether the attention translates into economic value.
Don’t forget to Vote here
#BNB #NASDAQ $BNB
140

Verified
Article
NASDAQ 100 (NAS100) PRICE ANALYSIS: Bears Take Control After October High — Key Levels Every Trader◆━━━━━━━━━━━━━━━━━━━━━━◆
The Nasdaq-100 just delivered one of its sharpest reality checks of 2026.
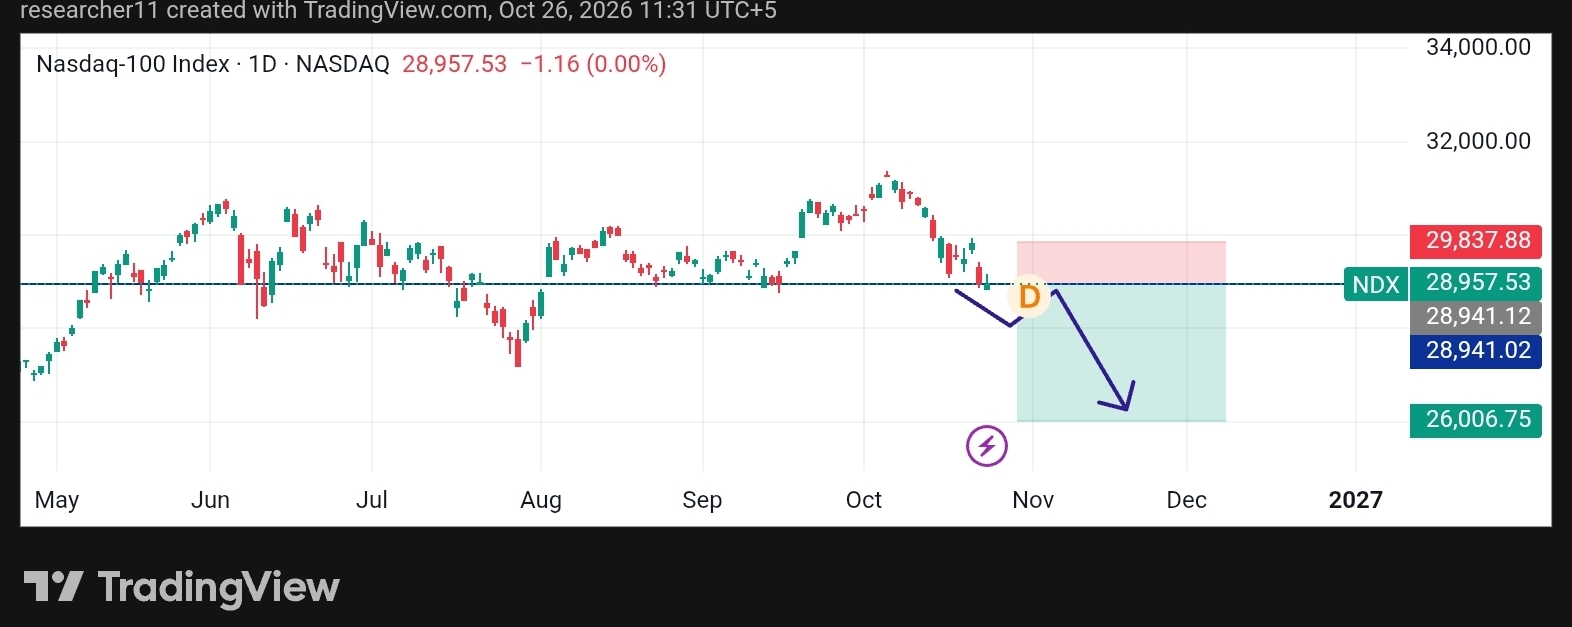
After printing a fresh all-time high near 31,361–31,365 in early October, the tech-heavy index has slid hard. As of the latest session (Oct 26, 2026), NDX/NAS100 is hovering around 28,957, almost unchanged on the day but down roughly 7–8% from the peak and sitting below critical moving averages.
The chart tells a clear story: a breakdown below the 50-day and 100-day SMAs, a slip under the 23.6% Fibonacci level near 29,035, and growing selling pressure. Momentum has shifted from the strong bullish structure seen earlier in the month.
◆━━━━━━━━━━━━━━━━━━━━━━◆
What’s Driving the Sell-Off?
➤ AI infrastructure spending concerns and semiconductor weakness have weighed heavily on the “Magnificent” names and chip stocks.
➤ Broader risk-off sentiment, higher yields in some regions, and questions about the sustainability of massive AI capex are cooling the previous euphoria.
➤ Technical structure has deteriorated — price is now testing the 61.8% Fib zone and key support clusters around 28,800–28,950.
◆━━━━━━━━━━━━━━━━━━━━━━◆
Key Technical Levels (Daily Timeframe)
① Resistance Zones
◆ 29,160–29,210 (recent swing + confluence)
◆ 29,600–29,800 (first major recovery hurdle)
◆ 30,175 (38.2% Fib extension)
② Support Zones
◆ 28,830–28,950 (current battle zone / 61.8% Fib)
◆ 28,500 (immediate downside target)
◆ 28,000 area (near 200-day SMA) → then July lows near 27,200
◆━━━━━━━━━━━━━━━━━━━━━━◆
Bias on the short-term charts leans bearish with high confidence among several technical models. A daily close back above the 50-day SMA and the 29,600–29,800 zone would be needed to neutralize the pressure. Failure to hold 28,800–28,850 opens the door to deeper correction.
◆━━━━━━━━━━━━━━━━━━━━━━◆
Longer-Term Context
Despite the current pullback, the bigger picture remains constructive for many analysts. The index is still well above major long-term averages and has delivered solid year-to-date gains. Medium- to long-term targets in some forecasts still point higher (toward the 33,000–35,000 region) if earnings from the AI leaders stabilize and macro conditions improve.
Tokenized versions tracking the Nasdaq-100 (such as QQQX on crypto platforms) have mirrored this equity weakness, showing the tight correlation between traditional tech indices and on-chain products that reference them.
◆━━━━━━━━━━━━━━━━━━━━━━◆
Trading Takeaways
✔︎ Short-term: Respect the bearish structure. Rallies into 29,200–29,600 are likely to face selling until proven otherwise.
✔︎ Watch volume and reaction at 28,800–28,850 closely — this is the make-or-break zone for the next leg.
✔︎ Broader catalysts ahead: remaining mega-cap earnings, Fed signals, and any fresh AI spending commentary will decide whether this is a healthy correction or the start of something deeper.
◆━━━━━━━━━━━━━━━━━━━━━━◆
The Nasdaq-100 is no longer in “easy mode.” The October high looks like a classic bull trap for now, and traders need to stay disciplined with risk.
◆━━━━━━━━━━━━━━━━━━━━━━◆
What Do You Think?
Is this just a healthy reset before the next leg higher, or are we heading toward a deeper tech correction into year-end?
Drop your bias, key level, or chart idea in the comments.
Like + Share if this breakdown helped you navigate the current tape.
Trade safe and manage risk. See you on the next update.
#BinancePick #EarningsSeason #NASDAQ #NAS100 #SouthKoreaDelaysCryptoIncomeTax $NVDAB
$AAPLB
{spot}(AAPLBUSDT)
$MSFTB
{spot}(MSFTBUSDT)
NASDAQ 100 (NAS100) PRICE ANALYSIS: Bears Take Control After October High — Key Levels Every Trader
◆━━━━━━━━━━━━━━━━━━━━━━◆
The Nasdaq-100 just delivered one of its sharpest reality checks of 2026.
After printing a fresh all-time high near 31,361–31,365 in early October, the tech-heavy index has slid hard. As of the latest session (Oct 26, 2026), NDX/NAS100 is hovering around 28,957, almost unchanged on the day but down roughly 7–8% from the peak and sitting below critical moving averages.
The chart tells a clear story: a breakdown below the 50-day and 100-day SMAs, a slip under the 23.6% Fibonacci level near 29,035, and growing selling pressure. Momentum has shifted from the strong bullish structure seen earlier in the month.
◆━━━━━━━━━━━━━━━━━━━━━━◆
What’s Driving the Sell-Off?
➤ AI infrastructure spending concerns and semiconductor weakness have weighed heavily on the “Magnificent” names and chip stocks.
➤ Broader risk-off sentiment, higher yields in some regions, and questions about the sustainability of massive AI capex are cooling the previous euphoria.
➤ Technical structure has deteriorated — price is now testing the 61.8% Fib zone and key support clusters around 28,800–28,950.
◆━━━━━━━━━━━━━━━━━━━━━━◆
Key Technical Levels (Daily Timeframe)
① Resistance Zones
◆ 29,160–29,210 (recent swing + confluence)
◆ 29,600–29,800 (first major recovery hurdle)
◆ 30,175 (38.2% Fib extension)
② Support Zones
◆ 28,830–28,950 (current battle zone / 61.8% Fib)
◆ 28,500 (immediate downside target)
◆ 28,000 area (near 200-day SMA) → then July lows near 27,200
◆━━━━━━━━━━━━━━━━━━━━━━◆
Bias on the short-term charts leans bearish with high confidence among several technical models. A daily close back above the 50-day SMA and the 29,600–29,800 zone would be needed to neutralize the pressure. Failure to hold 28,800–28,850 opens the door to deeper correction.
◆━━━━━━━━━━━━━━━━━━━━━━◆
Longer-Term Context
Despite the current pullback, the bigger picture remains constructive for many analysts. The index is still well above major long-term averages and has delivered solid year-to-date gains. Medium- to long-term targets in some forecasts still point higher (toward the 33,000–35,000 region) if earnings from the AI leaders stabilize and macro conditions improve.
Tokenized versions tracking the Nasdaq-100 (such as QQQX on crypto platforms) have mirrored this equity weakness, showing the tight correlation between traditional tech indices and on-chain products that reference them.
◆━━━━━━━━━━━━━━━━━━━━━━◆
Trading Takeaways
✔︎ Short-term: Respect the bearish structure. Rallies into 29,200–29,600 are likely to face selling until proven otherwise.
✔︎ Watch volume and reaction at 28,800–28,850 closely — this is the make-or-break zone for the next leg.
✔︎ Broader catalysts ahead: remaining mega-cap earnings, Fed signals, and any fresh AI spending commentary will decide whether this is a healthy correction or the start of something deeper.
◆━━━━━━━━━━━━━━━━━━━━━━◆
The Nasdaq-100 is no longer in “easy mode.” The October high looks like a classic bull trap for now, and traders need to stay disciplined with risk.
◆━━━━━━━━━━━━━━━━━━━━━━◆
What Do You Think?
Is this just a healthy reset before the next leg higher, or are we heading toward a deeper tech correction into year-end?
Drop your bias, key level, or chart idea in the comments.
Like + Share if this breakdown helped you navigate the current tape.
Trade safe and manage risk. See you on the next update.
#BinancePick #EarningsSeason #NASDAQ #NAS100 #SouthKoreaDelaysCryptoIncomeTax $NVDAB
$AAPLB
$MSFTB
3
91

·
--
🔥 NASDAQ SELL Signal
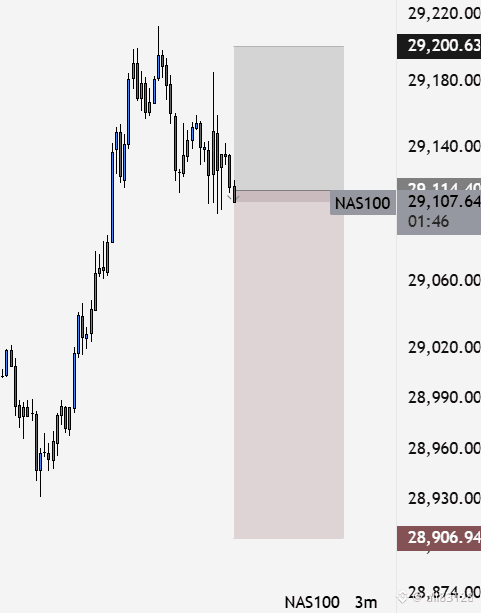
📍 Entry: 29114.4
🎯 TP: 28906.94
🛑 SL: 29200.63
Kamaal ka setup! NASDAQ SELL signal live hai!
⚠️ Always use proper risk management. This is not financial advice.
⚡ LIVE SIGNAL — Entry move hone se pehle follow karo!
#NASDAQ #Forex #FreeSignals #Trading
🔥 NASDAQ SELL Signal
📍 Entry: 29114.4
🎯 TP: 28906.94
🛑 SL: 29200.63
Kamaal ka setup! NASDAQ SELL signal live hai!
⚠️ Always use proper risk management. This is not financial advice.
⚡ LIVE SIGNAL — Entry move hone se pehle follow karo!
#NASDAQ #Forex #FreeSignals #Trading
📍 Entry: 29114.4
🎯 TP: 28906.94
🛑 SL: 29200.63
Kamaal ka setup! NASDAQ SELL signal live hai!
⚠️ Always use proper risk management. This is not financial advice.
⚡ LIVE SIGNAL — Entry move hone se pehle follow karo!
#NASDAQ #Forex #FreeSignals #Trading
2

·
--
Verified
#earningsseason
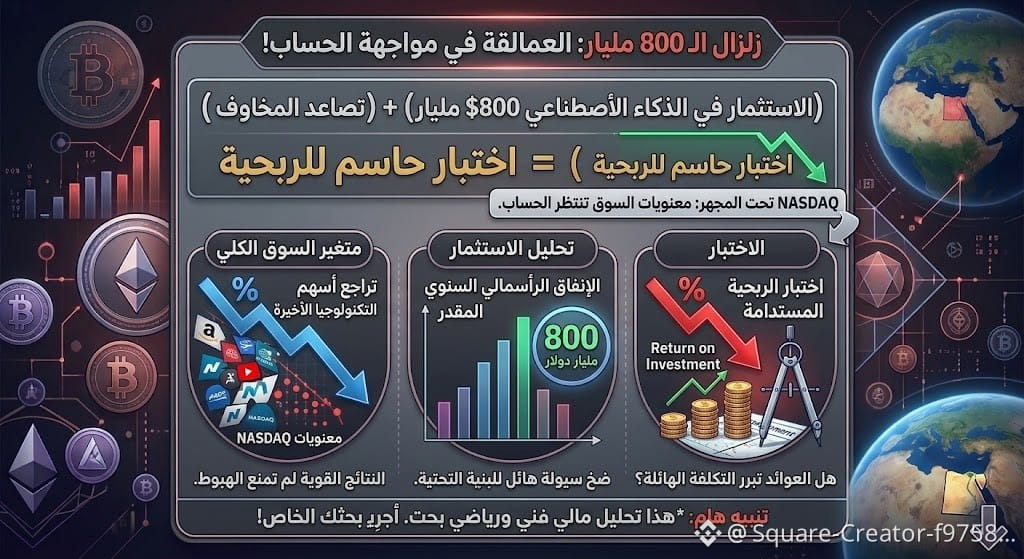
🚨The $800 billion shake-up: Tech giants face a major reckoning!
🤔Wall Street is gearing up for one of the most important weeks of the 2026 third-quarter earnings season, as GOOGL, MSFT, and AMZN face a decisive, make-or-break test. The biggest question: Will the massive investments in AI infrastructure—nearly $800 billion this year—deliver enough returns to justify their staggering cost?
😎Investors aren’t just looking at revenue; they’re seeking conclusive evidence that AI is becoming a sustainable profit engine rather than just an expensive race. As concerns about financing costs mount and tech stocks retreat despite their strength, these results will shape sentiment across the entire tech sector.
🤔 What do you think? Will these companies prove that their massive AI investments are worthwhile? Share your predictions in the comments! 👇💬
#earningsseason #NASDAQ #TechStocks #Aİ
1
5
6.4k

🚨 MARKETS ON THE EDGE! ⚠️
🥇 GOLD | 📉 NASDAQ (NQ) | ₿ BITCOIN
All three are fighting to hold their final lines of defense.
🔥 If these critical support levels break, we could see another wave of heavy selling and even more market pain.
⚠️ The next move could change everything. Watch key support levels closely and manage your risk.
📉 Will the bulls defend these levels, or are we heading for another major drop?
👇 What’s your prediction?
#Bitcoin #Gold #NASDAQ #CryptoMarket #Trading $BTC $NVDAB $XAU

73

·
--
Bullish
Partly True
🚨 Wall Street takes a major hit!
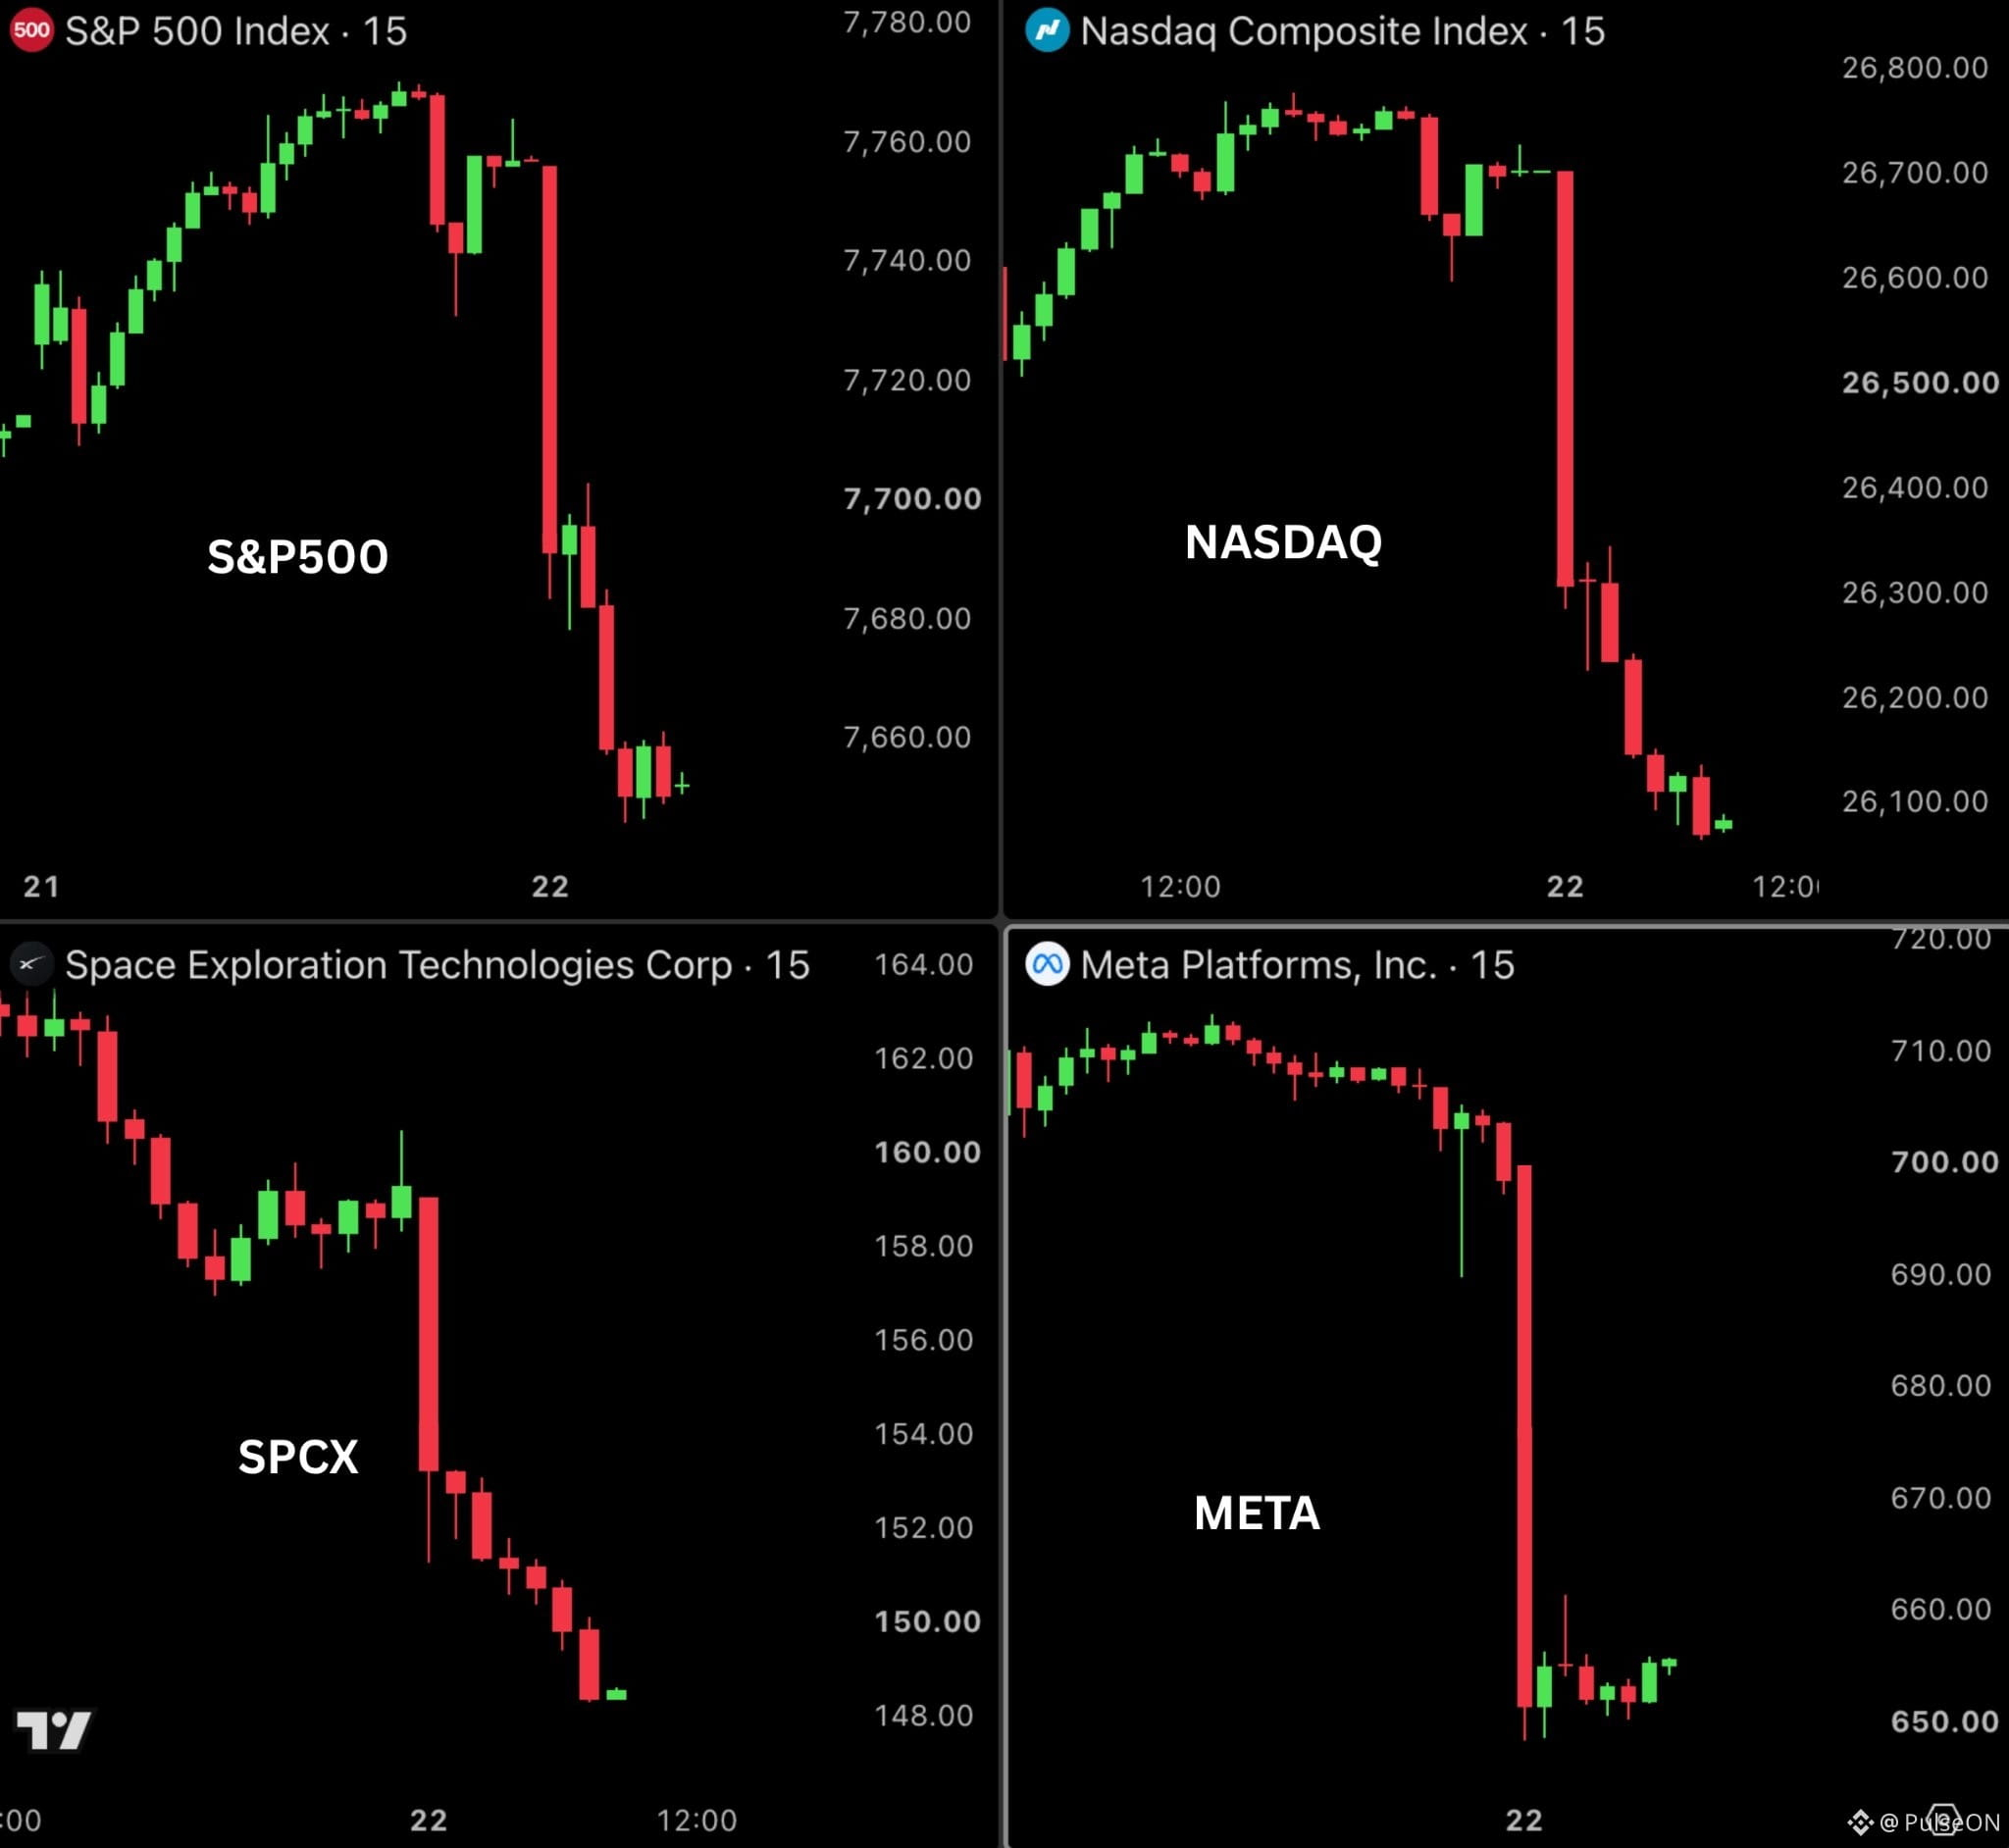
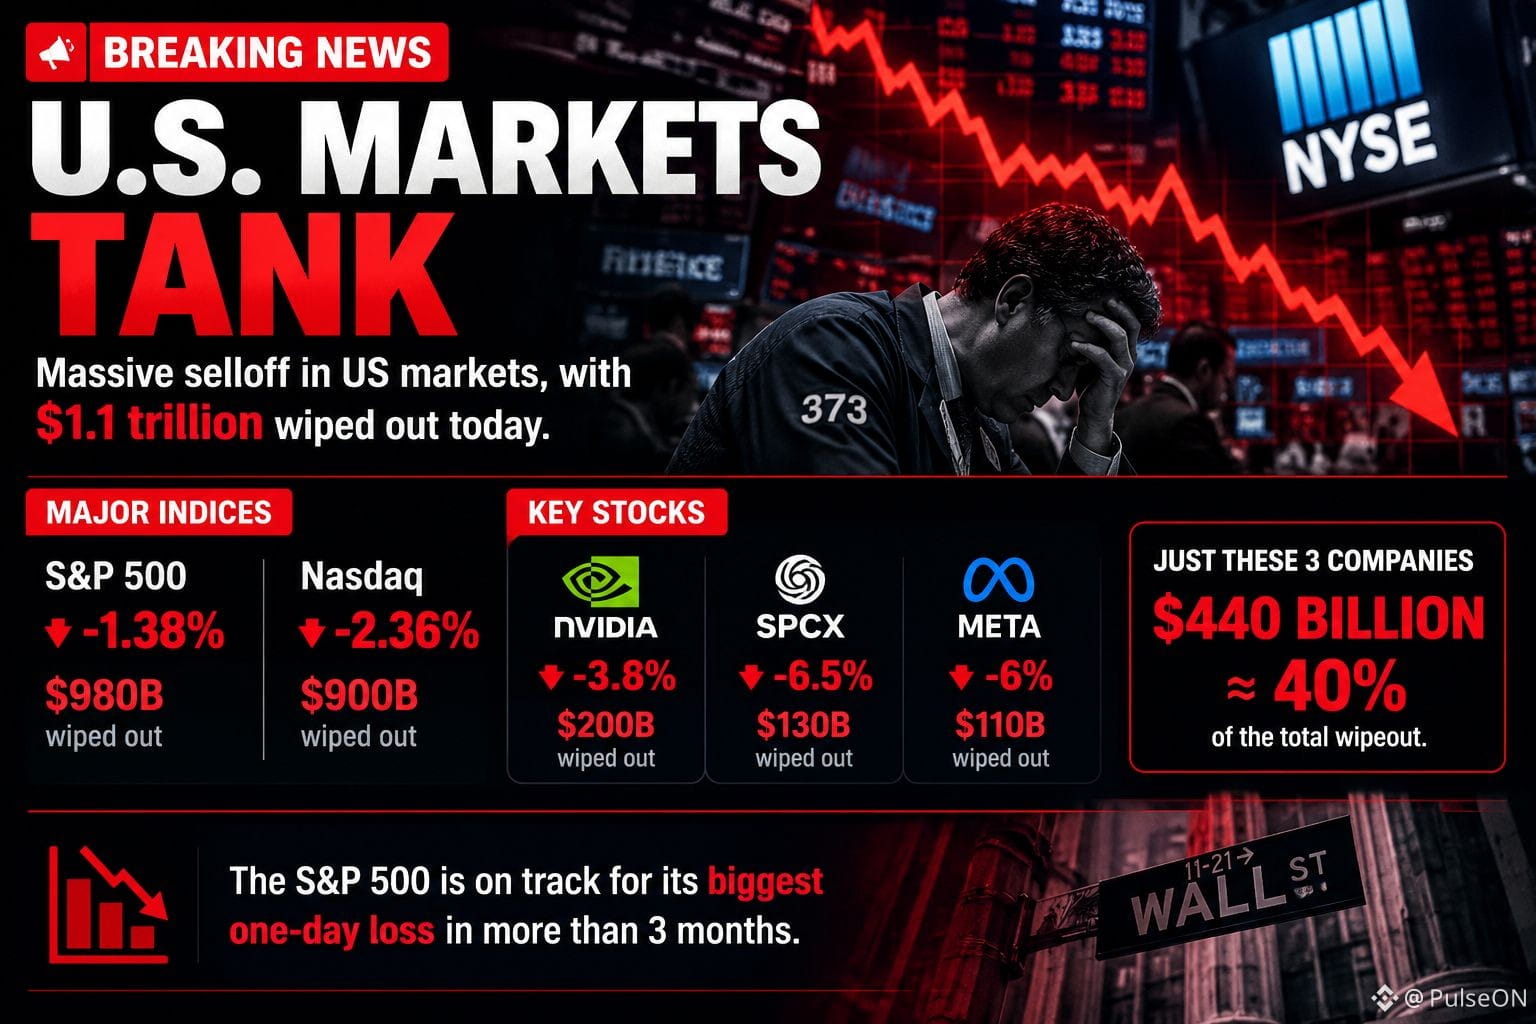
U.S. stocks are facing heavy selling pressure, with the S&P 500 down 1.38% and the Nasdaq dropping 2.36%.
$NVDA , $SPCX , and $META have reportedly lost a combined $440B in market value, adding to the market-wide selloff.
The S&P 500 is also on track for its biggest single-day drop in over 3 months.
When stocks bleed this hard, crypto traders should keep an eye on risk sentiment too. 👀
#Bitcoin #StockMarket #Crypto #Nasdaq #NVDA
1
644

·
--
Bearish
#Wallstreet #NASDAQ #AsianStocks #Kospi
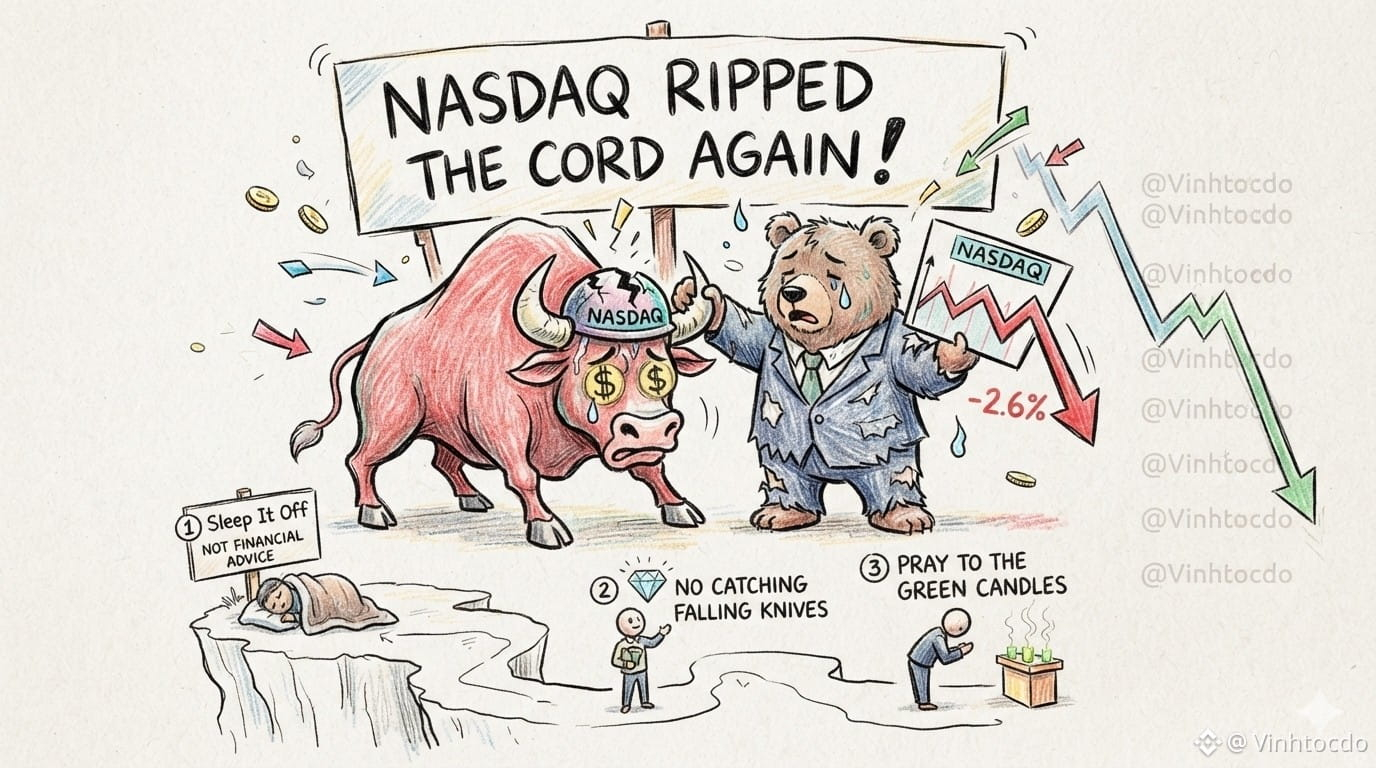
Midnight, I opened the app and saw the Nasdaq pull the plug and plunge straight down — 2.6%. My heart shattered and tears streamed down my face! 📉 The tech giants are all heading south together: Meta is down nearly 7%, NVIDIA has plunged 4.4%, and SK hynix has shed 8%. Looking over at Asia, Kospi and Asian Stocks must be “shaking” too, bracing for a red-candle beating.
What should traders do right now?
1️⃣ Close the app and go to sleep, as if you never saw a thing.
2️⃣ Absolutely don’t try to catch a falling knife unless your hands are made of diamonds.
3️⃣ Turn to spirituality, light some incense, and pray.
This is not financial advice. Want to get back to safety? Sign up for a new account now with referral code VINHTOCDO or click this link: [binance.com](https://www.binance.com/register?ref=VINHTOCDO)
Click below to trade and support me:
$SKHYNIX
{future}(SKHYNIXUSDT)
$SAMSUNG
{future}(SAMSUNGUSDT)
$HYUNDAI
{future}(HYUNDAIUSDT)
#Crypto #Trading #Stocks #MarketCrash #Bearish #VINHTOCDO
#Wallstreet #NASDAQ #AsianStocks #Kospi
Midnight, I opened the app and saw the Nasdaq pull the plug and plunge straight down — 2.6%. My heart shattered and tears streamed down my face! 📉 The tech giants are all heading south together: Meta is down nearly 7%, NVIDIA has plunged 4.4%, and SK hynix has shed 8%. Looking over at Asia, Kospi and Asian Stocks must be “shaking” too, bracing for a red-candle beating.
What should traders do right now?
1️⃣ Close the app and go to sleep, as if you never saw a thing.
2️⃣ Absolutely don’t try to catch a falling knife unless your hands are made of diamonds.
3️⃣ Turn to spirituality, light some incense, and pray.
This is not financial advice. Want to get back to safety? Sign up for a new account now with referral code VINHTOCDO or click this link: binance.com
Click below to trade and support me:
$SKHYNIX
$SAMSUNG
$HYUNDAI
#Crypto #Trading #Stocks #MarketCrash #Bearish #VINHTOCDO
3
152

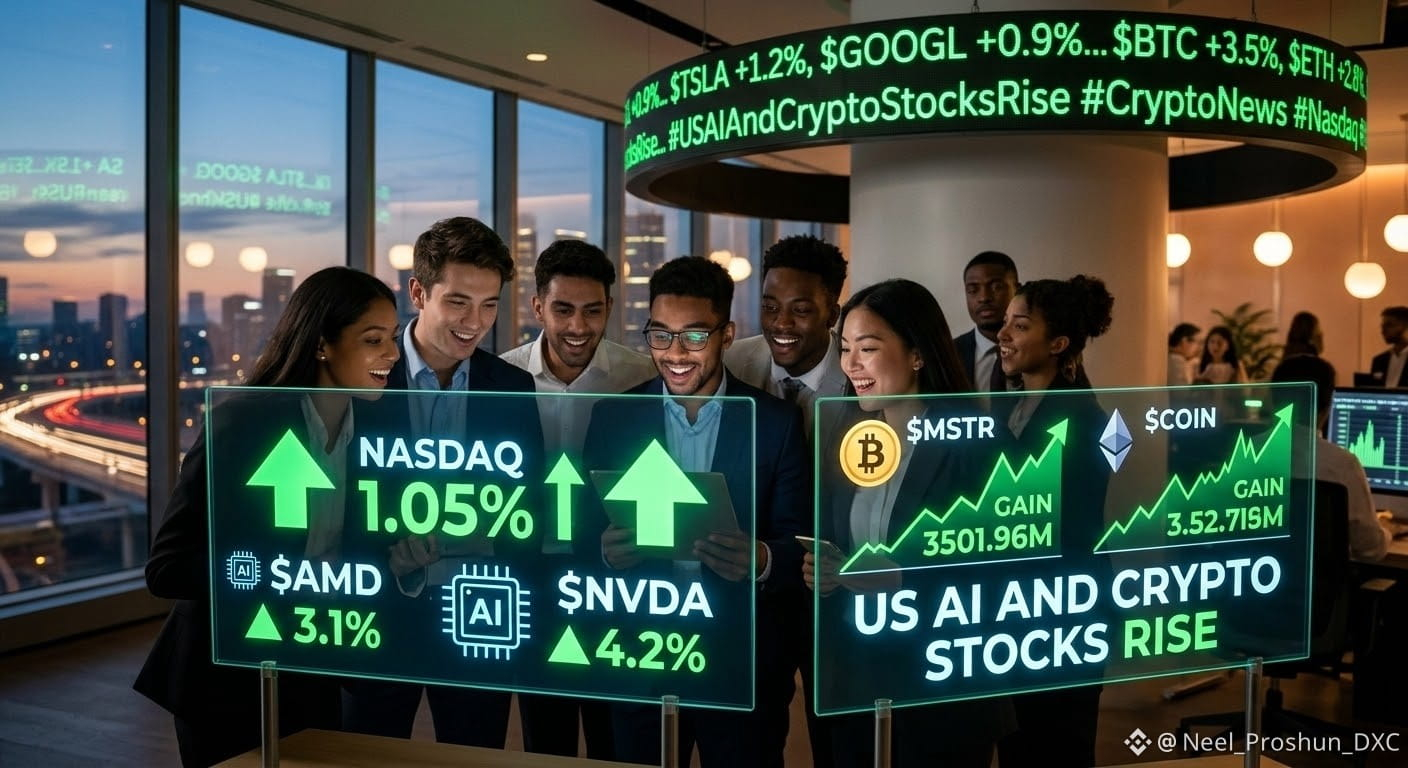
The Tech & Crypto Bull Run Continues!
Wall Street is buzzing today as the Nasdaq surged by 1.05%, driven by heavy buying in top AI and crypto-linked stocks! 📈
Heavy weights like $AMD ,$NVDA , MSTR and COIN led the charge, proving once again that the intersection of Artificial Intelligence, semiconductor technology, and digital assets is where the real market momentum lies. Investors are doubling down as tech innovation accelerates at an unprecedented pace.
💬 Is your portfolio aligned with the AI & Crypto revolution, or are you watching from the sidelines? Drop your favorite stock ticker below! 👇
#TechStocks #CryptoNews #Nasdaq
196

Article
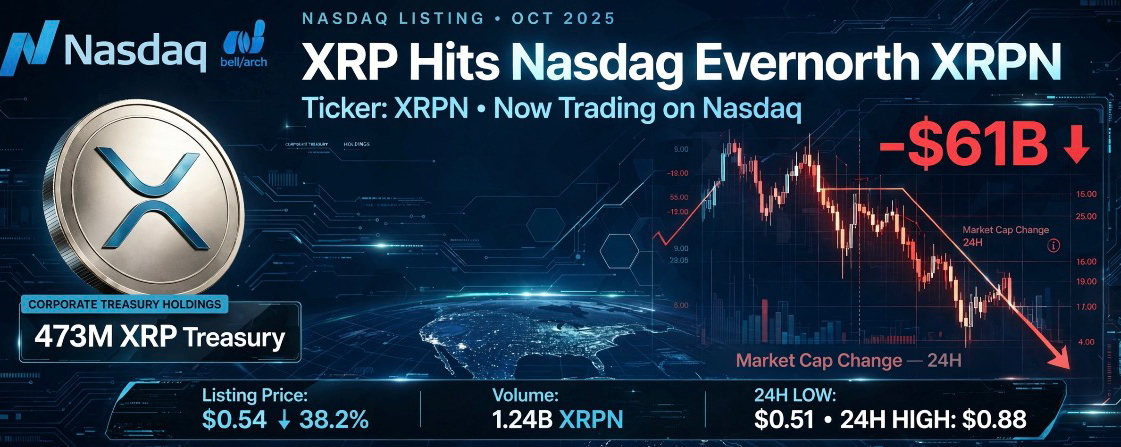
XRP Hits Nasdaq: Evernorth (XRPN) Lists With 473M XRP — But Price Down $61BXRP Hits Nasdaq! $XRP $XRPN
BREAKING Nasdaq Report Oct 12-19:
Nasdaq bell/arch: Evernorth Holdings (XRPN) now trading on Nasdaq
Holdings: 473M XRP Treasury — largest public XRP play
Backers: Ripple, Kraken, Pantera, SBI
BUT — Market reality:
-$61B market cap lost YoY ( $143B → $82B )
Price $2.39 → $1.30 (-45.5%)
80% SPAC redemptions = $195M pulled
My view: Long-term bullish (XRP on Wall Street like MSTR for BTC), short-term volatile. No fresh buying from listing yet — XRP was contributed before.
Trade: Waiting for $1.35 support. Watching $XRPN $16-$19 range.
Are you buying $XRP dip or waiting? Poll below 👇
#Xrp🔥🔥
{stock_us}(XRPN.US)
#XRPN #NASDAQ #Ripple $XRP
{future}(XRPUSDT)
XRP Hits Nasdaq: Evernorth (XRPN) Lists With 473M XRP — But Price Down $61B
XRP Hits Nasdaq! $XRP $XRPN
BREAKING Nasdaq Report Oct 12-19:
Nasdaq bell/arch: Evernorth Holdings (XRPN) now trading on Nasdaq
Holdings: 473M XRP Treasury — largest public XRP play
Backers: Ripple, Kraken, Pantera, SBI
BUT — Market reality:
-$61B market cap lost YoY ( $143B → $82B )
Price $2.39 → $1.30 (-45.5%)
80% SPAC redemptions = $195M pulled
My view: Long-term bullish (XRP on Wall Street like MSTR for BTC), short-term volatile. No fresh buying from listing yet — XRP was contributed before.
Trade: Waiting for $1.35 support. Watching $XRPN $16-$19 range.
Are you buying $XRP dip or waiting? Poll below 👇
#Xrp🔥🔥
#XRPN #NASDAQ #Ripple $XRP
XRP-0,01%
XRPNUS-1,72%
337

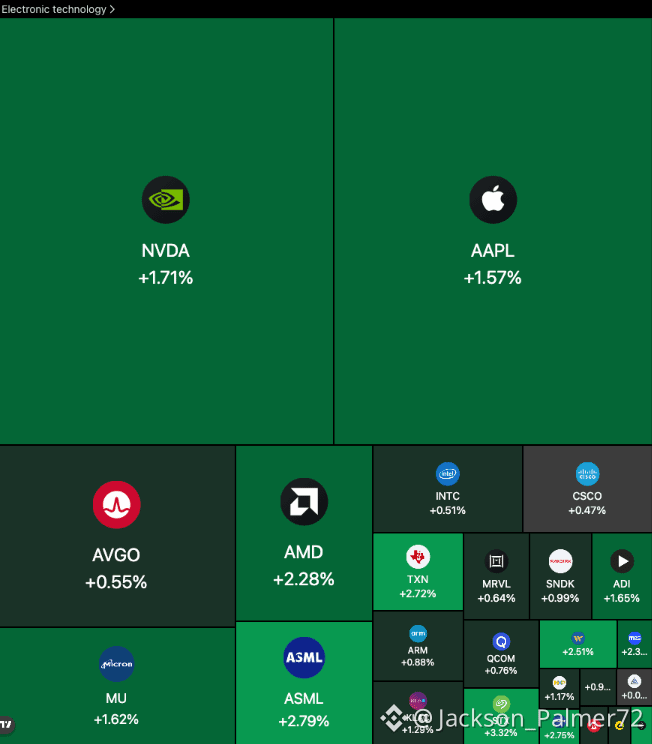
🔥 AI STOCKS ARE BACK IN THE SPOTLIGHT!
After last week’s sell-off, the tech market is showing signs of recovery, and strong company updates are bringing fresh confidence to investors.
📈 Here’s what’s driving the rebound:
🔹 Super Micro ($SMCI) +12%
The company raised its Q1 revenue outlook to $18.5B–$19.5B, supported by strong demand for AI servers and better expected gross margins.
🔹 SpaceX ($SPCX) +10%
SpaceX reported its first profit as a public company, while Elon Musk raised the possibility of a future merger with Tesla.
🔹 Other tech giants join the rally
Dell, HPE, and NVIDIA also moved higher, adding momentum to the recovering AI sector.
📊 The Nasdaq 100 climbed around 1%, while the S&P 500 gained 0.4%, according to the reported market figures.
What makes this recovery interesting is the timing. The Philadelphia Semiconductor Index had just suffered an eight-day losing streak, its longest in 18 years.
💡 My takeaway: AI is still attracting serious investment, but recent volatility reminds us that strong growth expectations can bring sharp market swings, too.
The big question now is whether this rebound has enough strength to continue or if another pullback is coming.
What do you think? Is the AI rally ready for another leg up, or should investors stay cautious? 👇
#AI #Stocks #Nasdaq #NVIDIA #CryptoMarket
1
155

·
--
#bnb
#NASDAQ
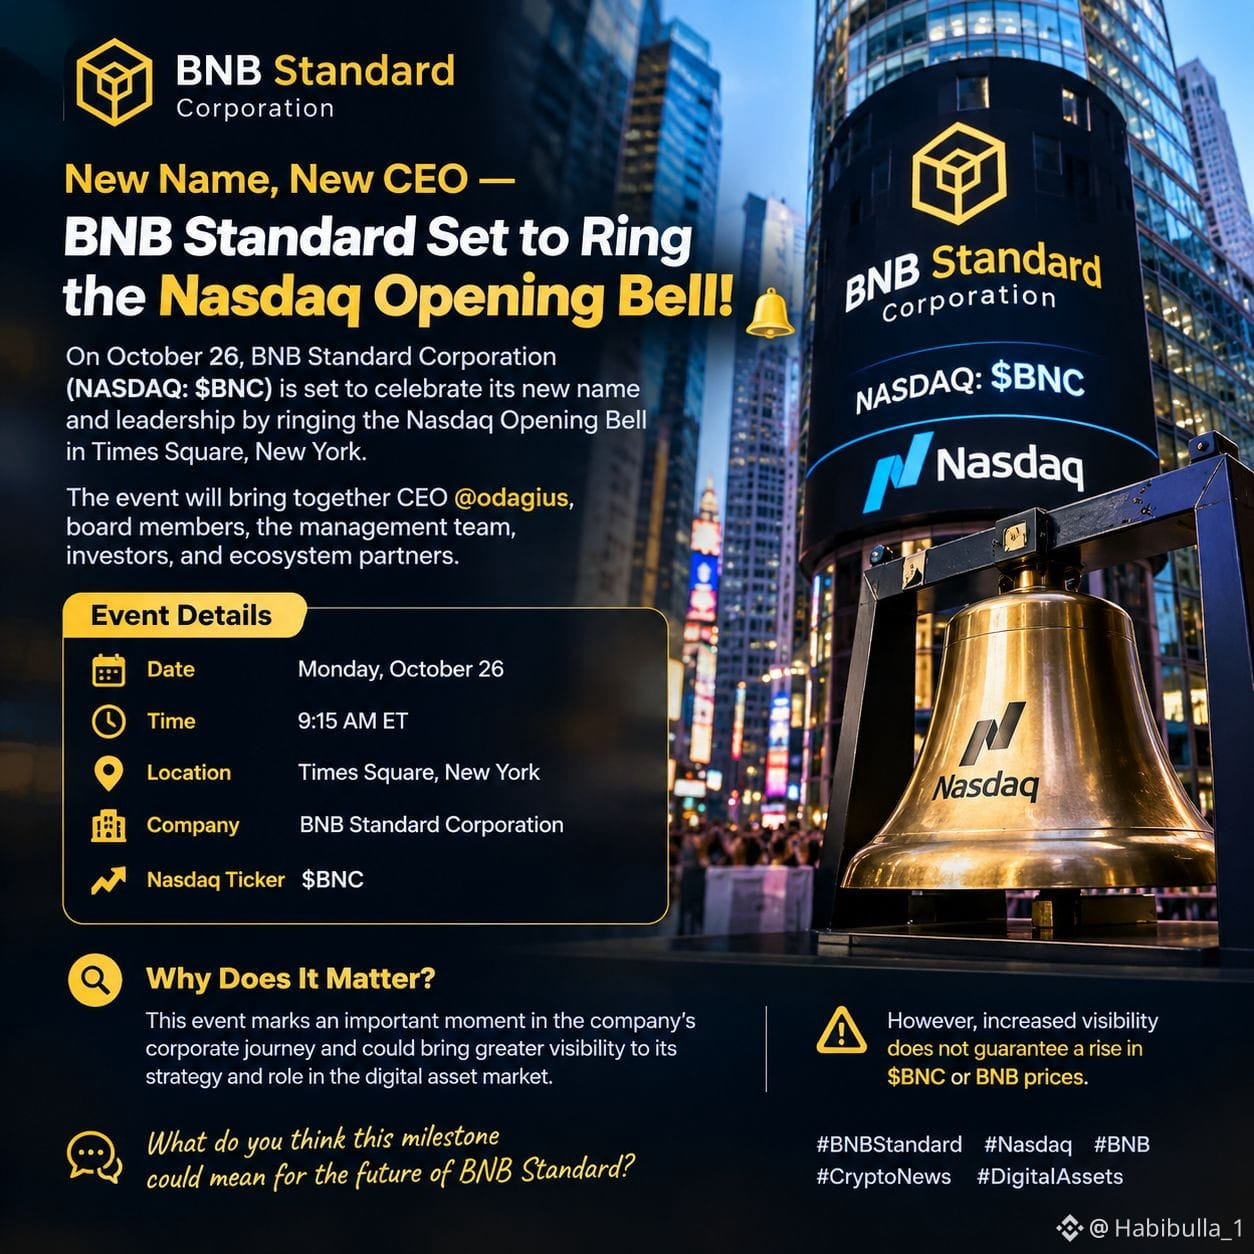
New Name, New CEO — BNB Standard Set to Ring the Nasdaq Opening Bell! 🔔
On October 26, BNB Standard Corporation (NASDAQ: $BNC ) is set to celebrate its new name and leadership by ringing the Nasdaq Opening Bell in Times Square, New York.
The event will bring together CEO @odagius, board members, the management team, investors, and ecosystem partners.
📌 Event Details:
📅 Date: Monday, October 26 ⏰ Time: 9:15 AM
ET 📍 Location: Times Square, New York 🏢 Company: BNB Standard Corporation 📈 Nasdaq Ticker: BNC
🔍 Why Does It Matter?
This event marks an important moment in the company’s corporate journey and could bring greater visibility to its strategy and role in the digital asset market.
However, increased visibility does not guarantee a rise in $BNC or $BNB prices.
💬 What do you think this milestone could mean for the future of BNB Standard?
#Nasdaq #CryptoNews #EarningsSeason
1
1
3
447

Justin Sun's Nasdaq experiment is 15 cents from a delisting warning.
TRON Inc shares are hovering around $1.15–$1.22 — barely above Nasdaq's $1 minimum bid price. Per Protos, the stock has shed roughly 50% from this year's highs, and Finnhub data puts the one-year return near −55%. Close below $1 for 30 straight sessions and Nasdaq starts a 180-day compliance clock toward delisting.
The irony: TRON Inc is a TRX treasury vehicle holding over $250 million in TRX, yet its market cap sits above $500 million — the wrapper is valued at nearly twice the crypto underneath. Meanwhile TRX itself sits flat around $0.331, unbothered.
This is the 2026 treasury-trade squeeze in miniature: the tokens hold up, but the wrapper trades at whatever premium the equity market feels like. Strategy proved the premium could last years. A growing list of smaller vehicles is proving it can evaporate in months.
Would you pay double the token price to hold it through a stock ticker — or is the treasury wrapper premium officially dead? NFA, always DYOR.
$TRX
#TRON #CryptoNews #Nasdaq #Treasury
1
8

·
--
BNB Standard, formerly CEA Industries, will begin trading on Nasdaq on October 26. It is building a business around a treasury in $BNB and plans to launch its own validator on BNB Chain. It is a public company that holds the token on its balance sheet and earns additional revenue from the network. Stories like these usually attract the attention of institutional investors.
Do you think companies with crypto treasuries are the future, or just a fad? 👇
#BNBStandard #Nasdaq #CryptoTreasury
Do you think companies with crypto treasuries are the future, or just a fad? 👇
#BNBStandard #Nasdaq #CryptoTreasury
106

·
--
Verified
NASDAQ & AI STOCKS: IS THE TECH RALLY LOSING MOMENTUM?
US technology stocks are facing renewed pressure as investors question whether massive AI investments can justify their rising financing costs.
On October 20, Nasdaq-100 futures fell 0.62%, while oil prices climbed amid renewed geopolitical tensions.
The latest pullback follows a brief recovery in technology stocks after last week's sell-off, showing that investor confidence remains fragile.
THREE FACTORS TO WATCH
1. AI FINANCING COSTS
Companies investing heavily in data centers and computing infrastructure face greater scrutiny over debt, capital expenditure, and future profitability.
2. CORPORATE EARNINGS
Upcoming reports from major technology companies could reveal whether AI spending is translating into sustainable revenue growth.
3. OIL & INTEREST RATES
Higher energy prices can reignite inflation concerns, potentially keeping borrowing costs elevated and pressuring technology stock valuations.
MARKET SIGNAL: MIXED, WITH BEARISH PRESSURE
The recent weakness suggests investors are becoming more selective rather than abandoning the AI sector entirely.
A sustained recovery would require stronger earnings evidence and renewed buying momentum. Further disappointment could increase downside pressure.
The key question is whether current valuations can withstand higher financing costs.
Are you still bullish on AI stocks, or do you think the market needs a deeper correction?
#NASDAQ #AIStocks #TechStocks #stockmarket
88

·
--
Article
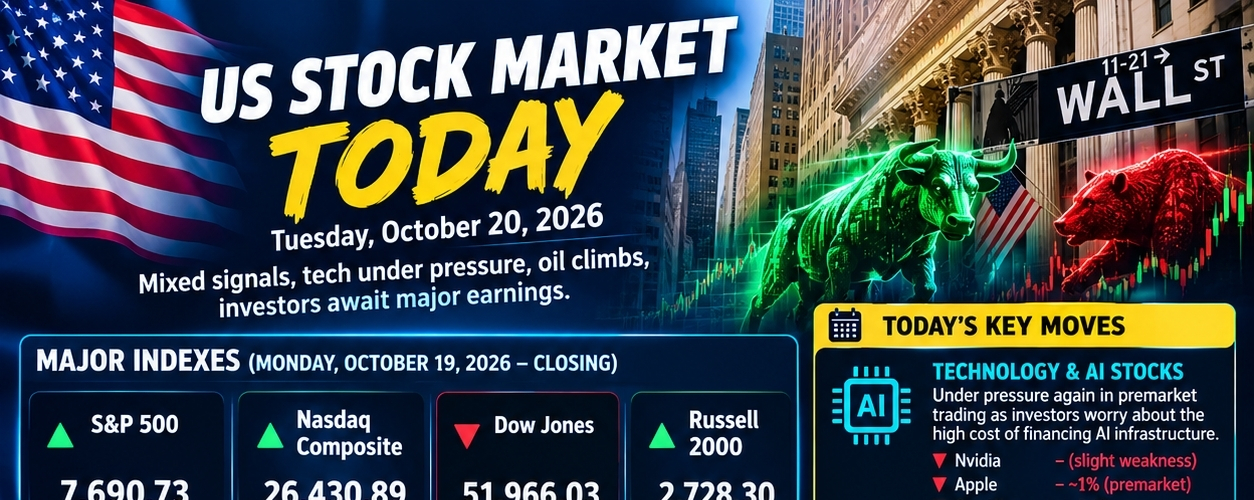
US STOCK MARKET TODAY 📉📈p🇺🇸 US STOCK MARKET TODAY
📅 Tuesday, October 20, 2026
The US stock market is showing mixed signals today, with technology stocks facing renewed pressure as investors watch oil prices and major corporate earnings.
📊 1. Latest US Stock Market Update
As of the latest available reports this morning, here is how the major indexes closed on Monday, October 19, 2026.
AP News
Index
Closing Level
Daily Change
📈 S&P 500
7,690.73
+0.41%
📈 Nasdaq Composite
26,430.89
+1.11%
📉 Dow Jones
51,966.03
-0.07%
📈 Russell 2000
2,728.30
+0.25%
Important: These are Monday's closing figures, not today's final prices.
🔥 2. What's Moving the Market Today?
🤖 Technology and AI stocks
Technology stocks are under pressure again in premarket trading as investors worry about the high cost of financing artificial intelligence infrastructure.
Nvidia is showing slight weakness.
Apple is down approximately 1% in premarket trading.
CoreWeave is down around 3.1%.
Nasdaq 100 futures are down approximately 0.5%.
Reuters
🛢️ Oil prices are rising
Brent crude oil has climbed above $110 per barrel amid geopolitical tensions.
Higher oil prices can increase inflation concerns and put pressure on companies and consumers.
The Wall Street Journal
🏢 Major earnings reports
Investors are watching upcoming earnings from major companies, including Netflix, Meta Platforms and Tesla.
Their results could influence technology stocks and broader market sentiment.
Reuters
📉 3. What Should Investors Watch?
Here are three important developments to monitor:
Bullish signal: Technology stocks recover and buying spreads beyond a handful of large companies.
Bearish signal: AI stocks continue falling as investors become more concerned about financing costs.
Market uncertainty: Oil prices remain elevated while investors await corporate earnings.
These are possible scenarios, not guaranteed outcomes.
🎯 4. Is the US Stock Market Bullish or Bearish Today?
My assessment: Cautious, with bearish pressure on technology stocks.
Monday's recovery in the Nasdaq and S&P 500 was encouraging, but today's weaker technology futures suggest the recovery may face challenges.
The actual direction of the market will become clearer as regular trading progresses.
💬 Let's discuss!
Which market would you like me to examine next?
📈 NASDAQ — technology stocks and AI companies.
📊 S&P 500 — the broader US stock market.
🏦 Dow Jones — major US companies.
₿ Bitcoin and the US stock market — how their movements relate.
US STOCK MARKET TODAY 📉📈
p🇺🇸 US STOCK MARKET TODAY
📅 Tuesday, October 20, 2026
The US stock market is showing mixed signals today, with technology stocks facing renewed pressure as investors watch oil prices and major corporate earnings.
📊 1. Latest US Stock Market Update
As of the latest available reports this morning, here is how the major indexes closed on Monday, October 19, 2026.
AP News
Index
Closing Level
Daily Change
📈 S&P 500
7,690.73
+0.41%
📈 Nasdaq Composite
26,430.89
+1.11%
📉 Dow Jones
51,966.03
-0.07%
📈 Russell 2000
2,728.30
+0.25%
Important: These are Monday's closing figures, not today's final prices.
🔥 2. What's Moving the Market Today?
🤖 Technology and AI stocks
Technology stocks are under pressure again in premarket trading as investors worry about the high cost of financing artificial intelligence infrastructure.
Nvidia is showing slight weakness.
Apple is down approximately 1% in premarket trading.
CoreWeave is down around 3.1%.
Nasdaq 100 futures are down approximately 0.5%.
Reuters
🛢️ Oil prices are rising
Brent crude oil has climbed above $110 per barrel amid geopolitical tensions.
Higher oil prices can increase inflation concerns and put pressure on companies and consumers.
The Wall Street Journal
🏢 Major earnings reports
Investors are watching upcoming earnings from major companies, including Netflix, Meta Platforms and Tesla.
Their results could influence technology stocks and broader market sentiment.
Reuters
📉 3. What Should Investors Watch?
Here are three important developments to monitor:
Bullish signal: Technology stocks recover and buying spreads beyond a handful of large companies.
Bearish signal: AI stocks continue falling as investors become more concerned about financing costs.
Market uncertainty: Oil prices remain elevated while investors await corporate earnings.
These are possible scenarios, not guaranteed outcomes.
🎯 4. Is the US Stock Market Bullish or Bearish Today?
My assessment: Cautious, with bearish pressure on technology stocks.
Monday's recovery in the Nasdaq and S&P 500 was encouraging, but today's weaker technology futures suggest the recovery may face challenges.
The actual direction of the market will become clearer as regular trading progresses.
💬 Let's discuss!
Which market would you like me to examine next?
📈 NASDAQ — technology stocks and AI companies.
📊 S&P 500 — the broader US stock market.
🏦 Dow Jones — major US companies.
₿ Bitcoin and the US stock market — how their movements relate.
162

·
--
🇺🇸 U.S. STOCK MARKET UPDATE 📈
📊 Market Watch | S&P 500 • Nasdaq • Technology
🔹 S&P 500: +0.4% — Broad-market strength
🚀 Nasdaq: +1.1% — Leading major index momentum
💻 Technology: +0.90% — Positive sector performance
🔌 Electronic Technology: +1.12% — Semiconductor and tech momentum
🛍️ Retail Trade: +2.10% — Strong sector movement
💡 Market Insight: Technology stocks are leading the latest market momentum, while the S&P 500 remains a key benchmark for broader U.S. equities.
👀 What to Watch: Corporate earnings, Treasury yields, inflation data, and the sustainability of the semiconductor rebound.
⚠️ Market conditions can change rapidly. Verify live data before making trading decisions.
📌 Market analysis only — not financial advice.
#USStockMarket #Nasdaq #StockMarket
1
42

·
--
Verified
Article
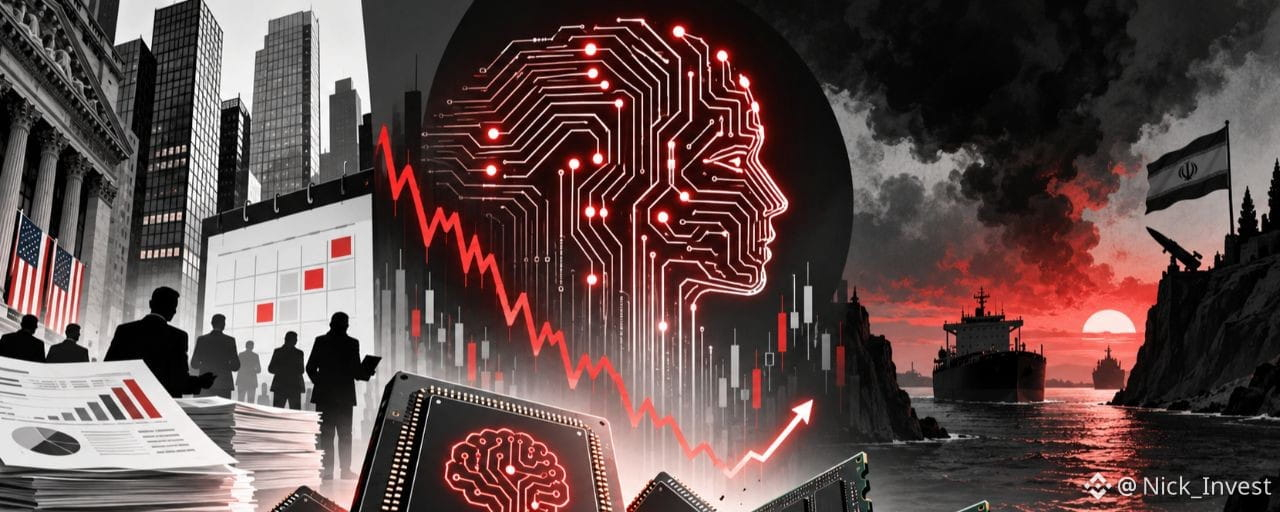
Nasdaq -4.5%. Strong earnings reports are needed nowHi everyone, we’re starting a new week after a pretty sharp sell-off in tech stocks. Last week, the Nasdaq fell 4.5%, while the semiconductor sector dropped even more sharply — the market once again began asking whether the AI trade has gone too far and whether all these hundreds of billions in spending on data centers and chips will pay off.
Nasdaq -4.5%. Strong earnings reports are needed now
Hi everyone, we’re starting a new week after a pretty sharp sell-off in tech stocks. Last week, the Nasdaq fell 4.5%, while the semiconductor sector dropped even more sharply — the market once again began asking whether the AI trade has gone too far and whether all these hundreds of billions in spending on data centers and chips will pay off.
1
299
Log in to explore more content
Join global crypto users on Binance Square
⚡️ Get latest and useful information about crypto.
💬 Trusted by the world’s largest crypto exchange.
👍 Discover real insights from verified creators.
Email / Phone number
Trending Topics
1
#BinancePick
2.9M views
150,946 Discussing
2
#EarningsSeason
5.2M views
25,691 Discussing
3
#AnthropicTTMRevenueGrewAbout1200%
13,700 views
292 Discussing
4
#AnthropicS1ExpectedToday
16,358 views
267 Discussing
5
#SouthKoreaReportedlyWeighsFourthCryptoTaxDelay
22,965 views
400 Discussing
6
#FranklinTempletonFilesForTwoDividendToBitcoinETFs
30,789 views
495 Discussing
7
#StrategyMSTRSurpassesNasdaqInMarketCap
23,615 views
358 Discussing
8
#CanadaProposesStablecoinRedemptionWithin3BusinessDays
1,100 views
34 Discussing
9
#ElectrumWalletBugLetRogueServersStealFunds
25,743 views
441 Discussing
10
#ArgentineCourtDismissesLIBRACaseAgainstMilei
39,202 views
542 Discussing