
#indicator
indicator
64,326 views
228 Discussing
Hot
Latest

·
--
--
**Selling the full source code to a Pine Script indicator suite. One buyer, exclusive.**
I built a trading indicator — a three-tier ICT/SMC system for TradingView. I'm selling the whole thing outright: full rights, complete codebase, no copies retained, no version left on the market.
**What's included:**
- Three tiers — V6 (ICT foundation), V8 (structure + context), V10 (full quant engine)
- 14-point confluence scoring, three signal tiers (Base / Quality / Elite)
- Regime detection: TREND / RANGE / BREAKOUT / CRISIS
- CRISIS mode — kills all signals when realised volatility exceeds ~2.5x its 100-bar average. No override, no setting to disable it
- Capital circuit breaker — scales sizing toward zero when live expectancy drops below breakeven
- Fee-adjusted expectancy tracking and fractional Kelly sizing
- Hydra Coach — plain-English on-chart explanation layer with Learn Mode
- Node.js/Express webhook server: TradingView alerts → formatted analysis → Telegram delivery
- 23-page product manual, 20-page trading fundamentals guide, brand assets and site
**Who this is for:** affiliates, copy-trading lead traders, and educators who already have an audience. You rebrand it as yours. It becomes your retention asset — your people get a tool, you get the code and the roadmap.
**What I'm not claiming:** no verified track record, no published win rate, no backtest I'm asking you to take on faith. Audit the code yourself before any money moves. I'll grant chart access and walk you through every line.
Open to structured terms for the right buyer.
DM for a code walkthrough.
#indicator
--
**Selling the full source code to a Pine Script indicator suite. One buyer, exclusive.**
I built a trading indicator — a three-tier ICT/SMC system for TradingView. I'm selling the whole thing outright: full rights, complete codebase, no copies retained, no version left on the market.
**What's included:**
- Three tiers — V6 (ICT foundation), V8 (structure + context), V10 (full quant engine)
- 14-point confluence scoring, three signal tiers (Base / Quality / Elite)
- Regime detection: TREND / RANGE / BREAKOUT / CRISIS
- CRISIS mode — kills all signals when realised volatility exceeds ~2.5x its 100-bar average. No override, no setting to disable it
- Capital circuit breaker — scales sizing toward zero when live expectancy drops below breakeven
- Fee-adjusted expectancy tracking and fractional Kelly sizing
- Hydra Coach — plain-English on-chart explanation layer with Learn Mode
- Node.js/Express webhook server: TradingView alerts → formatted analysis → Telegram delivery
- 23-page product manual, 20-page trading fundamentals guide, brand assets and site
**Who this is for:** affiliates, copy-trading lead traders, and educators who already have an audience. You rebrand it as yours. It becomes your retention asset — your people get a tool, you get the code and the roadmap.
**What I'm not claiming:** no verified track record, no published win rate, no backtest I'm asking you to take on faith. Audit the code yourself before any money moves. I'll grant chart access and walk you through every line.
Open to structured terms for the right buyer.
DM for a code walkthrough.
#indicator
**Selling the full source code to a Pine Script indicator suite. One buyer, exclusive.**
I built a trading indicator — a three-tier ICT/SMC system for TradingView. I'm selling the whole thing outright: full rights, complete codebase, no copies retained, no version left on the market.
**What's included:**
- Three tiers — V6 (ICT foundation), V8 (structure + context), V10 (full quant engine)
- 14-point confluence scoring, three signal tiers (Base / Quality / Elite)
- Regime detection: TREND / RANGE / BREAKOUT / CRISIS
- CRISIS mode — kills all signals when realised volatility exceeds ~2.5x its 100-bar average. No override, no setting to disable it
- Capital circuit breaker — scales sizing toward zero when live expectancy drops below breakeven
- Fee-adjusted expectancy tracking and fractional Kelly sizing
- Hydra Coach — plain-English on-chart explanation layer with Learn Mode
- Node.js/Express webhook server: TradingView alerts → formatted analysis → Telegram delivery
- 23-page product manual, 20-page trading fundamentals guide, brand assets and site
**Who this is for:** affiliates, copy-trading lead traders, and educators who already have an audience. You rebrand it as yours. It becomes your retention asset — your people get a tool, you get the code and the roadmap.
**What I'm not claiming:** no verified track record, no published win rate, no backtest I'm asking you to take on faith. Audit the code yourself before any money moves. I'll grant chart access and walk you through every line.
Open to structured terms for the right buyer.
DM for a code walkthrough.
#indicator
78

·
--
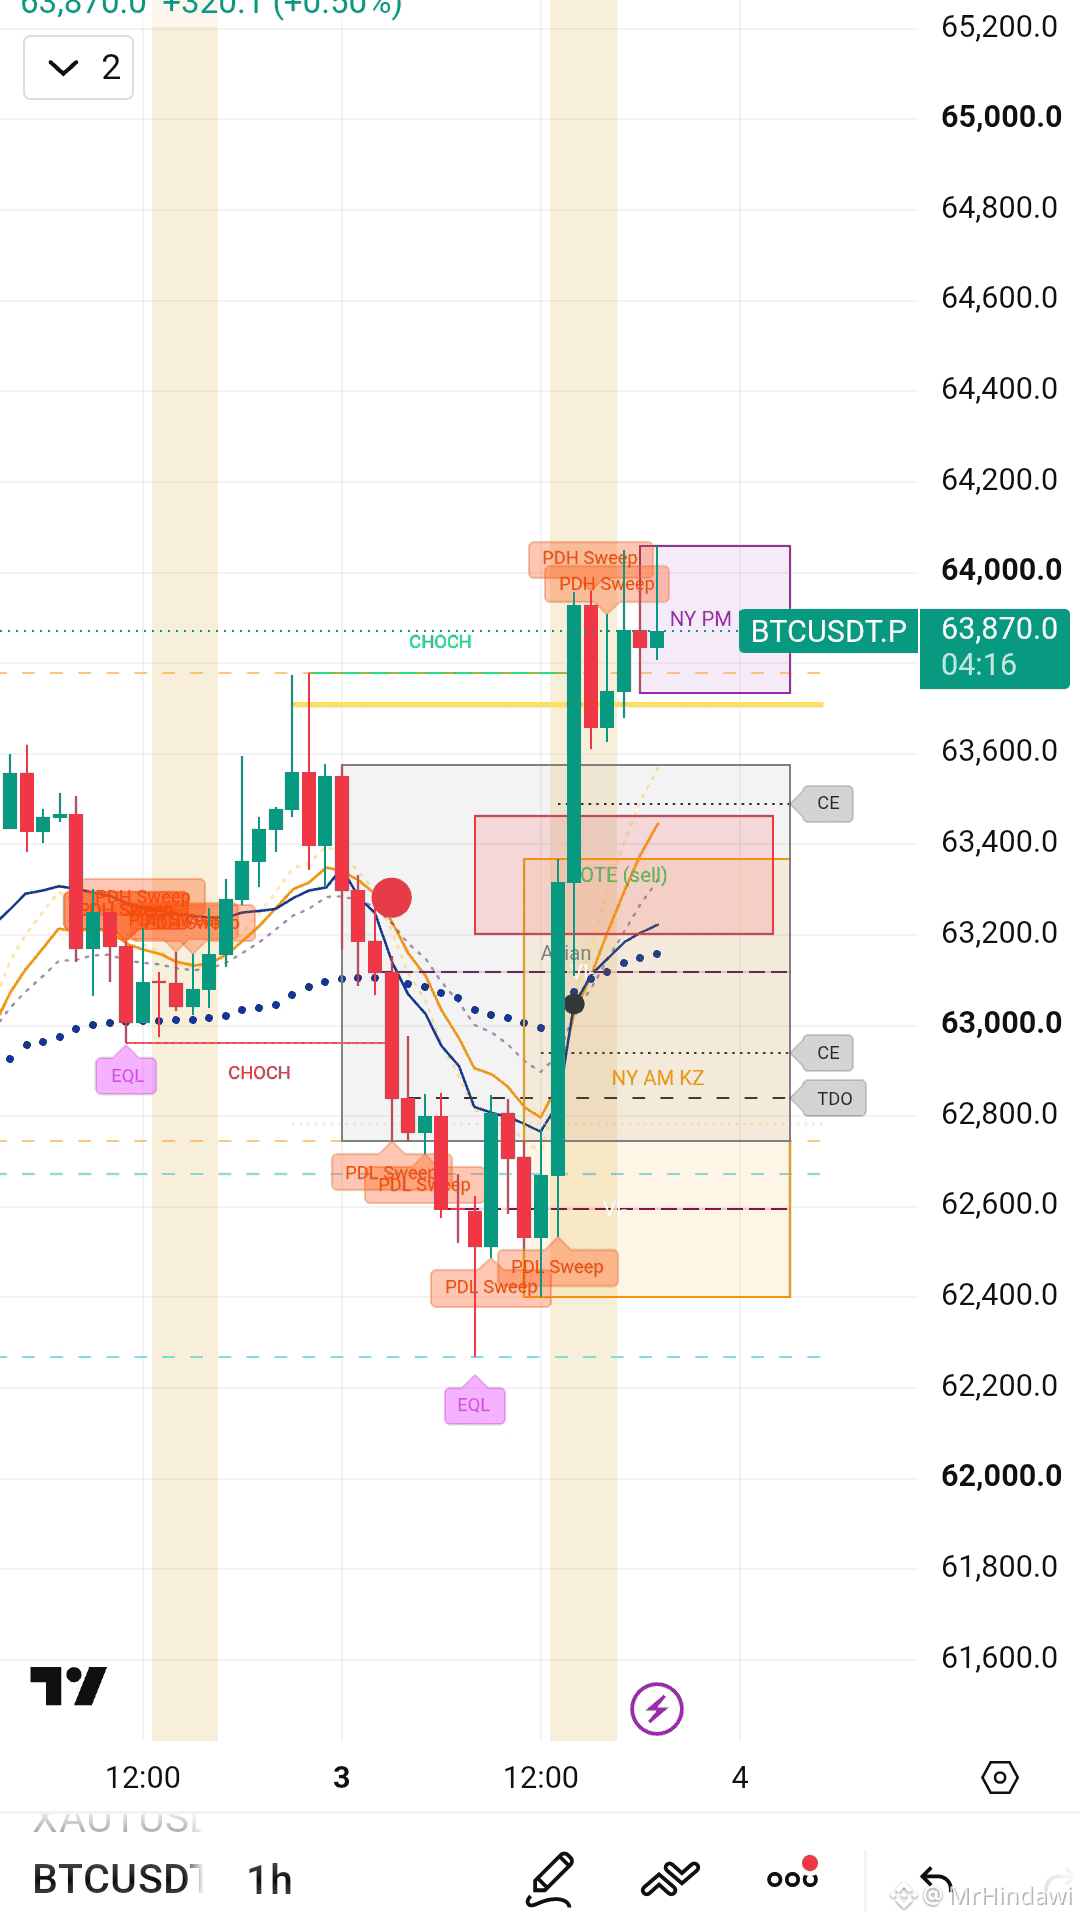
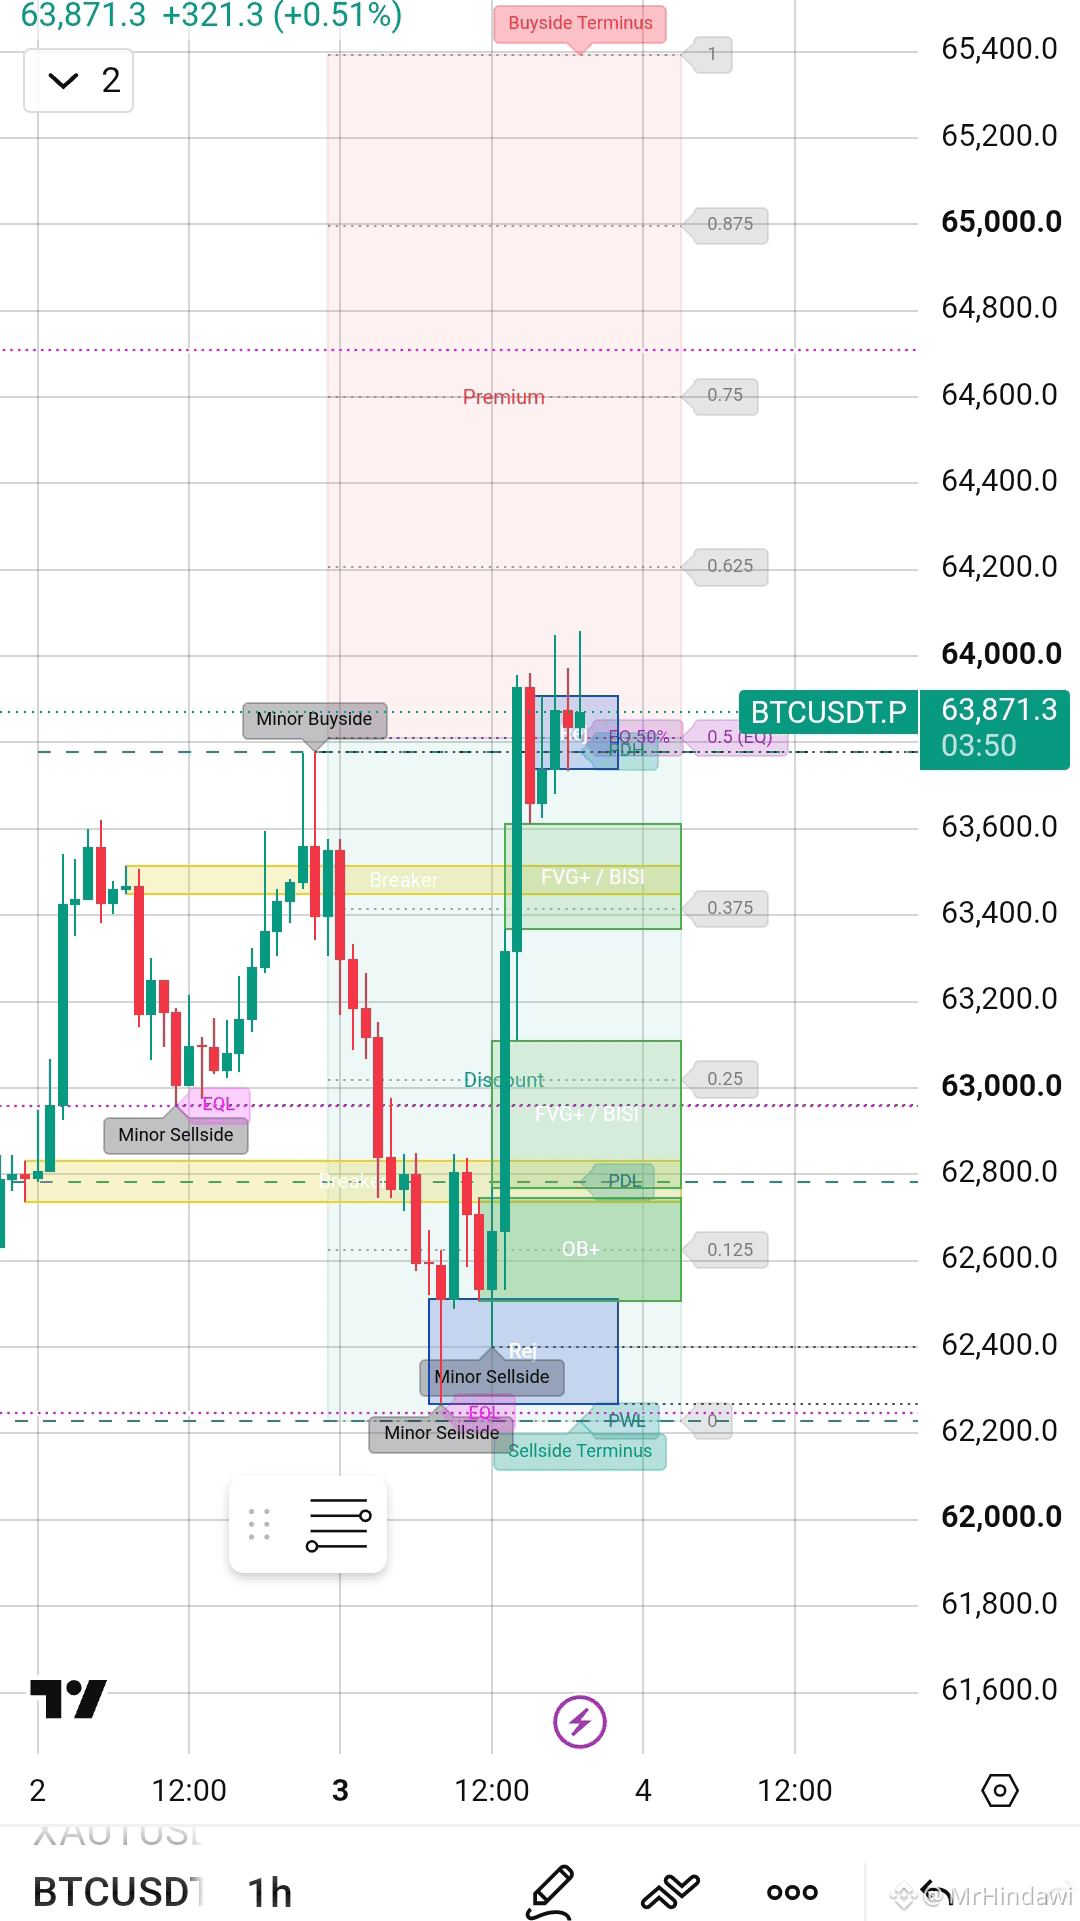
Finnaly my indicators get into lights
Mastry ict concepts indicators
Hard working gets you to wounderfull area 🧸🎯
If you ask me how to trade i will mention this pure work.
$BTC
#indicator
Finnaly my indicators get into lights
Mastry ict concepts indicators
Hard working gets you to wounderfull area 🧸🎯
If you ask me how to trade i will mention this pure work.
$BTC
#indicator
Mastry ict concepts indicators
Hard working gets you to wounderfull area 🧸🎯
If you ask me how to trade i will mention this pure work.
$BTC
#indicator
87

·
--
Bullish
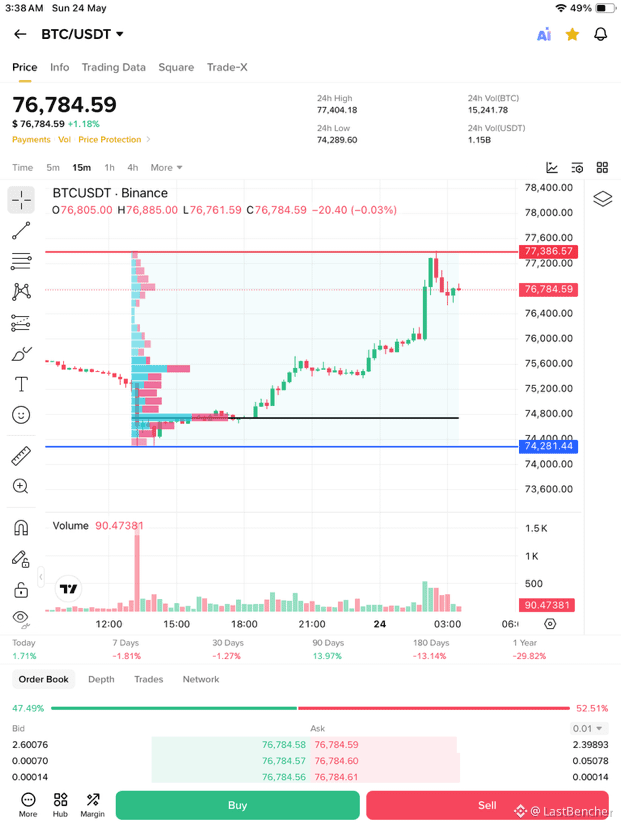
Fixed Range Volume Profile Indicator
The Fixed Range Volume Profile shows how much buying and selling happened at different price levels inside a selected range.
🔵 Blue = Buying volume
🔴 Pink = Selling volume
📏 Bigger bar = More volume traded at that price
How to Draw It
📈 Uptrend:
Draw from the swing low to the swing high.
📉 Downtrend:
Draw from the swing high to the swing low.
How to Use It
✅ High-volume zones = Strong support/resistance
✅ Low-volume zones = Price moves fast through them
✅ POC (biggest bar) = Most traded price level
Trading Idea
* Price above POC = Bullish
* Price below POC = Bearish
* Retest of high-volume zone + rejection = possible entry
Volume Profile basically shows:
“Where the market traded the most and is likely to come back.”
#LONG #SHORT #TRADE #SIGNAL #INDICATOR
📈 Trade Now $BTC
{future}(BTCUSDT)
Fixed Range Volume Profile Indicator
The Fixed Range Volume Profile shows how much buying and selling happened at different price levels inside a selected range.
🔵 Blue = Buying volume
🔴 Pink = Selling volume
📏 Bigger bar = More volume traded at that price
How to Draw It
📈 Uptrend:
Draw from the swing low to the swing high.
📉 Downtrend:
Draw from the swing high to the swing low.
How to Use It
✅ High-volume zones = Strong support/resistance
✅ Low-volume zones = Price moves fast through them
✅ POC (biggest bar) = Most traded price level
Trading Idea
* Price above POC = Bullish
* Price below POC = Bearish
* Retest of high-volume zone + rejection = possible entry
Volume Profile basically shows:
“Where the market traded the most and is likely to come back.”
#LONG #SHORT #TRADE #SIGNAL #INDICATOR
📈 Trade Now $BTC
The Fixed Range Volume Profile shows how much buying and selling happened at different price levels inside a selected range.
🔵 Blue = Buying volume
🔴 Pink = Selling volume
📏 Bigger bar = More volume traded at that price
How to Draw It
📈 Uptrend:
Draw from the swing low to the swing high.
📉 Downtrend:
Draw from the swing high to the swing low.
How to Use It
✅ High-volume zones = Strong support/resistance
✅ Low-volume zones = Price moves fast through them
✅ POC (biggest bar) = Most traded price level
Trading Idea
* Price above POC = Bullish
* Price below POC = Bearish
* Retest of high-volume zone + rejection = possible entry
Volume Profile basically shows:
“Where the market traded the most and is likely to come back.”
#LONG #SHORT #TRADE #SIGNAL #INDICATOR
📈 Trade Now $BTC
129
·
--
Bearish
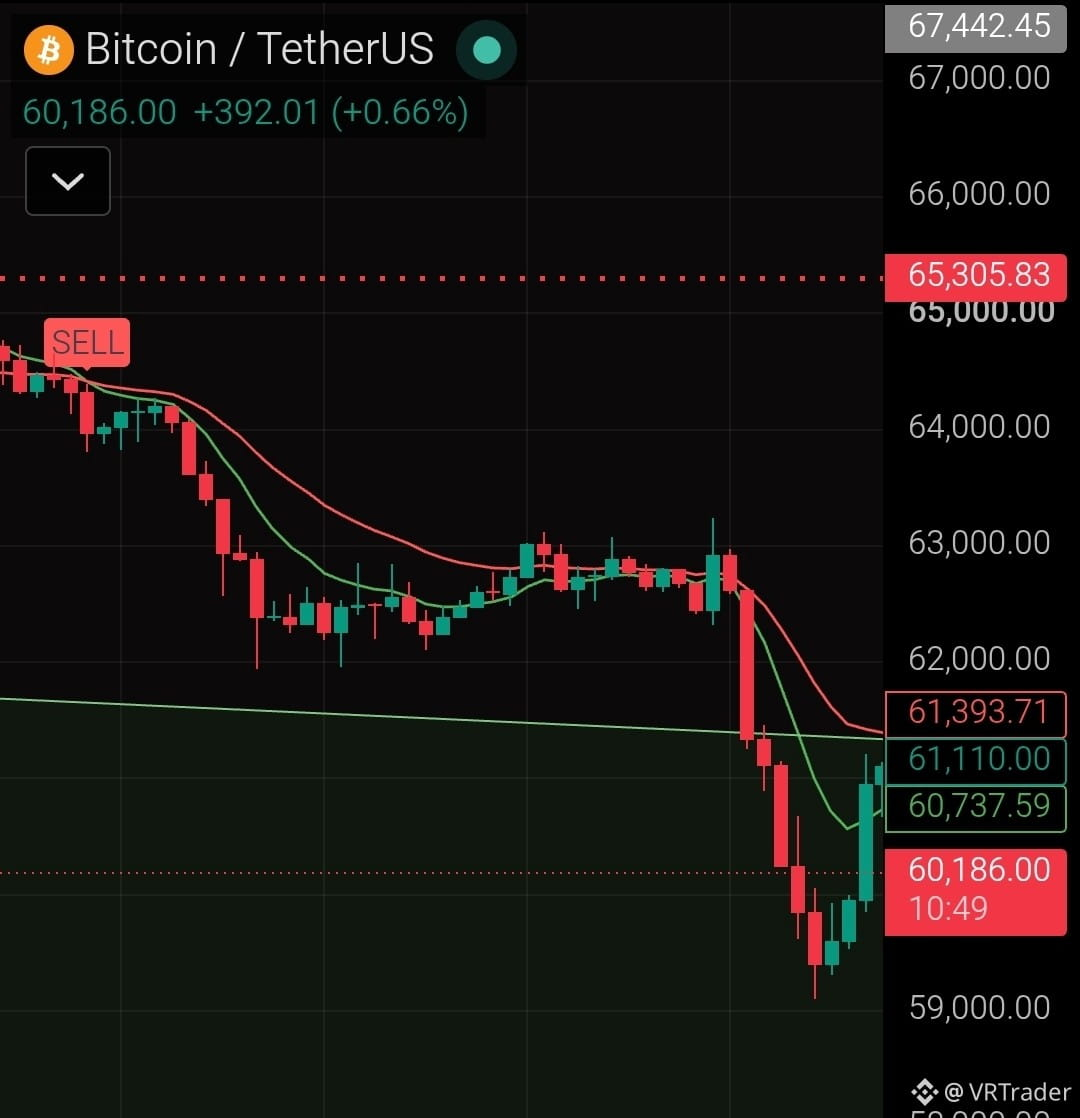
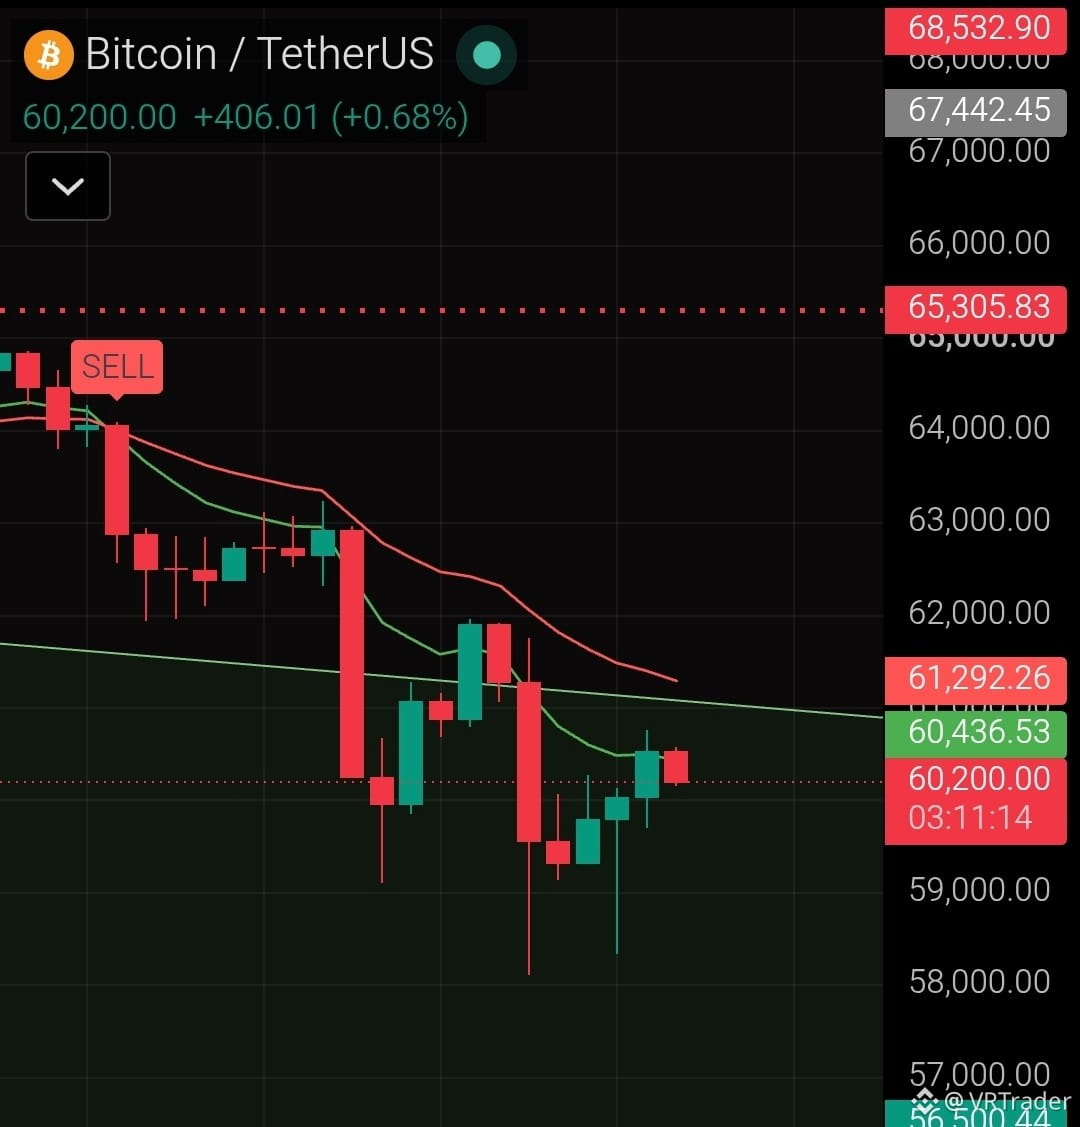
I developed this brilliant indicator that managed to predict $BTC fall long before the actual dump.
{future}(BTCUSDT)
It didn't predict not just once or twice, it's working very nicely on any chart.
No buy signal so far so we're still in the bear run. 📉
DYOR #Binance #BTC #indicator $NVDAB $SIREN
I developed this brilliant indicator that managed to predict $BTC fall long before the actual dump.
It didn't predict not just once or twice, it's working very nicely on any chart.
No buy signal so far so we're still in the bear run. 📉
DYOR #Binance #BTC #indicator $NVDAB $SIREN
It didn't predict not just once or twice, it's working very nicely on any chart.
No buy signal so far so we're still in the bear run. 📉
DYOR #Binance #BTC #indicator $NVDAB $SIREN
1
316

·
--
Bullish
$BTC
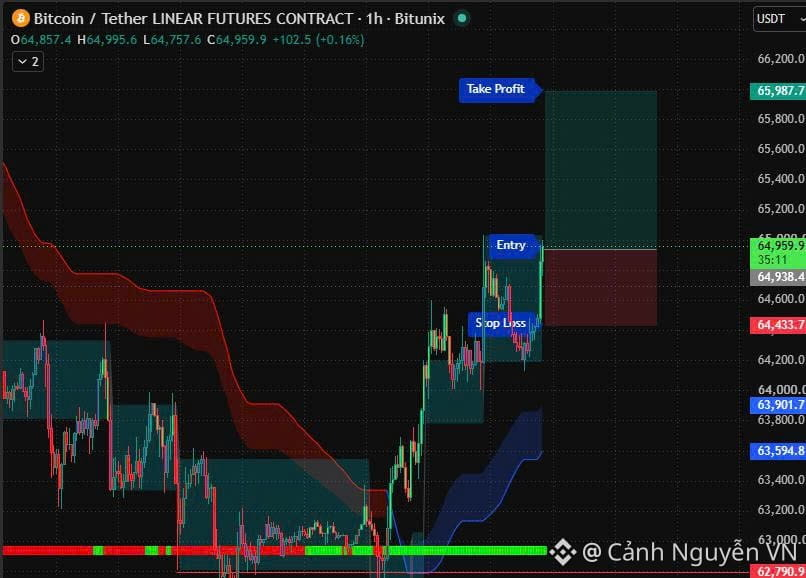
Enter order (Entry): Approximately 64,938.4 USDT
Stop Loss (SL): 64,433.7 USDT
Take Profit (TP): 65,987.7 USDT
Risk/Reward (R:R) ratio: Approximately 1:2 (Risk 1 part to gain 2 parts—this is a good risk management ratio).
2. Technical structure analysis on the chart
Short-term trend: Price has just gone through a strong upsw ing from the previous bottom area (around 63,000 USDT) and broke above the red cloud band (turning green/gray depending on the indicator). This indicates that buying pressure is dominant in the short term.
Support and Resistance:
Support: The dark green horizontal line around 63,000 USDT is a strong support level (the old bottom has been tested many times). The SL point is placed just below the most recent pin-bar/withdrawal candle cluster (around 64,400 USDT) to protect the position if the price reverses downward further.
Resistance: The take-profit (TP) zone is set just below the previous high (the red candle area on the left). This is a reasonable target because price often tends to revisit prior resistance highs before deciding on the next trend direction
#45NgayTuDoTaiChinh #indicator
Join the group on the personal page to receive the fastest trading signals and news
$BTC
Enter order (Entry): Approximately 64,938.4 USDT
Stop Loss (SL): 64,433.7 USDT
Take Profit (TP): 65,987.7 USDT
Risk/Reward (R:R) ratio: Approximately 1:2 (Risk 1 part to gain 2 parts—this is a good risk management ratio).
2. Technical structure analysis on the chart
Short-term trend: Price has just gone through a strong upsw ing from the previous bottom area (around 63,000 USDT) and broke above the red cloud band (turning green/gray depending on the indicator). This indicates that buying pressure is dominant in the short term.
Support and Resistance:
Support: The dark green horizontal line around 63,000 USDT is a strong support level (the old bottom has been tested many times). The SL point is placed just below the most recent pin-bar/withdrawal candle cluster (around 64,400 USDT) to protect the position if the price reverses downward further.
Resistance: The take-profit (TP) zone is set just below the previous high (the red candle area on the left). This is a reasonable target because price often tends to revisit prior resistance highs before deciding on the next trend direction
#45NgayTuDoTaiChinh #indicator
Join the group on the personal page to receive the fastest trading signals and news
Enter order (Entry): Approximately 64,938.4 USDT
Stop Loss (SL): 64,433.7 USDT
Take Profit (TP): 65,987.7 USDT
Risk/Reward (R:R) ratio: Approximately 1:2 (Risk 1 part to gain 2 parts—this is a good risk management ratio).
2. Technical structure analysis on the chart
Short-term trend: Price has just gone through a strong upsw ing from the previous bottom area (around 63,000 USDT) and broke above the red cloud band (turning green/gray depending on the indicator). This indicates that buying pressure is dominant in the short term.
Support and Resistance:
Support: The dark green horizontal line around 63,000 USDT is a strong support level (the old bottom has been tested many times). The SL point is placed just below the most recent pin-bar/withdrawal candle cluster (around 64,400 USDT) to protect the position if the price reverses downward further.
Resistance: The take-profit (TP) zone is set just below the previous high (the red candle area on the left). This is a reasonable target because price often tends to revisit prior resistance highs before deciding on the next trend direction
#45NgayTuDoTaiChinh #indicator
Join the group on the personal page to receive the fastest trading signals and news
4
268
Article
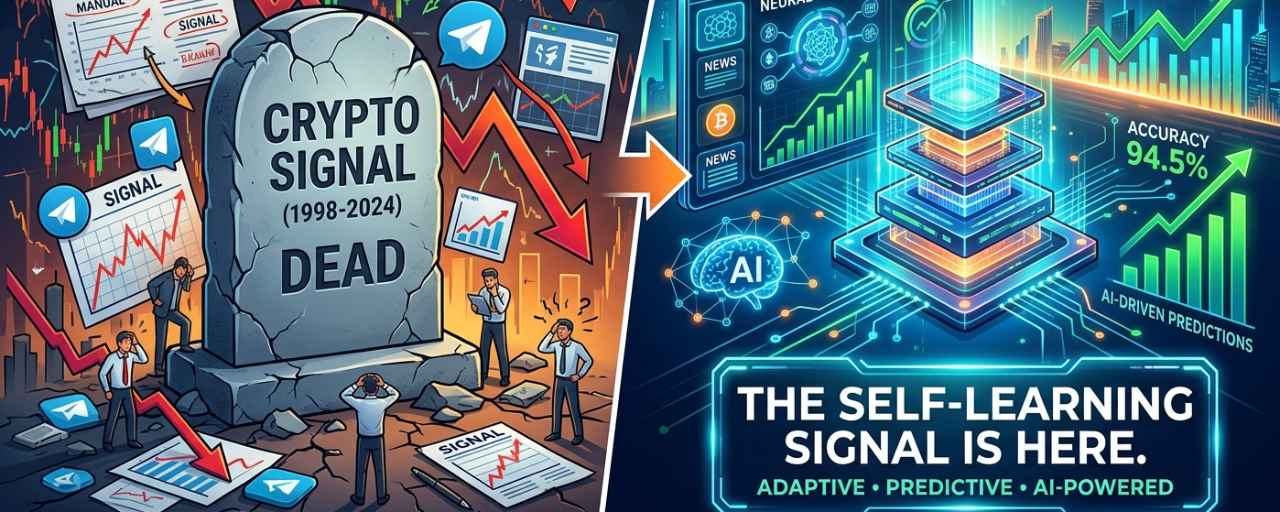
The Crypto Signal Is Dead. The Self-Learning Signal Is Here.For years, crypto trading has followed the same model.
A trader finds an #indicator .
A developer turns it into a #strategy .
The strategy generates a #SİGNAL .
And when the market changes?
The strategy stays the same.
That may be the biggest problem with traditional crypto signals.
Markets evolve.
But most signal systems don't.
So we decided to build something fundamentally different.
What if a trading system could learn from its own decisions?
Imagine a system that doesn't simply generate a signal and move on.
Instead, every signal becomes a lesson.
Every market condition becomes data.
Every outcome becomes feedback.
And every completed trade adds another piece to the system's understanding of the market.
That is the idea behind Crypto AI Pro.
This isn't just another crypto scanner.
A traditional scanner might look at:
RSI → MACD → EMA → Signal
Our approach is different.
The system looks at the market as a constantly changing environment.
It can analyze:
• $BTC market direction
• Multiple timeframes
• Trend structure
• Momentum
• Volatility
• EMA relationships
• RSI / MACD
• Market regime
• Coin-specific conditions
• Entry conditions
• Risk parameters
• Signal score
• And, most importantly, the eventual outcome
The system doesn't just ask:
“Can I open a trade?”
It asks:
“What is happening in the market, and does this setup make sense in this environment?”
🔄 The part that changes everything
Here's where the architecture becomes fundamentally different.
A signal is generated.
Then the market decides what happens next.
Maybe TP1 is reached.
Maybe the trade hits SL.
Maybe the market moves sideways.
Maybe the setup becomes invalid.
Whatever happens, the system can record the conditions that existed before the decision and the result that followed.
That creates a feedback loop:
Market Data → Signal → Outcome → Dataset → Learning → Better Selection
And then the cycle starts again.
This means the system isn't designed to remain frozen in time.
Its historical experience grows.
🧠 From rules to experience
Think about the difference between these two systems.
System A
“If RSI is below X, consider Long.”
Simple.
Predictable.
Static.
System B
“Under similar market conditions, with this BTC structure, this volatility regime, this trend alignment and these coin-specific characteristics, how have comparable setups historically performed?”
That's a completely different question.
And potentially a much more powerful one.
Because the system isn't looking at a single indicator.
It's looking for relationships between conditions and outcomes.
The Market Becomes the Teacher
This is the part we believe could change the way crypto signal systems are built.
Instead of developers constantly trying to guess which rules will work next month, the system can continuously collect new market examples.
The market produces the data.
The trades produce the outcomes.
The dataset grows.
And the model has more information to work with.
The market becomes the teacher.
📊 150+ Coins. One Decision Engine.
Crypto doesn't give traders a shortage of opportunities.
It gives them too many.
Hundreds of coins.
Thousands of possible setups.
Multiple timeframes.
Different market conditions.
Trying to manually process all of this is simply unrealistic.
Our system is designed to scan a large universe of cryptocurrencies and continuously search for opportunities.
But scanning more coins isn't the objective.
Finding better candidates is.
The system can rank opportunities instead of treating every setup equally.
Strong conditions move up.
Weak conditions move down.
Bad conditions can be rejected entirely.
And sometimes the best signal is:
No signal.
The Next Generation of Crypto Trading
We believe the next generation of trading systems won't simply be:
faster.
They will be:
more adaptive.
The difference is important.
A faster system can process more information.
An adaptive system can use historical information to improve how it evaluates new situations.
That's the direction we're building toward.
Not an AI that magically predicts the future.
That doesn't exist.
Not a machine that guarantees profits.
It doesn't exist either.
Instead:
A system that continuously collects evidence, evaluates outcomes and improves its decision-making process.
🚀 Why We Think This Matters
The crypto market has changed dramatically over the last few years.
More traders.
More algorithms.
More liquidity.
More assets.
More information.
And increasingly sophisticated market participants.
Using yesterday's rules to trade tomorrow's market isn't necessarily a competitive advantage.
The real advantage may come from building systems capable of learning from yesterday while adapting to tomorrow.
That's the bigger idea behind Crypto AI Pro.
We're not trying to build another signal generator.
We're building an evolving trading intelligence layer.
One that can observe.
Analyze.
Decide.
Measure.
Learn.
And repeat.
The Signal Was Never the Product.
The learning system is.
Every signal creates data.
Every result creates feedback.
Every new market condition creates another test.
And every cycle gives the system another opportunity to improve how it searches for the next setup.
This is still being developed.
Still being tested.
Still evolving.
But we believe this architecture represents a fundamentally different direction for crypto signal technology.
The future of crypto trading may not belong to systems that know the most rules.
It may belong to systems that learn the fastest. 🤖📈
The Crypto Signal Is Dead. The Self-Learning Signal Is Here.
For years, crypto trading has followed the same model.
A trader finds an #indicator .
A developer turns it into a #strategy .
The strategy generates a #SİGNAL .
And when the market changes?
The strategy stays the same.
That may be the biggest problem with traditional crypto signals.
Markets evolve.
But most signal systems don't.
So we decided to build something fundamentally different.
What if a trading system could learn from its own decisions?
Imagine a system that doesn't simply generate a signal and move on.
Instead, every signal becomes a lesson.
Every market condition becomes data.
Every outcome becomes feedback.
And every completed trade adds another piece to the system's understanding of the market.
That is the idea behind Crypto AI Pro.
This isn't just another crypto scanner.
A traditional scanner might look at:
RSI → MACD → EMA → Signal
Our approach is different.
The system looks at the market as a constantly changing environment.
It can analyze:
• $BTC market direction
• Multiple timeframes
• Trend structure
• Momentum
• Volatility
• EMA relationships
• RSI / MACD
• Market regime
• Coin-specific conditions
• Entry conditions
• Risk parameters
• Signal score
• And, most importantly, the eventual outcome
The system doesn't just ask:
“Can I open a trade?”
It asks:
“What is happening in the market, and does this setup make sense in this environment?”
🔄 The part that changes everything
Here's where the architecture becomes fundamentally different.
A signal is generated.
Then the market decides what happens next.
Maybe TP1 is reached.
Maybe the trade hits SL.
Maybe the market moves sideways.
Maybe the setup becomes invalid.
Whatever happens, the system can record the conditions that existed before the decision and the result that followed.
That creates a feedback loop:
Market Data → Signal → Outcome → Dataset → Learning → Better Selection
And then the cycle starts again.
This means the system isn't designed to remain frozen in time.
Its historical experience grows.
🧠 From rules to experience
Think about the difference between these two systems.
System A
“If RSI is below X, consider Long.”
Simple.
Predictable.
Static.
System B
“Under similar market conditions, with this BTC structure, this volatility regime, this trend alignment and these coin-specific characteristics, how have comparable setups historically performed?”
That's a completely different question.
And potentially a much more powerful one.
Because the system isn't looking at a single indicator.
It's looking for relationships between conditions and outcomes.
The Market Becomes the Teacher
This is the part we believe could change the way crypto signal systems are built.
Instead of developers constantly trying to guess which rules will work next month, the system can continuously collect new market examples.
The market produces the data.
The trades produce the outcomes.
The dataset grows.
And the model has more information to work with.
The market becomes the teacher.
📊 150+ Coins. One Decision Engine.
Crypto doesn't give traders a shortage of opportunities.
It gives them too many.
Hundreds of coins.
Thousands of possible setups.
Multiple timeframes.
Different market conditions.
Trying to manually process all of this is simply unrealistic.
Our system is designed to scan a large universe of cryptocurrencies and continuously search for opportunities.
But scanning more coins isn't the objective.
Finding better candidates is.
The system can rank opportunities instead of treating every setup equally.
Strong conditions move up.
Weak conditions move down.
Bad conditions can be rejected entirely.
And sometimes the best signal is:
No signal.
The Next Generation of Crypto Trading
We believe the next generation of trading systems won't simply be:
faster.
They will be:
more adaptive.
The difference is important.
A faster system can process more information.
An adaptive system can use historical information to improve how it evaluates new situations.
That's the direction we're building toward.
Not an AI that magically predicts the future.
That doesn't exist.
Not a machine that guarantees profits.
It doesn't exist either.
Instead:
A system that continuously collects evidence, evaluates outcomes and improves its decision-making process.
🚀 Why We Think This Matters
The crypto market has changed dramatically over the last few years.
More traders.
More algorithms.
More liquidity.
More assets.
More information.
And increasingly sophisticated market participants.
Using yesterday's rules to trade tomorrow's market isn't necessarily a competitive advantage.
The real advantage may come from building systems capable of learning from yesterday while adapting to tomorrow.
That's the bigger idea behind Crypto AI Pro.
We're not trying to build another signal generator.
We're building an evolving trading intelligence layer.
One that can observe.
Analyze.
Decide.
Measure.
Learn.
And repeat.
The Signal Was Never the Product.
The learning system is.
Every signal creates data.
Every result creates feedback.
Every new market condition creates another test.
And every cycle gives the system another opportunity to improve how it searches for the next setup.
This is still being developed.
Still being tested.
Still evolving.
But we believe this architecture represents a fundamentally different direction for crypto signal technology.
The future of crypto trading may not belong to systems that know the most rules.
It may belong to systems that learn the fastest. 🤖📈
A trader finds an #indicator .
A developer turns it into a #strategy .
The strategy generates a #SİGNAL .
And when the market changes?
The strategy stays the same.
That may be the biggest problem with traditional crypto signals.
Markets evolve.
But most signal systems don't.
So we decided to build something fundamentally different.
What if a trading system could learn from its own decisions?
Imagine a system that doesn't simply generate a signal and move on.
Instead, every signal becomes a lesson.
Every market condition becomes data.
Every outcome becomes feedback.
And every completed trade adds another piece to the system's understanding of the market.
That is the idea behind Crypto AI Pro.
This isn't just another crypto scanner.
A traditional scanner might look at:
RSI → MACD → EMA → Signal
Our approach is different.
The system looks at the market as a constantly changing environment.
It can analyze:
• $BTC market direction
• Multiple timeframes
• Trend structure
• Momentum
• Volatility
• EMA relationships
• RSI / MACD
• Market regime
• Coin-specific conditions
• Entry conditions
• Risk parameters
• Signal score
• And, most importantly, the eventual outcome
The system doesn't just ask:
“Can I open a trade?”
It asks:
“What is happening in the market, and does this setup make sense in this environment?”
🔄 The part that changes everything
Here's where the architecture becomes fundamentally different.
A signal is generated.
Then the market decides what happens next.
Maybe TP1 is reached.
Maybe the trade hits SL.
Maybe the market moves sideways.
Maybe the setup becomes invalid.
Whatever happens, the system can record the conditions that existed before the decision and the result that followed.
That creates a feedback loop:
Market Data → Signal → Outcome → Dataset → Learning → Better Selection
And then the cycle starts again.
This means the system isn't designed to remain frozen in time.
Its historical experience grows.
🧠 From rules to experience
Think about the difference between these two systems.
System A
“If RSI is below X, consider Long.”
Simple.
Predictable.
Static.
System B
“Under similar market conditions, with this BTC structure, this volatility regime, this trend alignment and these coin-specific characteristics, how have comparable setups historically performed?”
That's a completely different question.
And potentially a much more powerful one.
Because the system isn't looking at a single indicator.
It's looking for relationships between conditions and outcomes.
The Market Becomes the Teacher
This is the part we believe could change the way crypto signal systems are built.
Instead of developers constantly trying to guess which rules will work next month, the system can continuously collect new market examples.
The market produces the data.
The trades produce the outcomes.
The dataset grows.
And the model has more information to work with.
The market becomes the teacher.
📊 150+ Coins. One Decision Engine.
Crypto doesn't give traders a shortage of opportunities.
It gives them too many.
Hundreds of coins.
Thousands of possible setups.
Multiple timeframes.
Different market conditions.
Trying to manually process all of this is simply unrealistic.
Our system is designed to scan a large universe of cryptocurrencies and continuously search for opportunities.
But scanning more coins isn't the objective.
Finding better candidates is.
The system can rank opportunities instead of treating every setup equally.
Strong conditions move up.
Weak conditions move down.
Bad conditions can be rejected entirely.
And sometimes the best signal is:
No signal.
The Next Generation of Crypto Trading
We believe the next generation of trading systems won't simply be:
faster.
They will be:
more adaptive.
The difference is important.
A faster system can process more information.
An adaptive system can use historical information to improve how it evaluates new situations.
That's the direction we're building toward.
Not an AI that magically predicts the future.
That doesn't exist.
Not a machine that guarantees profits.
It doesn't exist either.
Instead:
A system that continuously collects evidence, evaluates outcomes and improves its decision-making process.
🚀 Why We Think This Matters
The crypto market has changed dramatically over the last few years.
More traders.
More algorithms.
More liquidity.
More assets.
More information.
And increasingly sophisticated market participants.
Using yesterday's rules to trade tomorrow's market isn't necessarily a competitive advantage.
The real advantage may come from building systems capable of learning from yesterday while adapting to tomorrow.
That's the bigger idea behind Crypto AI Pro.
We're not trying to build another signal generator.
We're building an evolving trading intelligence layer.
One that can observe.
Analyze.
Decide.
Measure.
Learn.
And repeat.
The Signal Was Never the Product.
The learning system is.
Every signal creates data.
Every result creates feedback.
Every new market condition creates another test.
And every cycle gives the system another opportunity to improve how it searches for the next setup.
This is still being developed.
Still being tested.
Still evolving.
But we believe this architecture represents a fundamentally different direction for crypto signal technology.
The future of crypto trading may not belong to systems that know the most rules.
It may belong to systems that learn the fastest. 🤖📈
1
56
·
--
Lots of tests, lots of thinking, never stop trying and i think i managed to have my #indicator for the best possible signal.
#crypto $ACE
Lots of tests, lots of thinking, never stop trying and i think i managed to have my #indicator for the best possible signal.
#crypto $ACE
#crypto $ACE
146

·
--
Bullish
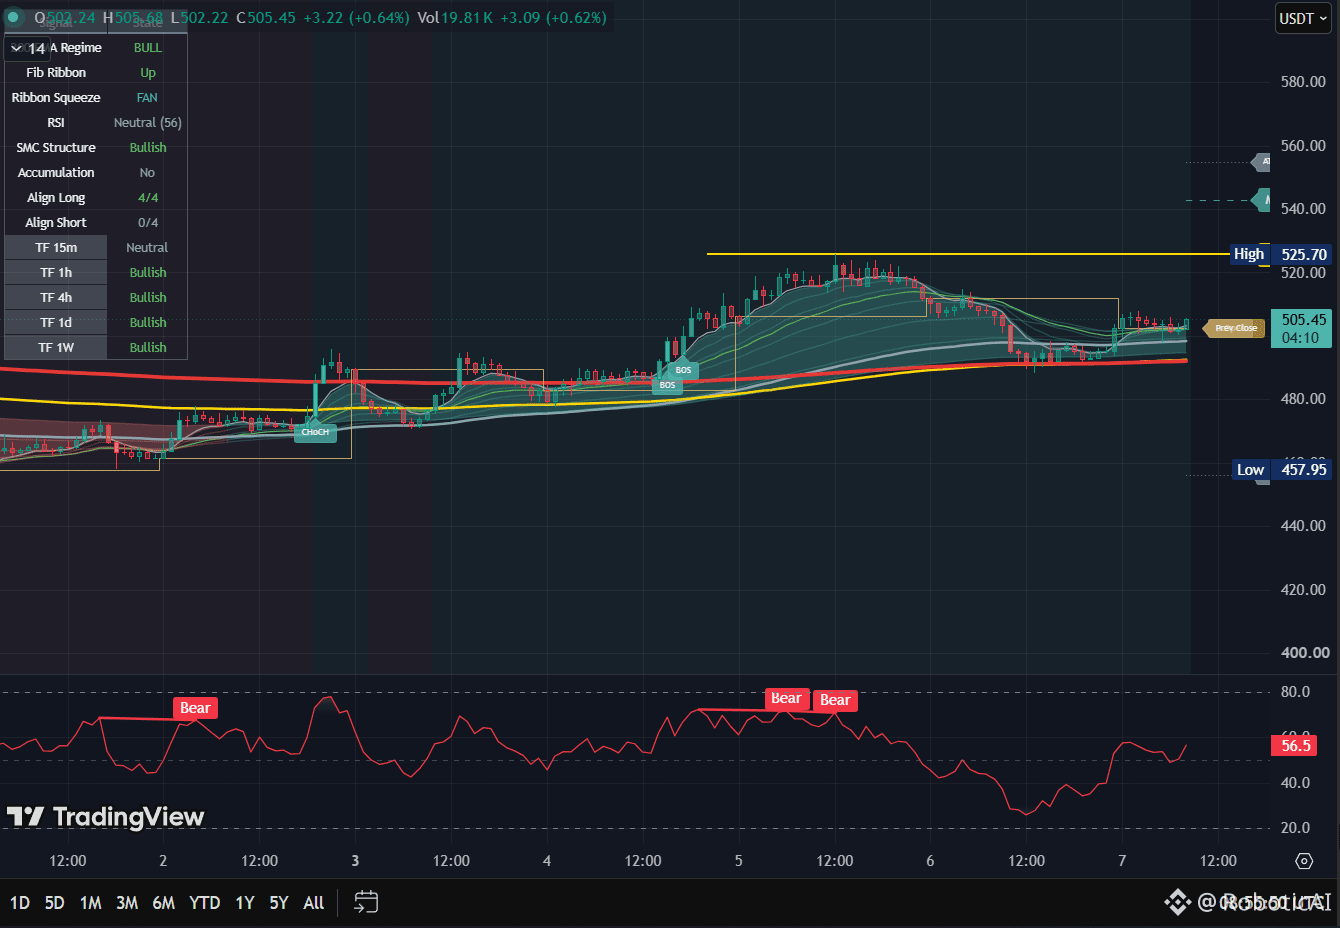
only #BTC trader indicator follow for each trade $BTC follow me for next trade setup #BTCtrade #indicator
only #BTC trader indicator follow for each trade $BTC follow me for next trade setup #BTCtrade #indicator
34

·
--
Bearish
$ADA
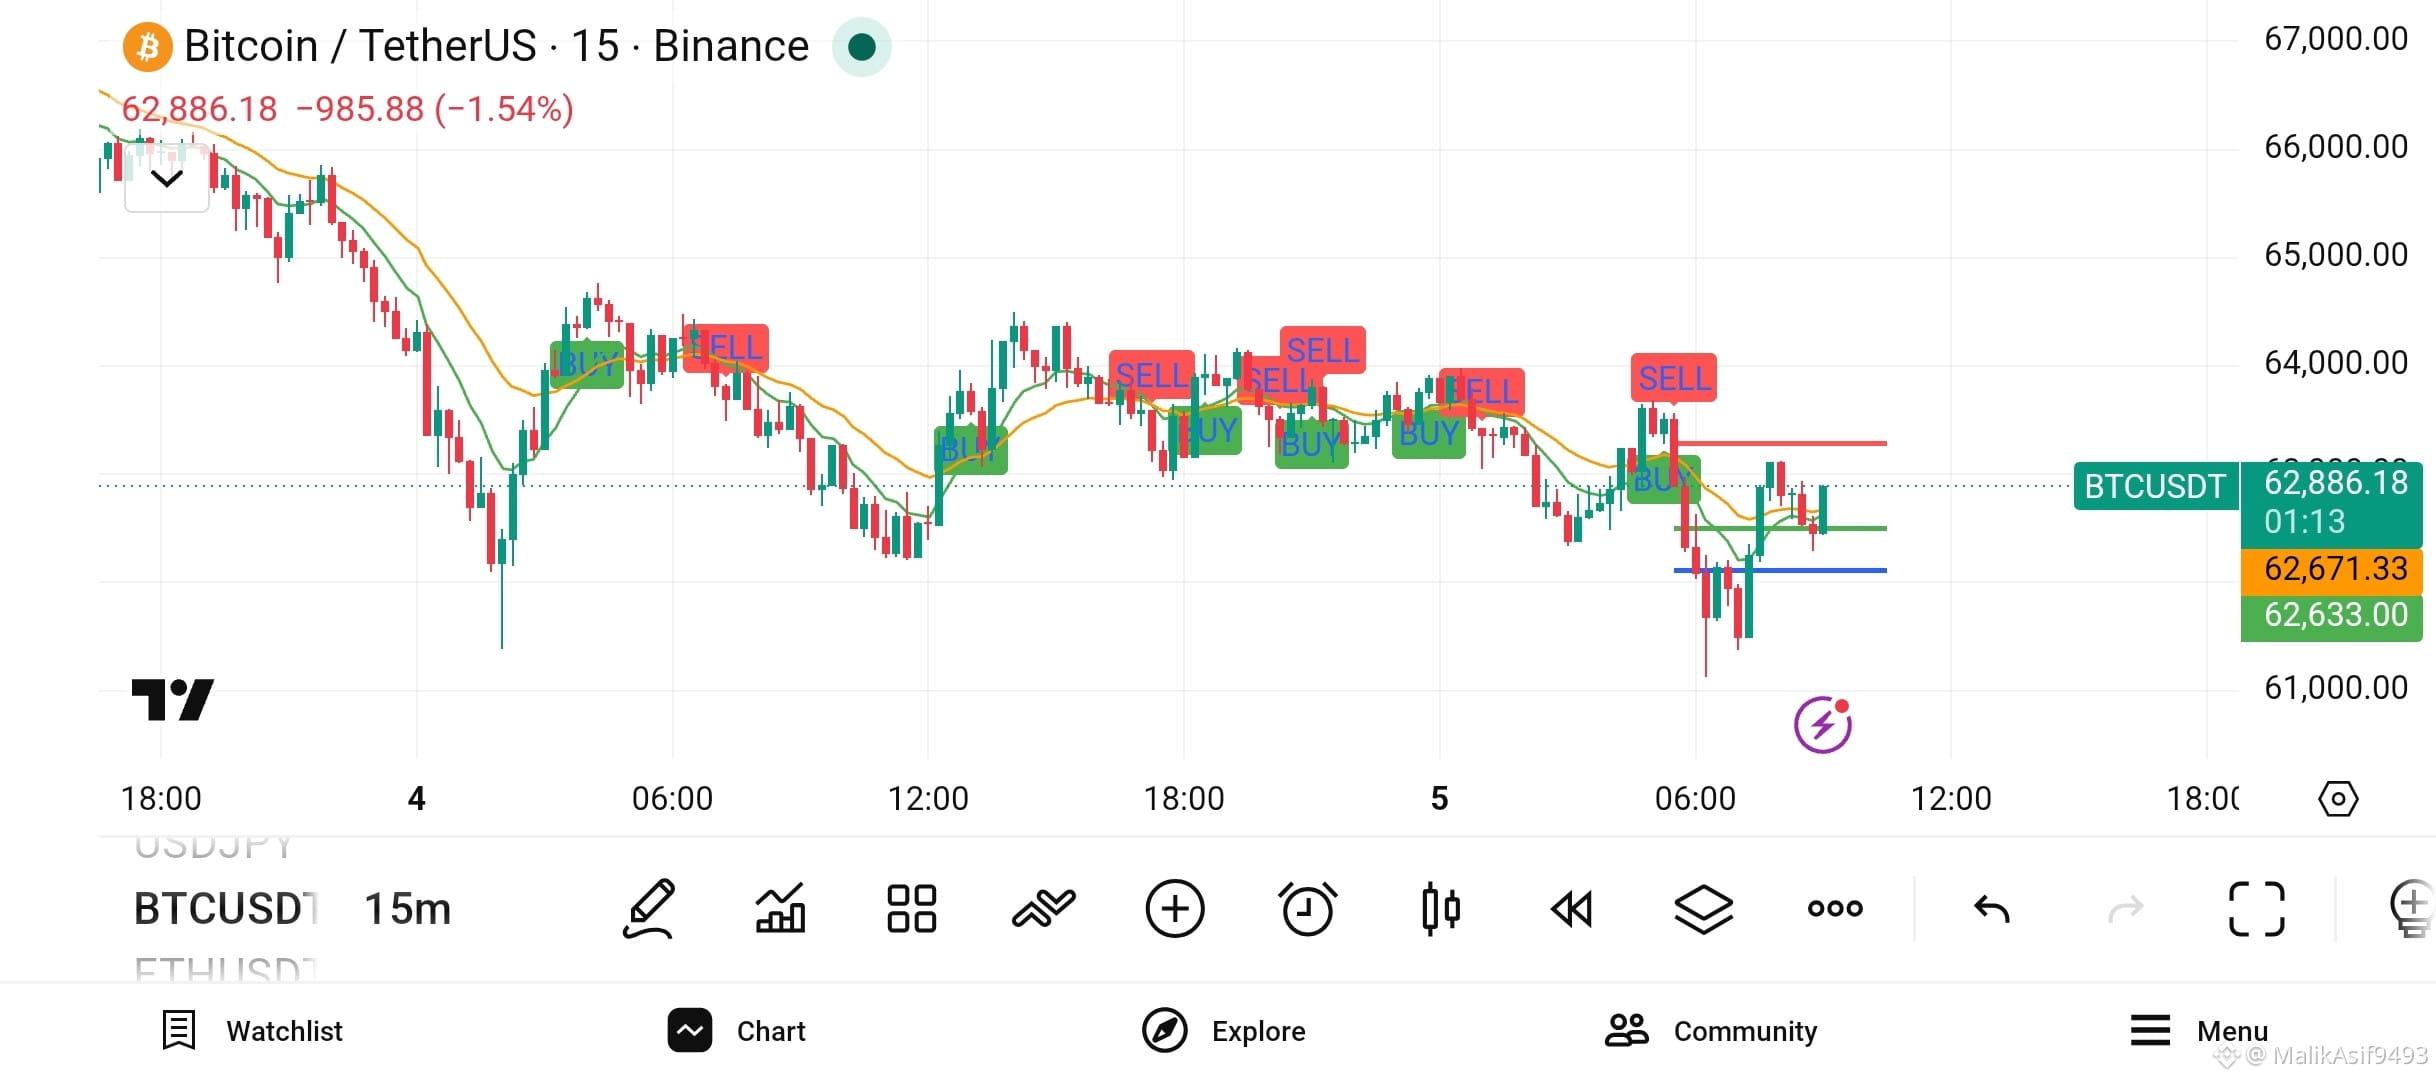
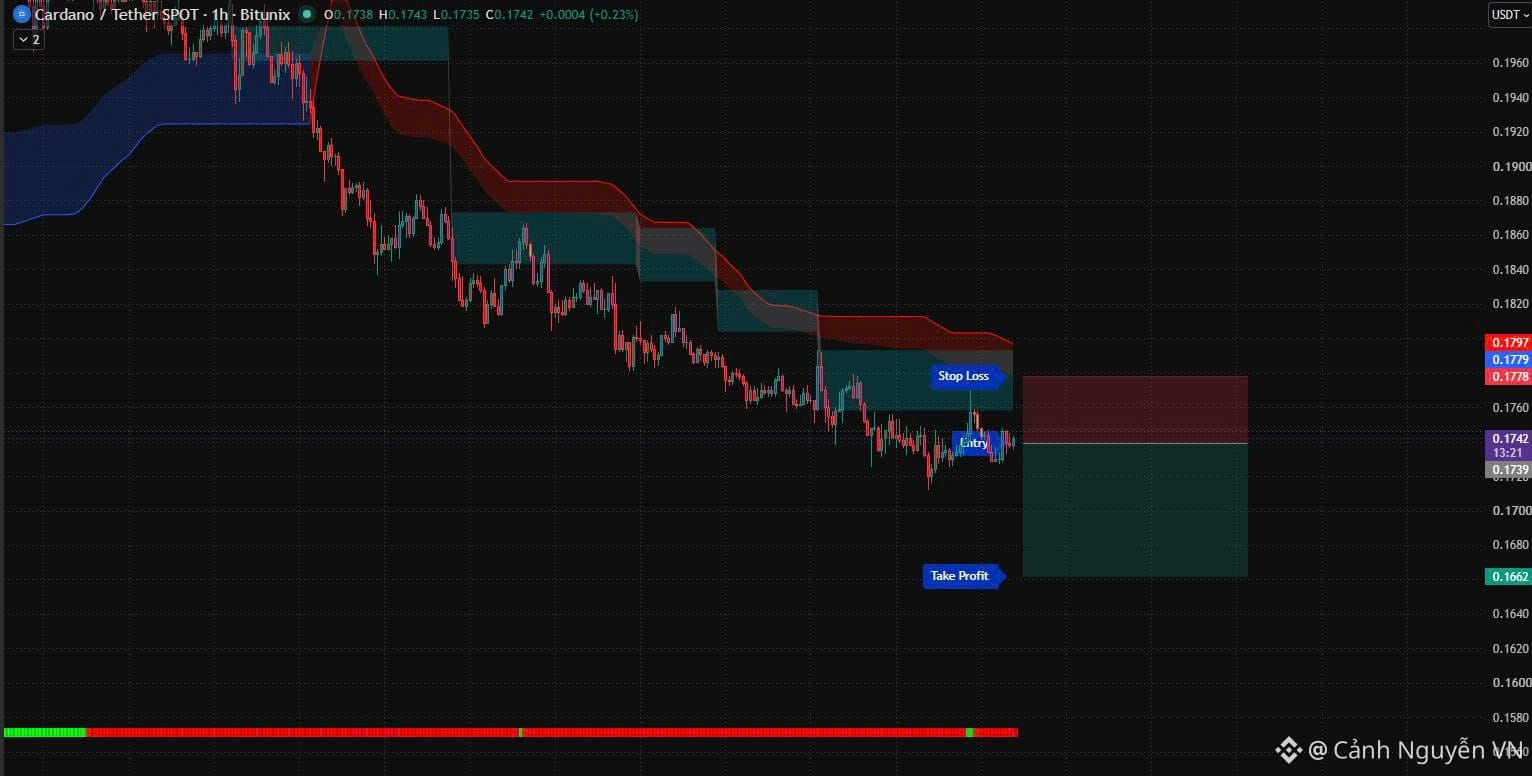
🔎 1. Overview information on the chart
Trading pair: Cardano / Tether · 1h ·
Current price level: The price is fluctuating around 0.1742 USDT (the green candle shows a countdown of 13 minutes 21 seconds until the 1-hour candle closes).
Main trend (Trend): The prevailing trend beforehand was a clear downtrend. The price repeatedly forms peaks that are lower than the previous peak and troughs that are lower than the previous trough, moving downward below the red/blue indicator bands.
📊 2. Trade order setup (Short Order)
ENTRY: 0.1742
STOP: 0.1779
TP: 0.1662
📉 3. Strategy evaluation
Trend alignment: This Short order is assessed as aligning with the overall market’s downtrend in order to optimize the probability of winning.
#TheoDõiFOMC #45NgayTuDoTaiChinh #45DayTarget #signal&overlay indicator#indicator
$ADA
🔎 1. Overview information on the chart
Trading pair: Cardano / Tether · 1h ·
Current price level: The price is fluctuating around 0.1742 USDT (the green candle shows a countdown of 13 minutes 21 seconds until the 1-hour candle closes).
Main trend (Trend): The prevailing trend beforehand was a clear downtrend. The price repeatedly forms peaks that are lower than the previous peak and troughs that are lower than the previous trough, moving downward below the red/blue indicator bands.
📊 2. Trade order setup (Short Order)
ENTRY: 0.1742
STOP: 0.1779
TP: 0.1662
📉 3. Strategy evaluation
Trend alignment: This Short order is assessed as aligning with the overall market’s downtrend in order to optimize the probability of winning.
#TheoDõiFOMC #45NgayTuDoTaiChinh #45DayTarget #signal&overlay indicator#indicator
🔎 1. Overview information on the chart
Trading pair: Cardano / Tether · 1h ·
Current price level: The price is fluctuating around 0.1742 USDT (the green candle shows a countdown of 13 minutes 21 seconds until the 1-hour candle closes).
Main trend (Trend): The prevailing trend beforehand was a clear downtrend. The price repeatedly forms peaks that are lower than the previous peak and troughs that are lower than the previous trough, moving downward below the red/blue indicator bands.
📊 2. Trade order setup (Short Order)
ENTRY: 0.1742
STOP: 0.1779
TP: 0.1662
📉 3. Strategy evaluation
Trend alignment: This Short order is assessed as aligning with the overall market’s downtrend in order to optimize the probability of winning.
#TheoDõiFOMC #45NgayTuDoTaiChinh #45DayTarget #signal&overlay indicator#indicator
4
119

Technical Analysis
Moving Average Structure
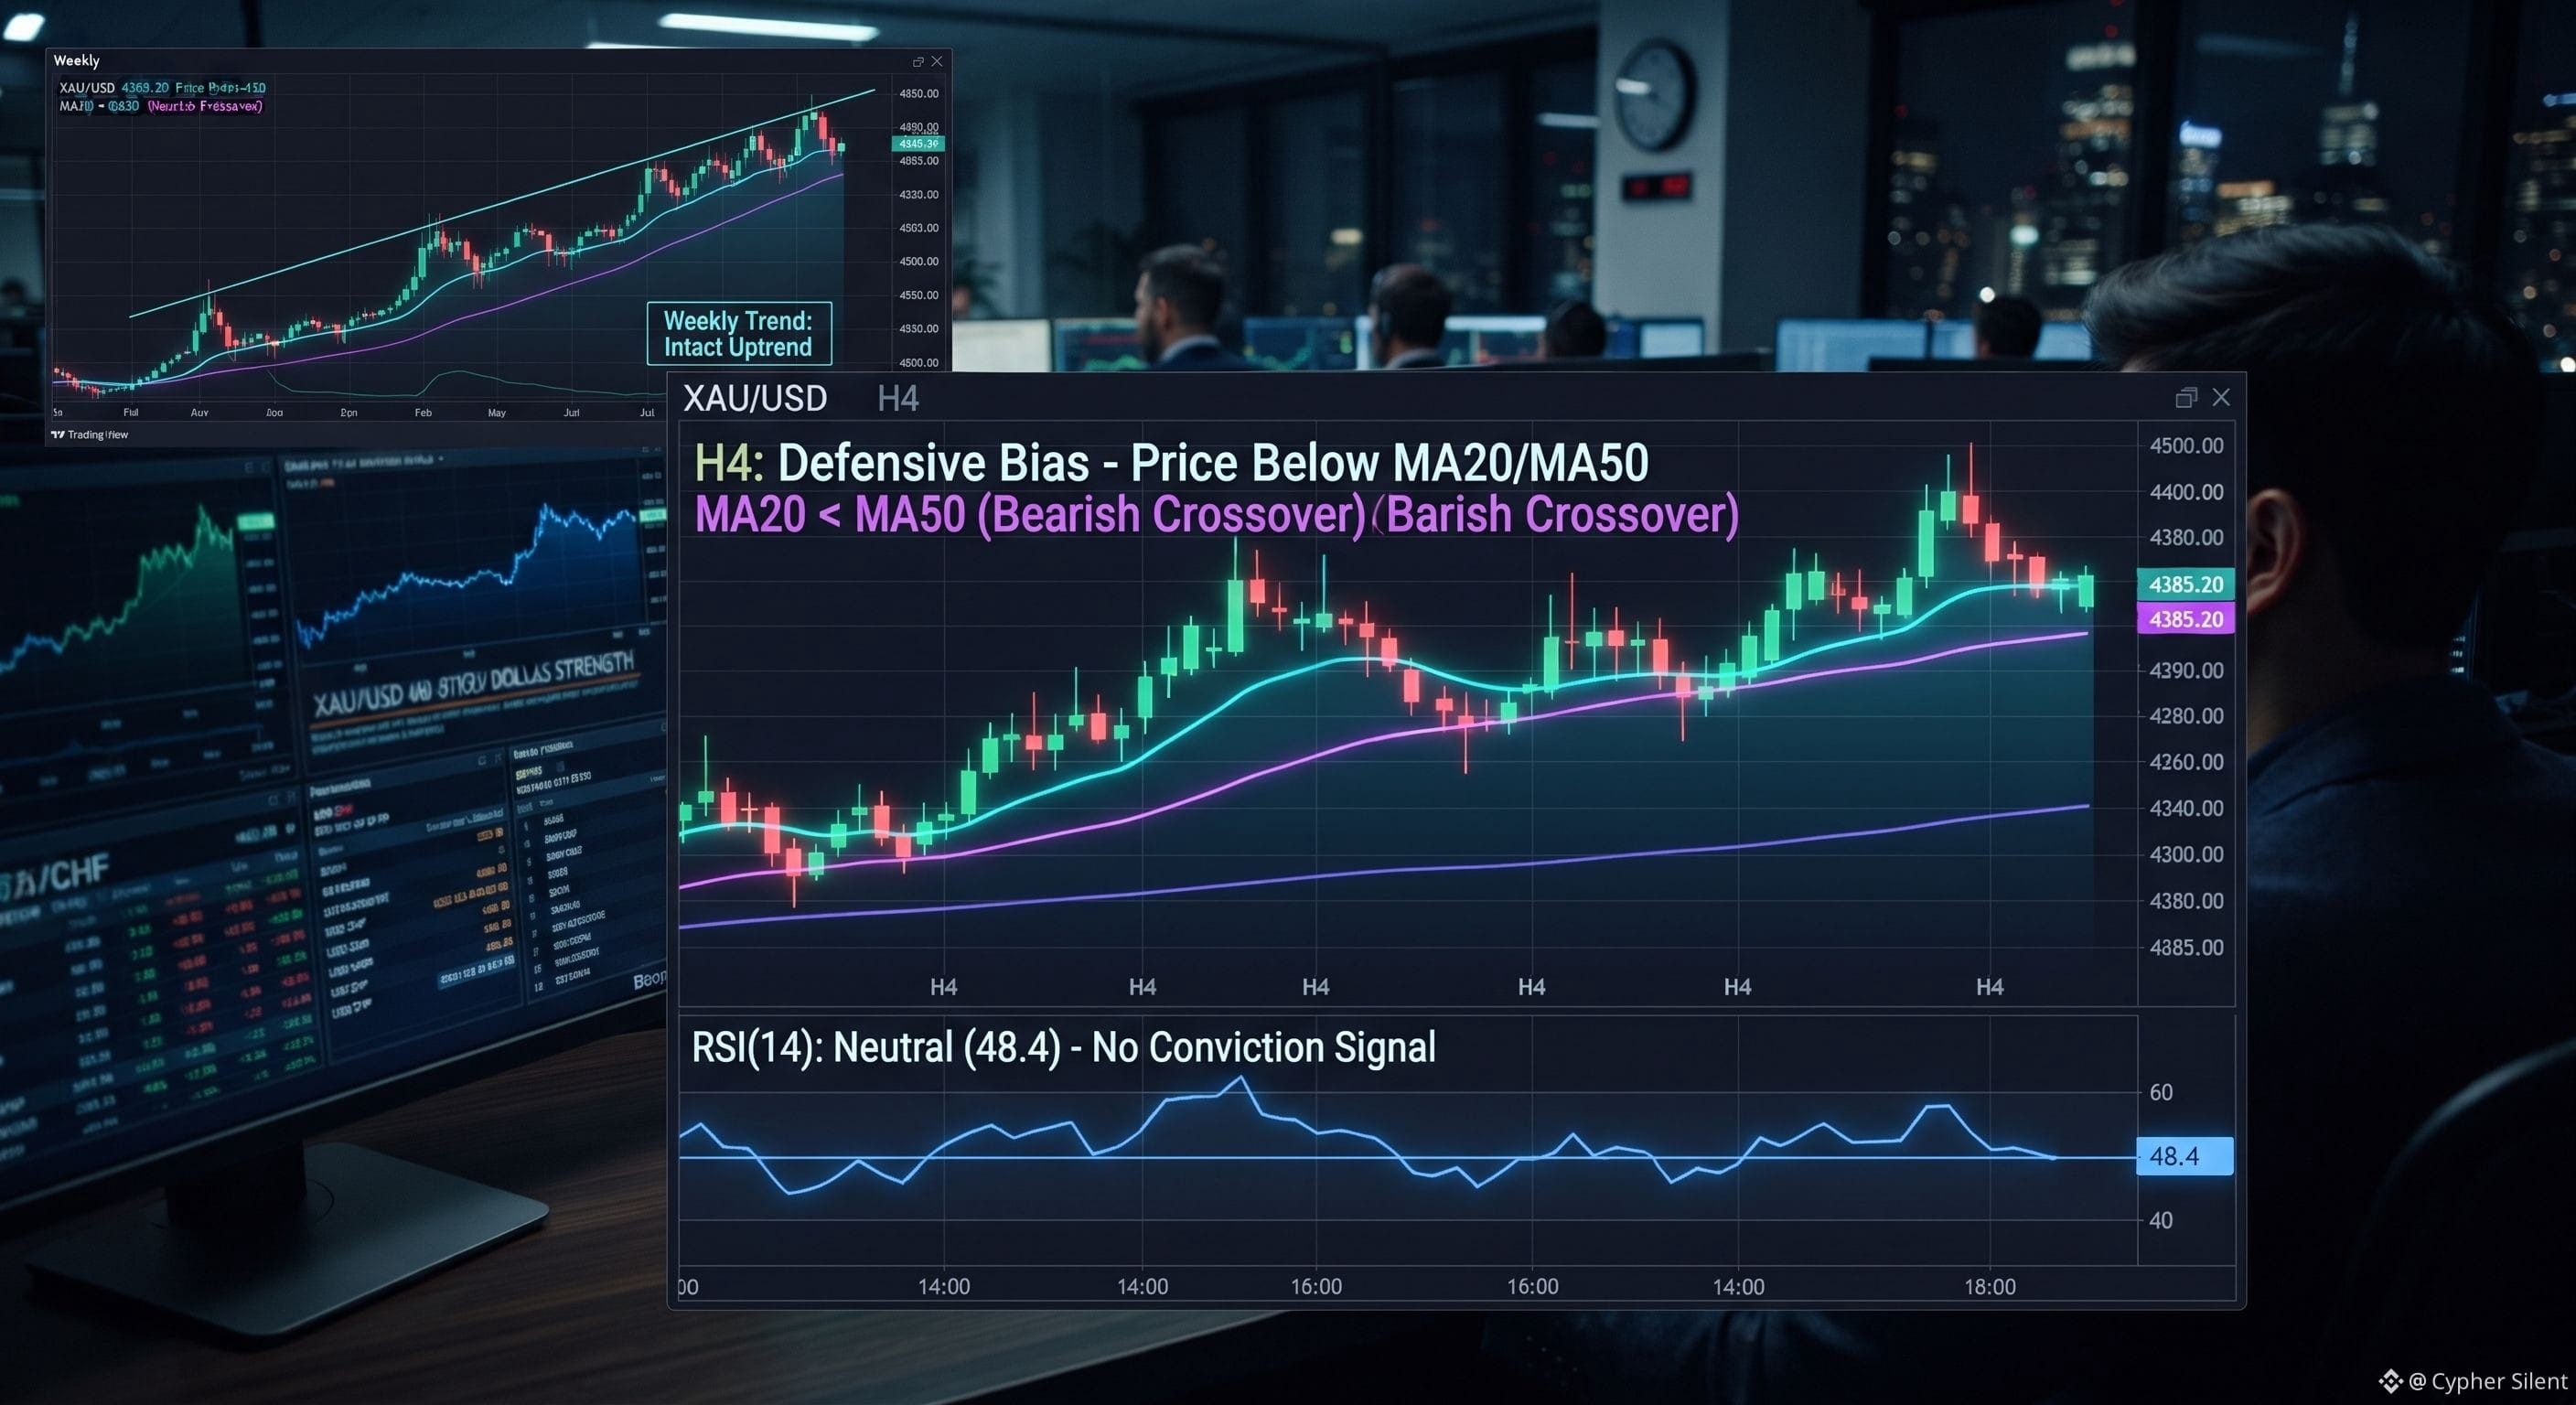
The H4 chart shows the gold price below its short-duration moving averages, which keeps the near-term bias defensive. The MA20 and MA50 are now acting as dynamic resistance above spot. Until #XAU/USD can reclaim that cluster, rallies are likely to get sold.
The EMA structure reinforces this view. When the MA20 sits below the MA50, short-term momentum is still working against buyers. This does not guarantee a deeper sell-off, but it does mean every bounce has to prove itself.
On higher timeframes, the picture is more constructive. The weekly trend remains intact, so longer-term investors may view dips as opportunities rather than reasons to panic. The key is knowing which timeframe you are trading.
{future}(XAUUSDT)
#RSI and #momentum
The RSI(14) on the H4 chart is hovering near the middle of its range. That leaves room for the gold price to move in either direction without being overbought or oversold. It also means the indicator is not yet flashing a high-conviction reversal signal.
Momentum traders should watch for RSI to break above 50 alongside a price reclaim of the moving average cluster. If RSI stays below 50 while price retests resistance, the bounce may be short-lived. A combined move in both would carry more weight.
Conversely, an RSI drop toward 40 or lower would suggest sellers are gaining control. That could trigger a move toward the next meaningful support area. The #indicator becomes more useful when it aligns with price action, not when it is used in isolation. #EthereumFoundationDropsPoseidonForL1
Technical Analysis
Moving Average Structure
The H4 chart shows the gold price below its short-duration moving averages, which keeps the near-term bias defensive. The MA20 and MA50 are now acting as dynamic resistance above spot. Until #XAU/USD can reclaim that cluster, rallies are likely to get sold.
The EMA structure reinforces this view. When the MA20 sits below the MA50, short-term momentum is still working against buyers. This does not guarantee a deeper sell-off, but it does mean every bounce has to prove itself.
On higher timeframes, the picture is more constructive. The weekly trend remains intact, so longer-term investors may view dips as opportunities rather than reasons to panic. The key is knowing which timeframe you are trading.
#RSI and #momentum
The RSI(14) on the H4 chart is hovering near the middle of its range. That leaves room for the gold price to move in either direction without being overbought or oversold. It also means the indicator is not yet flashing a high-conviction reversal signal.
Momentum traders should watch for RSI to break above 50 alongside a price reclaim of the moving average cluster. If RSI stays below 50 while price retests resistance, the bounce may be short-lived. A combined move in both would carry more weight.
Conversely, an RSI drop toward 40 or lower would suggest sellers are gaining control. That could trigger a move toward the next meaningful support area. The #indicator becomes more useful when it aligns with price action, not when it is used in isolation. #EthereumFoundationDropsPoseidonForL1
Moving Average Structure
The H4 chart shows the gold price below its short-duration moving averages, which keeps the near-term bias defensive. The MA20 and MA50 are now acting as dynamic resistance above spot. Until #XAU/USD can reclaim that cluster, rallies are likely to get sold.
The EMA structure reinforces this view. When the MA20 sits below the MA50, short-term momentum is still working against buyers. This does not guarantee a deeper sell-off, but it does mean every bounce has to prove itself.
On higher timeframes, the picture is more constructive. The weekly trend remains intact, so longer-term investors may view dips as opportunities rather than reasons to panic. The key is knowing which timeframe you are trading.
#RSI and #momentum
The RSI(14) on the H4 chart is hovering near the middle of its range. That leaves room for the gold price to move in either direction without being overbought or oversold. It also means the indicator is not yet flashing a high-conviction reversal signal.
Momentum traders should watch for RSI to break above 50 alongside a price reclaim of the moving average cluster. If RSI stays below 50 while price retests resistance, the bounce may be short-lived. A combined move in both would carry more weight.
Conversely, an RSI drop toward 40 or lower would suggest sellers are gaining control. That could trigger a move toward the next meaningful support area. The #indicator becomes more useful when it aligns with price action, not when it is used in isolation. #EthereumFoundationDropsPoseidonForL1
1
1
126

·
--
Article
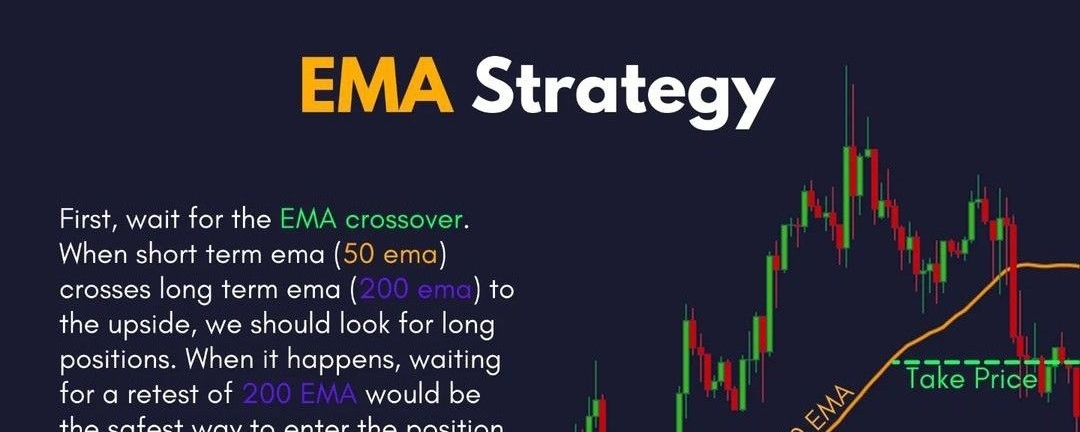
EMA CROSSOVER = FREE MONEY MOMENTWhen the 50 EMA rips above the 200 EMA, that’s your cue. Wait forthe retest, load the position, protect with a tight stop, and let the trend do the heavy lifting.$BNB #indicator
EMA CROSSOVER = FREE MONEY MOMENT
When the 50 EMA rips above the 200 EMA, that’s your cue. Wait forthe retest, load the position, protect with a tight stop, and let the trend do the heavy lifting.$BNB #indicator
94

164

·
--
Article
241
·
--
Article
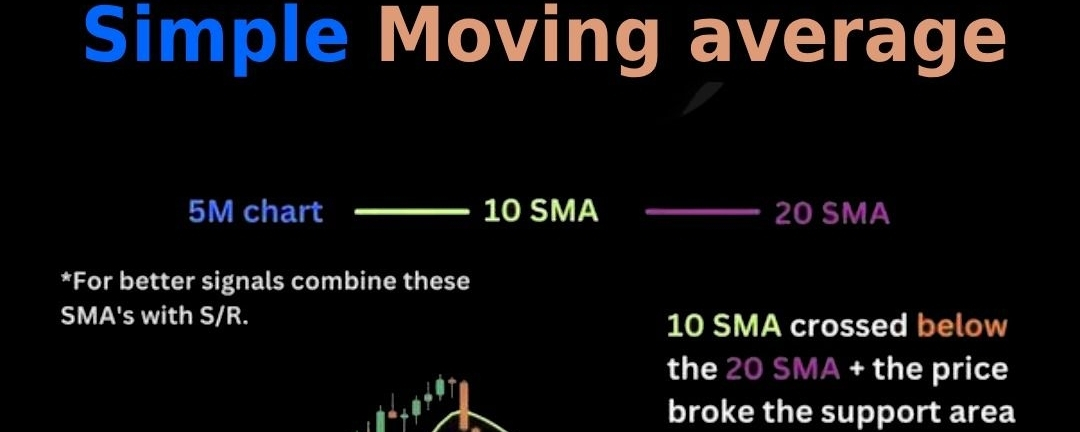
THE SMA CROSSOVER THAT PRINTS MONEYWhen the 10 SMA slices through the
20, the market isn’t whispering, it’s
screaming direction. Combine it
with S/R and you stop guessing,
start sniping.$BTC #indicator
THE SMA CROSSOVER THAT PRINTS MONEY
When the 10 SMA slices through the
20, the market isn’t whispering, it’s
screaming direction. Combine it
with S/R and you stop guessing,
start sniping.$BTC #indicator
20, the market isn’t whispering, it’s
screaming direction. Combine it
with S/R and you stop guessing,
start sniping.$BTC #indicator
1
76
·
--
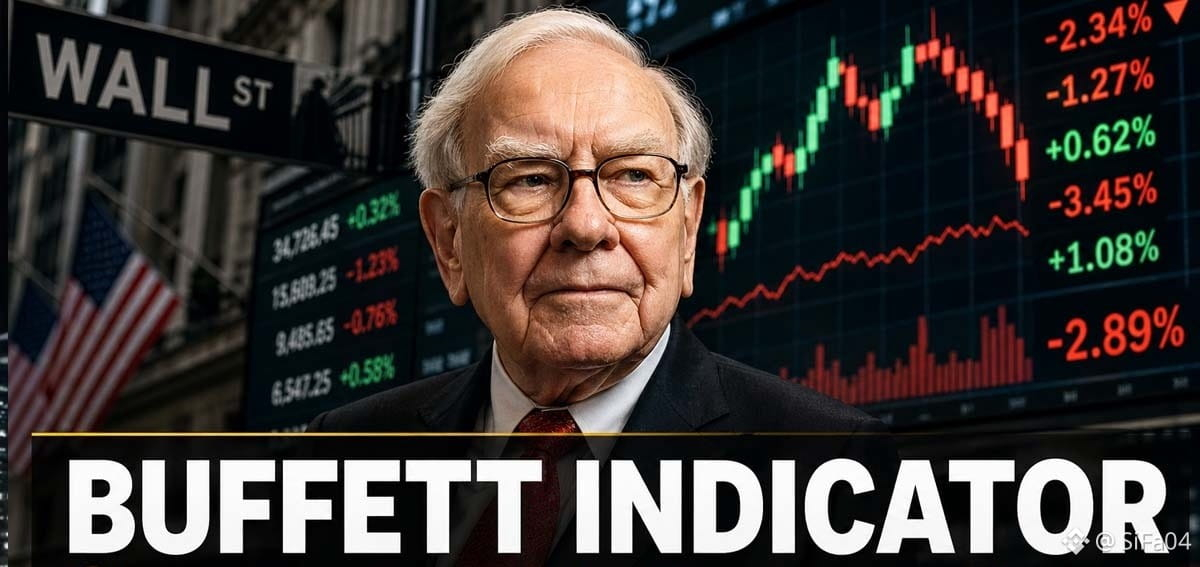
⚡ IS THE BUFFETT INDICATOR BROKEN? WHY THE 'BUBBLE THERMOMETER' IS NO LONGER FUNCTIONING ⚡
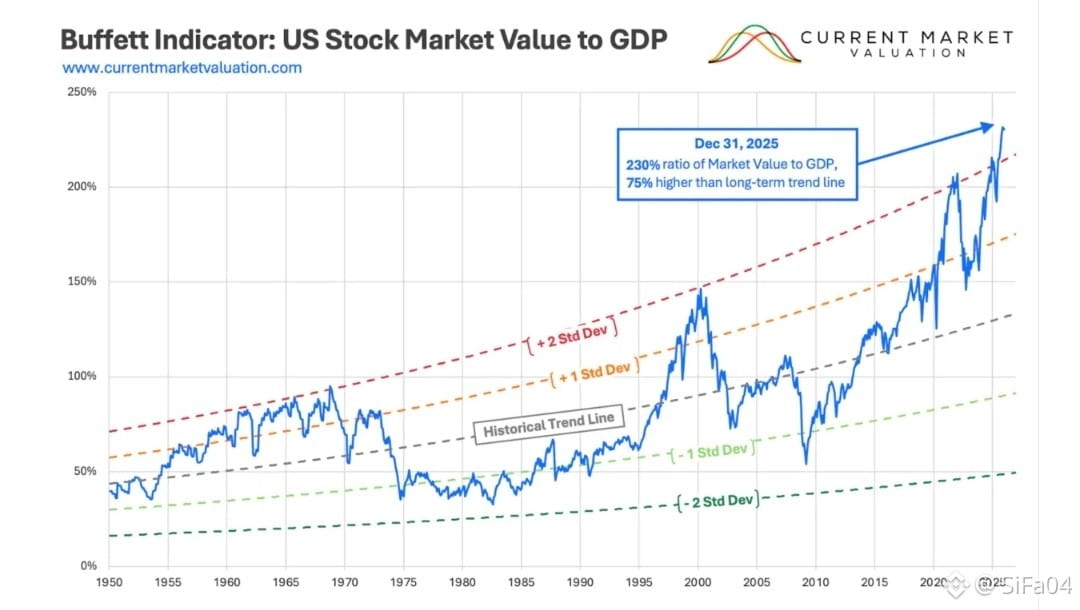
The famous Buffett Indicator has hit 230%, a historic high, causing many to talk about the biggest bubble ever. But there’s a catch: this indicator was designed for an economy that no longer exists.
The first limitation is structural: it compares the global market cap of US companies to a GDP that only measures the domestic economy.
Today, giants like Apple and Nvidia generate a substantial portion of their revenues overseas, inflating the numerator without reflecting it in the denominator.
Moreover, Buffett used GNP, not GDP. GNP includes the global profits of American companies, while GDP does not.
This shift completely alters historical thresholds.
Then there’s the topic of the digital economy: services like Google, YouTube, or WhatsApp create enormous value but have little impact on GDP.
The same goes for AI, software, and intangible assets, which are difficult to measure.
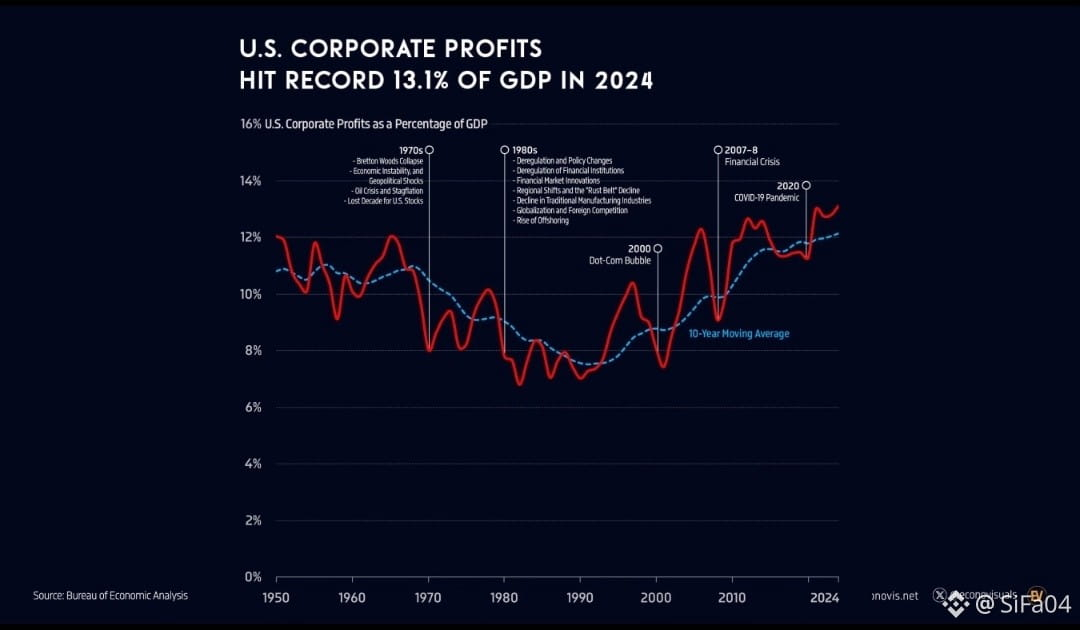
Corporate profits have also changed: they now hover around 14% of GDP, compared to a historical average of 7-8%.
A higher level justifies elevated valuations.
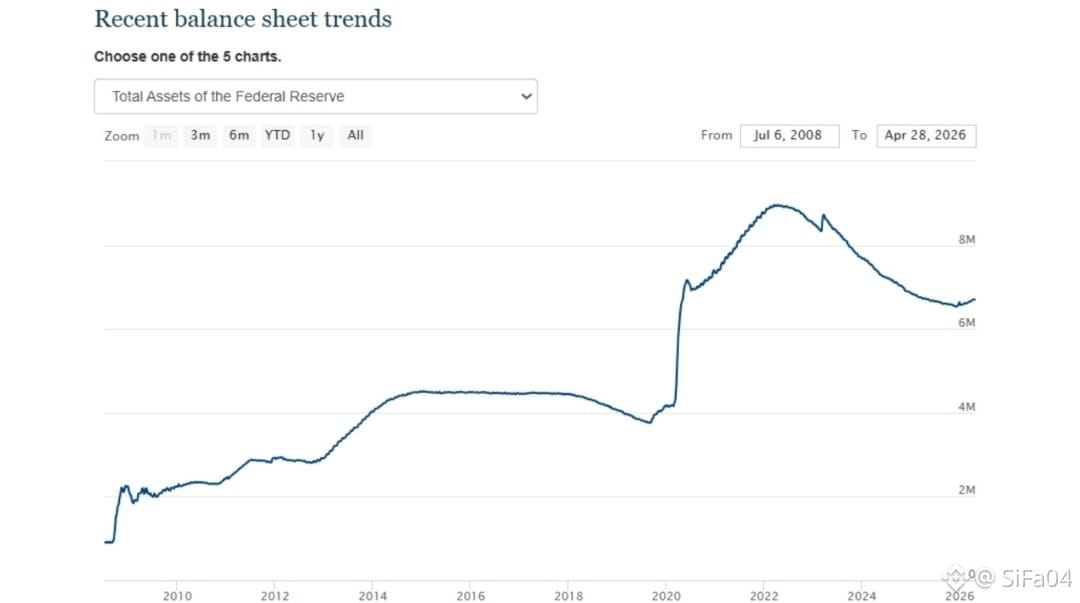
Finally, Fed liquidity and globalization have distorted the relationship. It’s no coincidence that the indicator has signaled “bubble” since 2013, while the market has tripled.
This doesn’t mean that markets are safe.
But rather that one of the most used indicators may no longer be suited for the modern world.
#BREAKING #WarrenBuffett #indicator #market
⚡ IS THE BUFFETT INDICATOR BROKEN? WHY THE 'BUBBLE THERMOMETER' IS NO LONGER FUNCTIONING ⚡
The famous Buffett Indicator has hit 230%, a historic high, causing many to talk about the biggest bubble ever. But there’s a catch: this indicator was designed for an economy that no longer exists.
The first limitation is structural: it compares the global market cap of US companies to a GDP that only measures the domestic economy.
Today, giants like Apple and Nvidia generate a substantial portion of their revenues overseas, inflating the numerator without reflecting it in the denominator.
Moreover, Buffett used GNP, not GDP. GNP includes the global profits of American companies, while GDP does not.
This shift completely alters historical thresholds.
Then there’s the topic of the digital economy: services like Google, YouTube, or WhatsApp create enormous value but have little impact on GDP.
The same goes for AI, software, and intangible assets, which are difficult to measure.
Corporate profits have also changed: they now hover around 14% of GDP, compared to a historical average of 7-8%.
A higher level justifies elevated valuations.
Finally, Fed liquidity and globalization have distorted the relationship. It’s no coincidence that the indicator has signaled “bubble” since 2013, while the market has tripled.
This doesn’t mean that markets are safe.
But rather that one of the most used indicators may no longer be suited for the modern world.
#BREAKING #WarrenBuffett #indicator #market
The famous Buffett Indicator has hit 230%, a historic high, causing many to talk about the biggest bubble ever. But there’s a catch: this indicator was designed for an economy that no longer exists.
The first limitation is structural: it compares the global market cap of US companies to a GDP that only measures the domestic economy.
Today, giants like Apple and Nvidia generate a substantial portion of their revenues overseas, inflating the numerator without reflecting it in the denominator.
Moreover, Buffett used GNP, not GDP. GNP includes the global profits of American companies, while GDP does not.
This shift completely alters historical thresholds.
Then there’s the topic of the digital economy: services like Google, YouTube, or WhatsApp create enormous value but have little impact on GDP.
The same goes for AI, software, and intangible assets, which are difficult to measure.
Corporate profits have also changed: they now hover around 14% of GDP, compared to a historical average of 7-8%.
A higher level justifies elevated valuations.
Finally, Fed liquidity and globalization have distorted the relationship. It’s no coincidence that the indicator has signaled “bubble” since 2013, while the market has tripled.
This doesn’t mean that markets are safe.
But rather that one of the most used indicators may no longer be suited for the modern world.
#BREAKING #WarrenBuffett #indicator #market
2
927

·
--

Article
Understanding Open Interest in Crypto Trading: A Guide to Profitable StrategiesOpen Interest (OI) is a critical but often underutilized metric in the world of #CryptoTrading. This #guide will help you understand what #Openinterest is, how to use it effectively, and how to combine it with other trading instruments to enhance your trading strategy and boost profitability.
What is Open Interest?
Open Interest represents the total number of outstanding derivative contracts, such as futures or options, that are currently open and active. It’s a measure of the flow of money into the futures market and an #Indicator of market #Sentiments and liquidity.
Why is Open Interest Important?
Market Sentiment: Increasing OI suggests new money is flowing into the market, indicating a potential continuation of the current trend. Conversely, decreasing OI suggests money is leaving the market, which could signal a trend reversal.Liquidity: High OI indicates a liquid market where it is easier to enter and exit positions without significant slippage.Confirmation Tool: OI can be used to confirm trends. For instance, a price increase accompanied by rising OI suggests a strong bullish trend.
How to Use Open Interest in Crypto Trading
To effectively incorporate OI into your trading strategy, it’s essential to combine it with other instruments and indicators. Here are some practical strategies:
1. Combining OI with Price Action
Trend Confirmation: Use OI to confirm price trends. If prices are rising and OI is increasing, it suggests that the upward trend is strong and likely to continue. Conversely, if prices are rising but OI is falling, it may indicate that the trend is weakening.Divergence Analysis: Look for divergences between price and OI. For example, if the price of a cryptocurrency is rising but OI is decreasing, it could be a warning sign that the bullish trend is losing momentum.
2. OI and Volume Analysis
Volume Confirmation: High trading volume alongside increasing OI can confirm the strength of a price movement. Conversely, if volume is high but OI is decreasing, it might indicate short-term speculation rather than a strong trend.Volume Spikes: Sudden spikes in volume accompanied by rising OI can signal the beginning of a new trend or the end of a consolidation phase.
3. OI and Volatility
Volatility Analysis: Track changes in OI along with volatility measures like the Bollinger Bands or the Average True Range (ATR). Rising OI in a low volatility environment might signal a breakout, while high volatility with increasing OI can indicate a strong trending market.Volatility Breakouts: Use OI to identify potential breakouts. A sudden increase in OI during a period of low volatility might precede a significant price move.
4. OI and Sentiment Indicators
Market Sentiment: Combine OI with sentiment indicators like the Fear and Greed Index or social media sentiment analysis to gauge the overall mood of the market. High OI during extreme greed could indicate a potential bubble, while high OI during extreme fear might present a buying opportunity.Contrarian Signals: Use OI to identify contrarian trading opportunities. For example, if OI is rising significantly in a bearish market, it might indicate that a bottom is forming.
Practical Example: $RSR
{spot}(RSRUSDT)
Trade Analysis
Let's delve into a practical example to illustrate how Open Interest can be used effectively in trading decisions. The following images and analysis provide a detailed look into an RSR/USDT trade.
Example Breakdown:
Step 1: Identifying Key Levels on Higher Timeframe
The 4-hour chart of RSR/USDT shows a significant support level that was broken down. This breakdown indicated a potential change in trend direction from bullish to bearish.
Step 2: ERKEScan Alert
ERKEScan triggered an alert for a significant increase in Open Interest (OI Change 1h: 5.231). This alert indicates a substantial number of new positions being opened, suggesting strong market activity.
Step 3: Zooming into Smaller Timeframes
Moving into a smaller timeframe , we see that the price popped right into the newly formed resistance zone from the 4-hour breakdown level. This movement provided an ideal entry point for a short trade.
The chart shows the significant spike in price followed by a quick reversal, confirming the resistance level's strength. Many positions were placed at this level, providing a high-probability trade setup.
Trade Execution
Based on the higher timeframe analysis and the confirmation from the OI spike, we could enter a short trade on RSR at the resistance level. The trade benefits from the confirmation of increased OI and the price action aligning with our higher timeframe analysis.
Using ERKEScan's Top10 Leaderboard to Filter Fake Signals
To avoid being misled by fake OI signals, you can use ERKEScan's Top10 leaderboard feature. This tool shows the top 10 tokens with the highest Open Interest increases, allowing you to filter out any anomalies or false signals. By focusing on the tokens with the most significant OI changes, you can make more informed trading decisions and enhance your strategy's effectiveness.
Conclusion
Open Interest is a powerful tool that, when used correctly, can provide valuable insights into market sentiment, liquidity, and potential price movements. By combining OI with other trading instruments such as price action, volume, volatility, and sentiment indicators, you can develop a robust trading strategy that enhances your profitability in the crypto market.
As you refine your strategy, consider using advanced tools and platforms that offer real-time OI data and customizable alerts, like the ErkeScan crypto screener. By leveraging these resources, you can stay ahead of the market and make more informed trading decisions.
With these strategies, you'll be well-equipped to incorporate Open Interest into your trading arsenal and improve your chances of success in the dynamic world of crypto trading.
Understanding Open Interest in Crypto Trading: A Guide to Profitable Strategies
Open Interest (OI) is a critical but often underutilized metric in the world of #CryptoTrading. This #guide will help you understand what #Openinterest is, how to use it effectively, and how to combine it with other trading instruments to enhance your trading strategy and boost profitability.
What is Open Interest?
Open Interest represents the total number of outstanding derivative contracts, such as futures or options, that are currently open and active. It’s a measure of the flow of money into the futures market and an #Indicator of market #Sentiments and liquidity.
Why is Open Interest Important?
Market Sentiment: Increasing OI suggests new money is flowing into the market, indicating a potential continuation of the current trend. Conversely, decreasing OI suggests money is leaving the market, which could signal a trend reversal.Liquidity: High OI indicates a liquid market where it is easier to enter and exit positions without significant slippage.Confirmation Tool: OI can be used to confirm trends. For instance, a price increase accompanied by rising OI suggests a strong bullish trend.
How to Use Open Interest in Crypto Trading
To effectively incorporate OI into your trading strategy, it’s essential to combine it with other instruments and indicators. Here are some practical strategies:
1. Combining OI with Price Action
Trend Confirmation: Use OI to confirm price trends. If prices are rising and OI is increasing, it suggests that the upward trend is strong and likely to continue. Conversely, if prices are rising but OI is falling, it may indicate that the trend is weakening.Divergence Analysis: Look for divergences between price and OI. For example, if the price of a cryptocurrency is rising but OI is decreasing, it could be a warning sign that the bullish trend is losing momentum.
2. OI and Volume Analysis
Volume Confirmation: High trading volume alongside increasing OI can confirm the strength of a price movement. Conversely, if volume is high but OI is decreasing, it might indicate short-term speculation rather than a strong trend.Volume Spikes: Sudden spikes in volume accompanied by rising OI can signal the beginning of a new trend or the end of a consolidation phase.
3. OI and Volatility
Volatility Analysis: Track changes in OI along with volatility measures like the Bollinger Bands or the Average True Range (ATR). Rising OI in a low volatility environment might signal a breakout, while high volatility with increasing OI can indicate a strong trending market.Volatility Breakouts: Use OI to identify potential breakouts. A sudden increase in OI during a period of low volatility might precede a significant price move.
4. OI and Sentiment Indicators
Market Sentiment: Combine OI with sentiment indicators like the Fear and Greed Index or social media sentiment analysis to gauge the overall mood of the market. High OI during extreme greed could indicate a potential bubble, while high OI during extreme fear might present a buying opportunity.Contrarian Signals: Use OI to identify contrarian trading opportunities. For example, if OI is rising significantly in a bearish market, it might indicate that a bottom is forming.
Practical Example: $RSR
Trade Analysis
Let's delve into a practical example to illustrate how Open Interest can be used effectively in trading decisions. The following images and analysis provide a detailed look into an RSR/USDT trade.
Example Breakdown:
Step 1: Identifying Key Levels on Higher Timeframe
The 4-hour chart of RSR/USDT shows a significant support level that was broken down. This breakdown indicated a potential change in trend direction from bullish to bearish.
Step 2: ERKEScan Alert
ERKEScan triggered an alert for a significant increase in Open Interest (OI Change 1h: 5.231). This alert indicates a substantial number of new positions being opened, suggesting strong market activity.
Step 3: Zooming into Smaller Timeframes
Moving into a smaller timeframe , we see that the price popped right into the newly formed resistance zone from the 4-hour breakdown level. This movement provided an ideal entry point for a short trade.
The chart shows the significant spike in price followed by a quick reversal, confirming the resistance level's strength. Many positions were placed at this level, providing a high-probability trade setup.
Trade Execution
Based on the higher timeframe analysis and the confirmation from the OI spike, we could enter a short trade on RSR at the resistance level. The trade benefits from the confirmation of increased OI and the price action aligning with our higher timeframe analysis.
Using ERKEScan's Top10 Leaderboard to Filter Fake Signals
To avoid being misled by fake OI signals, you can use ERKEScan's Top10 leaderboard feature. This tool shows the top 10 tokens with the highest Open Interest increases, allowing you to filter out any anomalies or false signals. By focusing on the tokens with the most significant OI changes, you can make more informed trading decisions and enhance your strategy's effectiveness.
Conclusion
Open Interest is a powerful tool that, when used correctly, can provide valuable insights into market sentiment, liquidity, and potential price movements. By combining OI with other trading instruments such as price action, volume, volatility, and sentiment indicators, you can develop a robust trading strategy that enhances your profitability in the crypto market.
As you refine your strategy, consider using advanced tools and platforms that offer real-time OI data and customizable alerts, like the ErkeScan crypto screener. By leveraging these resources, you can stay ahead of the market and make more informed trading decisions.
With these strategies, you'll be well-equipped to incorporate Open Interest into your trading arsenal and improve your chances of success in the dynamic world of crypto trading.
What is Open Interest?
Open Interest represents the total number of outstanding derivative contracts, such as futures or options, that are currently open and active. It’s a measure of the flow of money into the futures market and an #Indicator of market #Sentiments and liquidity.
Why is Open Interest Important?
Market Sentiment: Increasing OI suggests new money is flowing into the market, indicating a potential continuation of the current trend. Conversely, decreasing OI suggests money is leaving the market, which could signal a trend reversal.Liquidity: High OI indicates a liquid market where it is easier to enter and exit positions without significant slippage.Confirmation Tool: OI can be used to confirm trends. For instance, a price increase accompanied by rising OI suggests a strong bullish trend.
How to Use Open Interest in Crypto Trading
To effectively incorporate OI into your trading strategy, it’s essential to combine it with other instruments and indicators. Here are some practical strategies:
1. Combining OI with Price Action
Trend Confirmation: Use OI to confirm price trends. If prices are rising and OI is increasing, it suggests that the upward trend is strong and likely to continue. Conversely, if prices are rising but OI is falling, it may indicate that the trend is weakening.Divergence Analysis: Look for divergences between price and OI. For example, if the price of a cryptocurrency is rising but OI is decreasing, it could be a warning sign that the bullish trend is losing momentum.
2. OI and Volume Analysis
Volume Confirmation: High trading volume alongside increasing OI can confirm the strength of a price movement. Conversely, if volume is high but OI is decreasing, it might indicate short-term speculation rather than a strong trend.Volume Spikes: Sudden spikes in volume accompanied by rising OI can signal the beginning of a new trend or the end of a consolidation phase.
3. OI and Volatility
Volatility Analysis: Track changes in OI along with volatility measures like the Bollinger Bands or the Average True Range (ATR). Rising OI in a low volatility environment might signal a breakout, while high volatility with increasing OI can indicate a strong trending market.Volatility Breakouts: Use OI to identify potential breakouts. A sudden increase in OI during a period of low volatility might precede a significant price move.
4. OI and Sentiment Indicators
Market Sentiment: Combine OI with sentiment indicators like the Fear and Greed Index or social media sentiment analysis to gauge the overall mood of the market. High OI during extreme greed could indicate a potential bubble, while high OI during extreme fear might present a buying opportunity.Contrarian Signals: Use OI to identify contrarian trading opportunities. For example, if OI is rising significantly in a bearish market, it might indicate that a bottom is forming.
Practical Example: $RSR
Trade Analysis
Let's delve into a practical example to illustrate how Open Interest can be used effectively in trading decisions. The following images and analysis provide a detailed look into an RSR/USDT trade.
Example Breakdown:
Step 1: Identifying Key Levels on Higher Timeframe
The 4-hour chart of RSR/USDT shows a significant support level that was broken down. This breakdown indicated a potential change in trend direction from bullish to bearish.
Step 2: ERKEScan Alert
ERKEScan triggered an alert for a significant increase in Open Interest (OI Change 1h: 5.231). This alert indicates a substantial number of new positions being opened, suggesting strong market activity.
Step 3: Zooming into Smaller Timeframes
Moving into a smaller timeframe , we see that the price popped right into the newly formed resistance zone from the 4-hour breakdown level. This movement provided an ideal entry point for a short trade.
The chart shows the significant spike in price followed by a quick reversal, confirming the resistance level's strength. Many positions were placed at this level, providing a high-probability trade setup.
Trade Execution
Based on the higher timeframe analysis and the confirmation from the OI spike, we could enter a short trade on RSR at the resistance level. The trade benefits from the confirmation of increased OI and the price action aligning with our higher timeframe analysis.
Using ERKEScan's Top10 Leaderboard to Filter Fake Signals
To avoid being misled by fake OI signals, you can use ERKEScan's Top10 leaderboard feature. This tool shows the top 10 tokens with the highest Open Interest increases, allowing you to filter out any anomalies or false signals. By focusing on the tokens with the most significant OI changes, you can make more informed trading decisions and enhance your strategy's effectiveness.
Conclusion
Open Interest is a powerful tool that, when used correctly, can provide valuable insights into market sentiment, liquidity, and potential price movements. By combining OI with other trading instruments such as price action, volume, volatility, and sentiment indicators, you can develop a robust trading strategy that enhances your profitability in the crypto market.
As you refine your strategy, consider using advanced tools and platforms that offer real-time OI data and customizable alerts, like the ErkeScan crypto screener. By leveraging these resources, you can stay ahead of the market and make more informed trading decisions.
With these strategies, you'll be well-equipped to incorporate Open Interest into your trading arsenal and improve your chances of success in the dynamic world of crypto trading.
2
1.7k

·
--
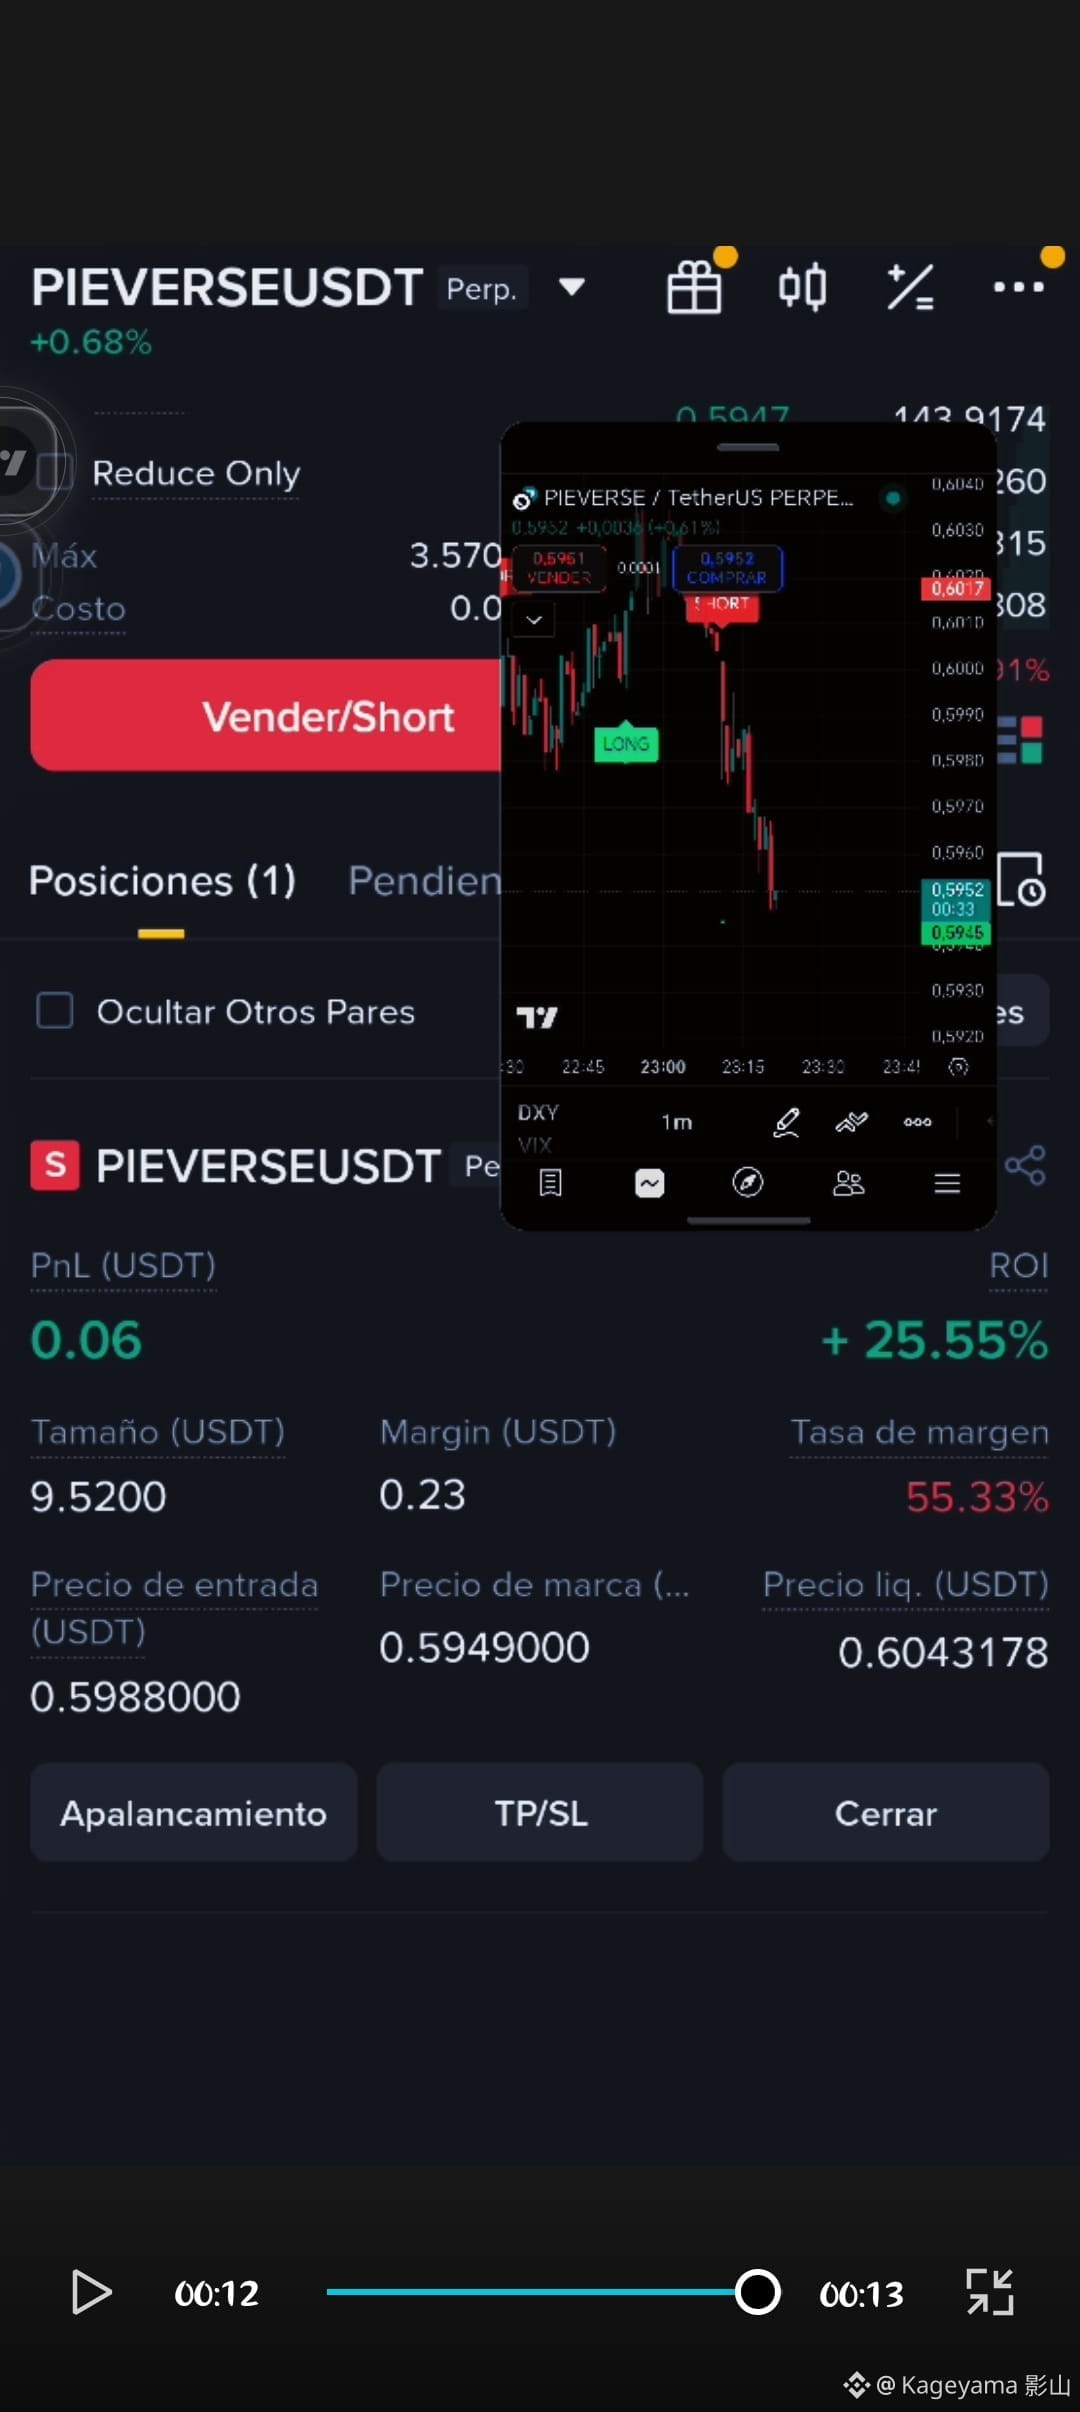
🚨Testing my own indicator,
Coming soon : Ultra zero. #KAGEYAMAENGINEULTRAZERO #indicator #scalping #creador @Eslava_23crypto
🚨Testing my own indicator,
Coming soon : Ultra zero. #KAGEYAMAENGINEULTRAZERO #indicator #scalping #creador @Eslava_23crypto
Coming soon : Ultra zero. #KAGEYAMAENGINEULTRAZERO #indicator #scalping #creador @Eslava_23crypto
1
218

Article
Trading Indicators: What Are the Key Ones and How to Use Them to Your Advantage?Trading indicators are essential tools for anyone looking to make data-driven decisions in the financial markets.
They use mathematical calculations applied to prices, volumes, and other market factors to provide relevant insights on trends, momentum, volatility, and the strength of asset movements.
$LAB When applied to charts, indicators help traders spot opportunities, confirm entry and exit signals, and manage risks more efficiently.
Trading Indicators: What Are the Key Ones and How to Use Them to Your Advantage?
Trading indicators are essential tools for anyone looking to make data-driven decisions in the financial markets.
They use mathematical calculations applied to prices, volumes, and other market factors to provide relevant insights on trends, momentum, volatility, and the strength of asset movements.
$LAB When applied to charts, indicators help traders spot opportunities, confirm entry and exit signals, and manage risks more efficiently.
They use mathematical calculations applied to prices, volumes, and other market factors to provide relevant insights on trends, momentum, volatility, and the strength of asset movements.
$LAB When applied to charts, indicators help traders spot opportunities, confirm entry and exit signals, and manage risks more efficiently.
2
4
2k

·
--
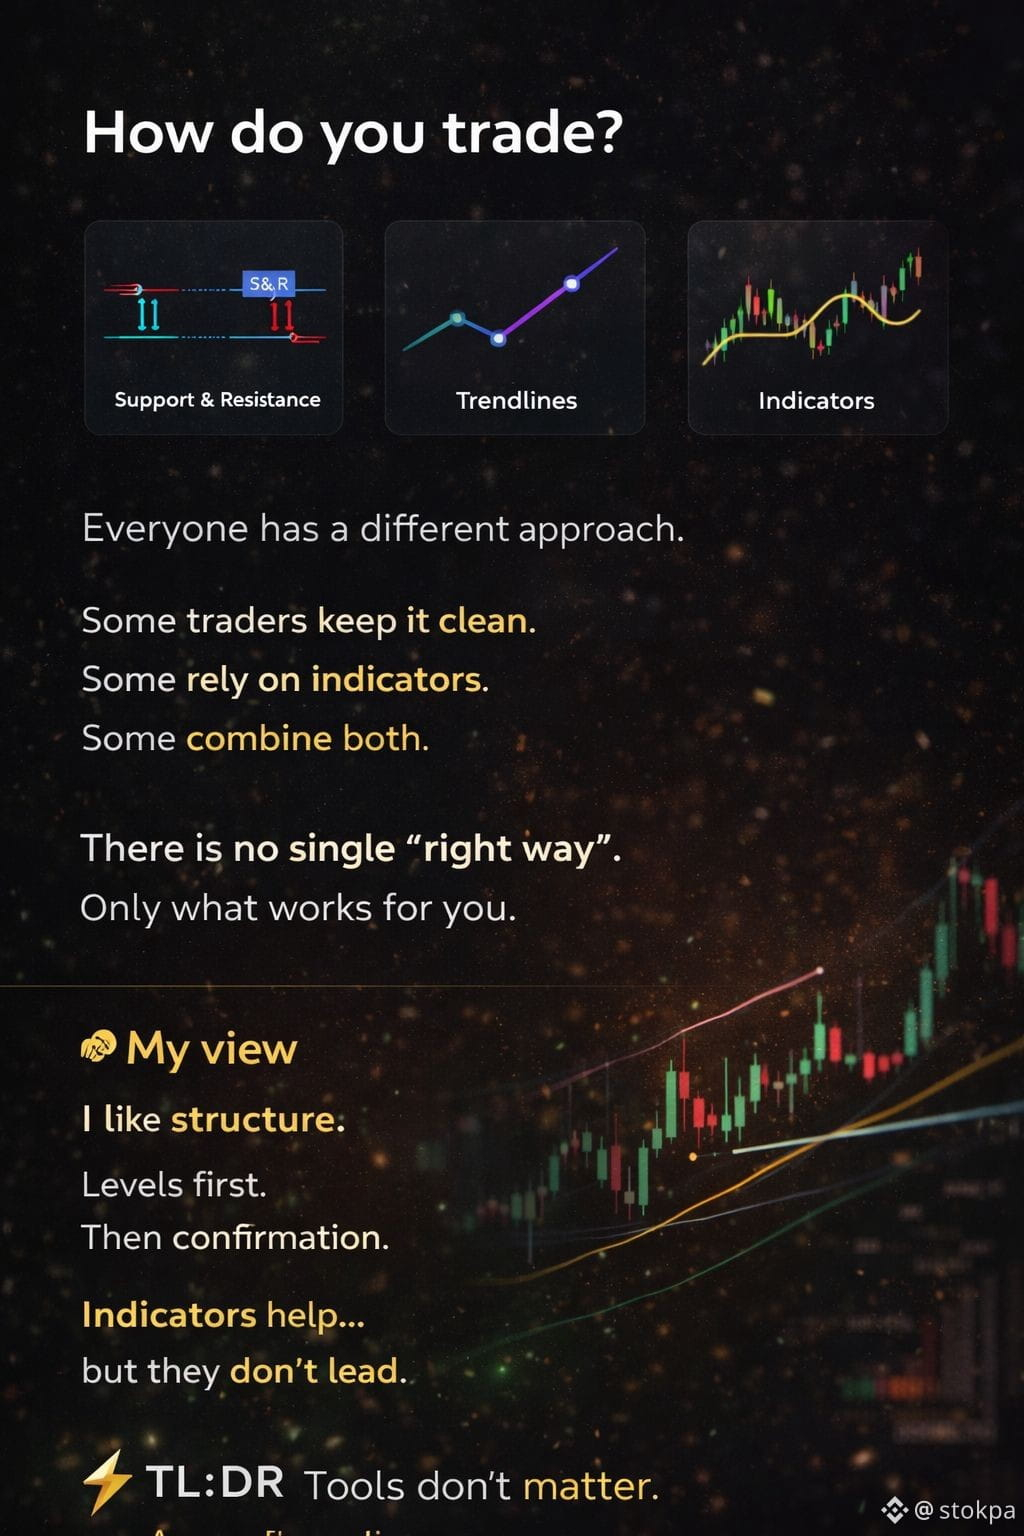
How do you trade?
Do you use:
Support & Resistance?
Trendlines?
Indicators?
Everyone has a different approach.
Some traders keep it clean.
Some rely on indicators.
Some combine both.
There is no single “right way”.
Only what works for you.
🧠 My view
I like structure.
Levels first.
Then confirmation.
Indicators help…
but they don’t lead.
⚡ TL;DR
Tools don’t matter.
Execution does.
👉 What’s your favorite indicator?
Coments are welcome...
#indicator #trading
How do you trade?
Do you use:
Support & Resistance?
Trendlines?
Indicators?
Everyone has a different approach.
Some traders keep it clean.
Some rely on indicators.
Some combine both.
There is no single “right way”.
Only what works for you.
🧠 My view
I like structure.
Levels first.
Then confirmation.
Indicators help…
but they don’t lead.
⚡ TL;DR
Tools don’t matter.
Execution does.
👉 What’s your favorite indicator?
Coments are welcome...
#indicator #trading
Do you use:
Support & Resistance?
Trendlines?
Indicators?
Everyone has a different approach.
Some traders keep it clean.
Some rely on indicators.
Some combine both.
There is no single “right way”.
Only what works for you.
🧠 My view
I like structure.
Levels first.
Then confirmation.
Indicators help…
but they don’t lead.
⚡ TL;DR
Tools don’t matter.
Execution does.
👉 What’s your favorite indicator?
Coments are welcome...
#indicator #trading
120
Log in to explore more content
Join global crypto users on Binance Square
⚡️ Get latest and useful information about crypto.
💬 Trusted by the world’s largest crypto exchange.
👍 Discover real insights from verified creators.
Email / Phone number
Trending Topics
1
#US10YTreasuryYieldHitsHighestSinceNov2023
0 views
0 Discussing
2
#USTreasuryToBuyBackUpTo$6BLongDatedDebt
6,853 views
121 Discussing
3
#BitcoinSurpasses$79K
47,646 views
243 Discussing
4
#BrentCrudeTops$100
105,429 views
365 Discussing
5
#USADPWeeklyEmploymentRises12000
71,746 views
946 Discussing
6
#BankOfAmericaGroupPilotsUSBDCStablecoin
56,199 views
751 Discussing
7
#RippleLobbiesToAdvanceCLARITYActVote
87,298 views
1,011 Discussing
8
#GrayscaleZcashETFTops$500M
13,979 views
122 Discussing
9
#LAPTOPFoundationXAccountSuspended
367 views
15 Discussing
10
#ChinaAugustCPIRises0.8%YoY
61,680 views
1,065 Discussing