
#hot
hot
1M views
5,228 Discussing
Hot
Latest

·
--
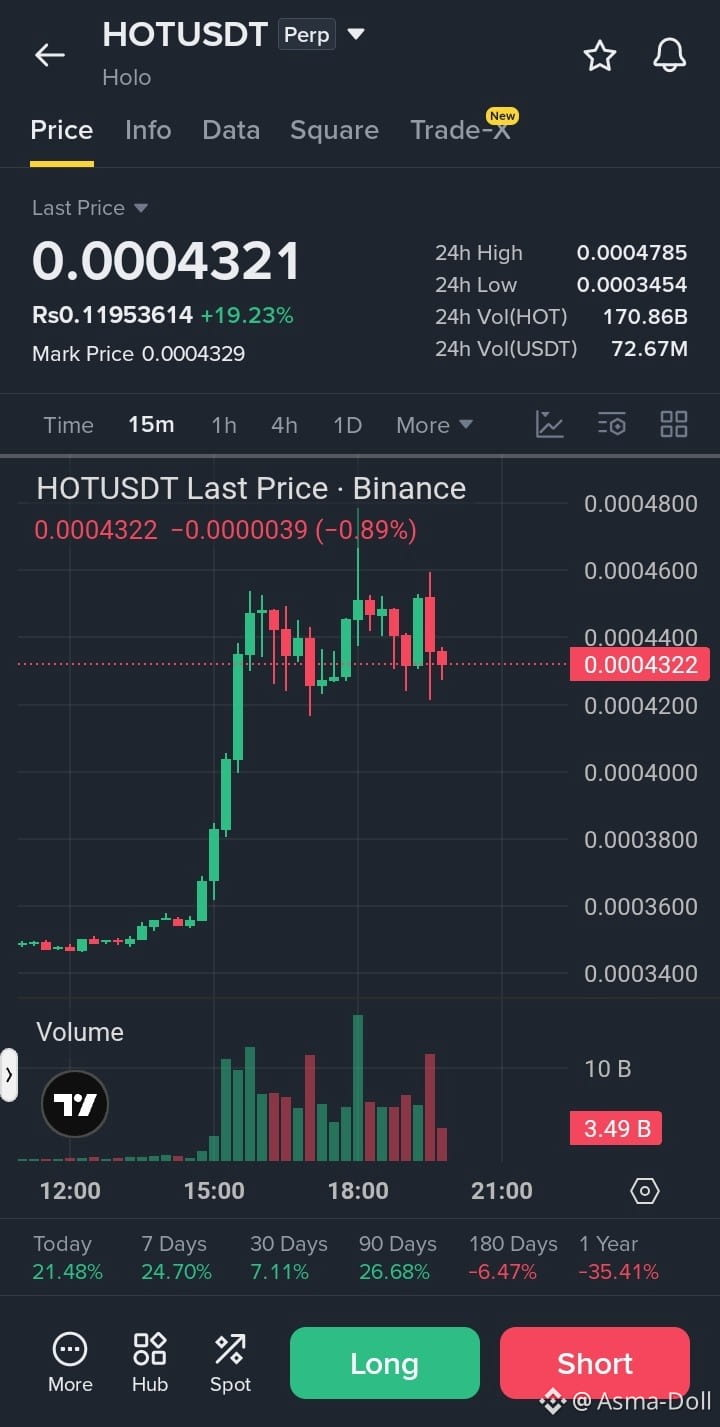
🔴 $HOT /USDT – SHORT SIGNAL (Binance Futures)
Trade Plan:
Direction: SHORT 📉
Entry: $0.000430 – $0.000438
Stop Loss (SL): $0.000456
Take Profit Targets:
TP1: $0.000415
TP2: $0.000400
TP3: $0.000380
Trade here $HOT
{future}(HOTUSDT)
Analysis:
Strong +19.23% daily pump.
Price rejected from $0.0004785 resistance.
Possible profit-taking after a sharp rally.
Short-term pullback may develop.
Sellers need to defend the $0.000440–$0.000450 zone.
Confirmation: Wait for a clean break below $0.000425 with selling volume before entering SHORT.
Risk-to-Reward: Approximately 1:0.8 / 1:1.5 / 1:2.4.
⚠️ Important: HOT has strong bullish momentum. Avoid chasing a short; wait for bearish confirmation.
#HOTUSDT #HOT #BinanceFutures #CryptoSignals #ShortSignal
🔴 $HOT /USDT – SHORT SIGNAL (Binance Futures)
Trade Plan:
Direction: SHORT 📉
Entry: $0.000430 – $0.000438
Stop Loss (SL): $0.000456
Take Profit Targets:
TP1: $0.000415
TP2: $0.000400
TP3: $0.000380
Trade here $HOT
Analysis:
Strong +19.23% daily pump.
Price rejected from $0.0004785 resistance.
Possible profit-taking after a sharp rally.
Short-term pullback may develop.
Sellers need to defend the $0.000440–$0.000450 zone.
Confirmation: Wait for a clean break below $0.000425 with selling volume before entering SHORT.
Risk-to-Reward: Approximately 1:0.8 / 1:1.5 / 1:2.4.
⚠️ Important: HOT has strong bullish momentum. Avoid chasing a short; wait for bearish confirmation.
#HOTUSDT #HOT #BinanceFutures #CryptoSignals #ShortSignal
Trade Plan:
Direction: SHORT 📉
Entry: $0.000430 – $0.000438
Stop Loss (SL): $0.000456
Take Profit Targets:
TP1: $0.000415
TP2: $0.000400
TP3: $0.000380
Trade here $HOT
Analysis:
Strong +19.23% daily pump.
Price rejected from $0.0004785 resistance.
Possible profit-taking after a sharp rally.
Short-term pullback may develop.
Sellers need to defend the $0.000440–$0.000450 zone.
Confirmation: Wait for a clean break below $0.000425 with selling volume before entering SHORT.
Risk-to-Reward: Approximately 1:0.8 / 1:1.5 / 1:2.4.
⚠️ Important: HOT has strong bullish momentum. Avoid chasing a short; wait for bearish confirmation.
#HOTUSDT #HOT #BinanceFutures #CryptoSignals #ShortSignal
3
163

·
--
Bullish
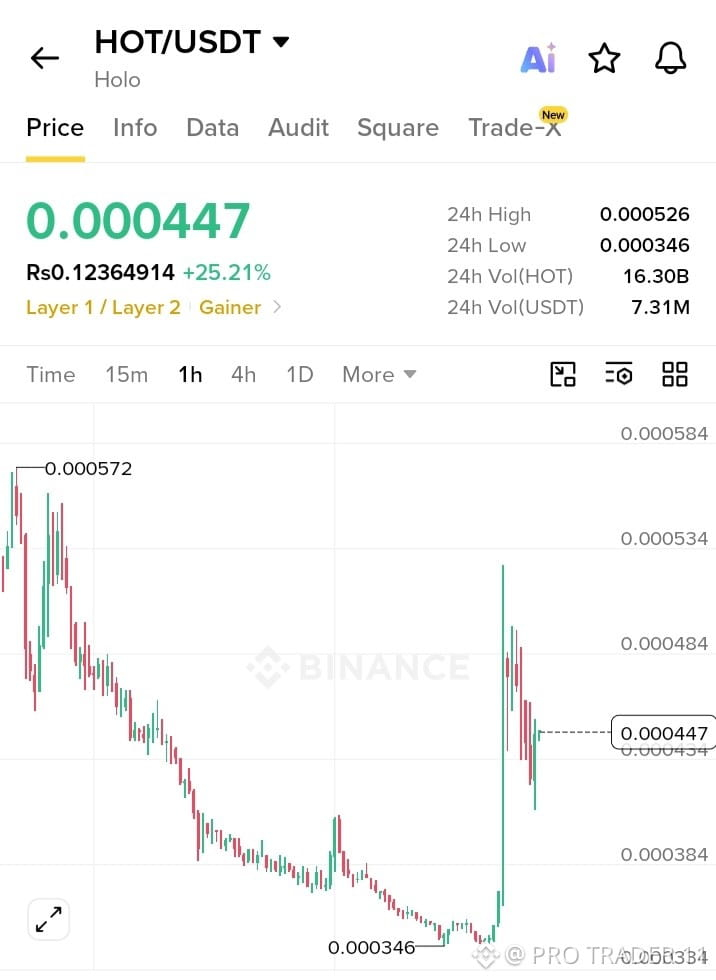
🚀 $HOT BREAKOUT ALERT: $0.000526 NEXT TARGET_
Long Entry: 0.000410–0.000447
SL: 0.000380
TP1: 0.000484
TP2: 0.000526
TP3: 0.000572
#HOT #HOTUSDT #Holo #BinanceGainer
{future}(HOTUSDT)
🚀 $HOT BREAKOUT ALERT: $0.000526 NEXT TARGET_
Long Entry: 0.000410–0.000447
SL: 0.000380
TP1: 0.000484
TP2: 0.000526
TP3: 0.000572
#HOT #HOTUSDT #Holo #BinanceGainer
Long Entry: 0.000410–0.000447
SL: 0.000380
TP1: 0.000484
TP2: 0.000526
TP3: 0.000572
#HOT #HOTUSDT #Holo #BinanceGainer
1
136

·
--
Bullish
🚨 $hot: price action looks clean, breakout is loading!
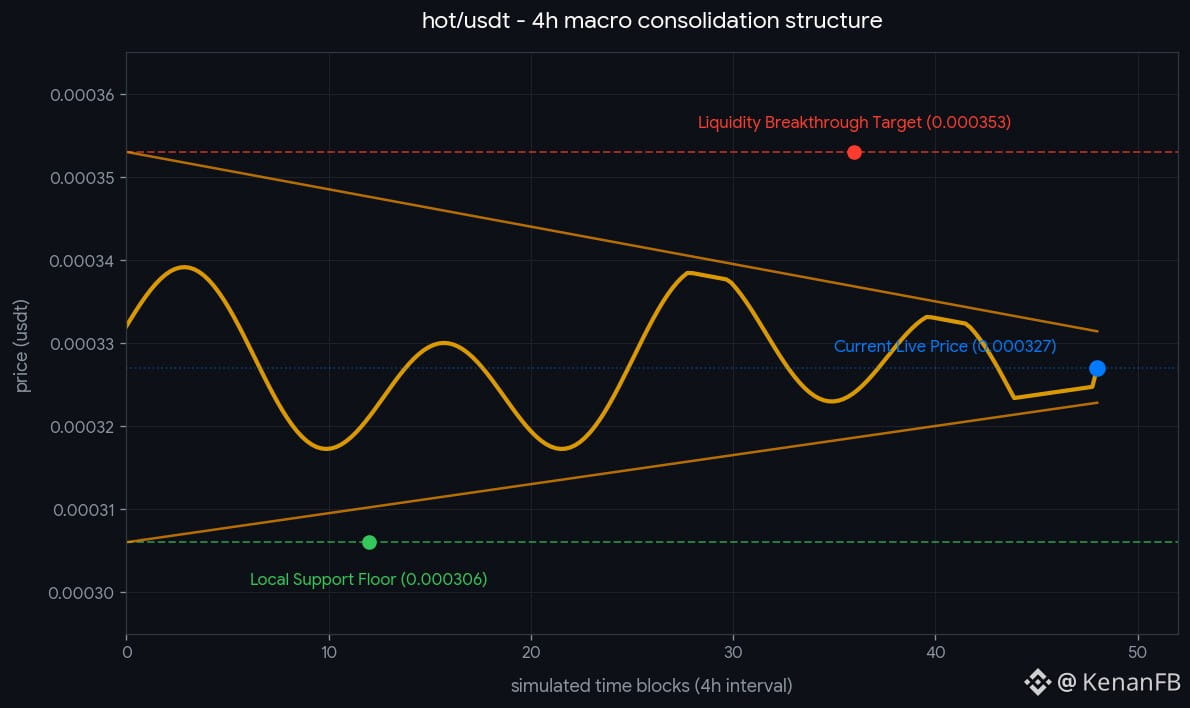
quick market scan on $hot and the macro structure is coiling hard. order book is heavy at the local support floor and the daily accumulation zone has been defended perfectly by the buyers. smart money is silently accumulating while weak hands panic close.
price action looks clean as we approach the key overhead compression. whales are buying the local dips, absorbing all sell pressure near 0.000306. once the volume kicks in, this symmetrical structure is going to pop aggressively toward the 0.000353 major liquidity pool. bags are packed and we are just waiting for the trigger.
if you're betting on this bounce, you can check the trading pair below to position yourself.
are you buying this move or waiting for lower numbers? let me know below! 👇
$HOT
{future}(HOTUSDT)
backed by hours of chart scanning. if this alpha makes you green, hitting the tip button supports the grind.
#hot #holo #Web3 #Binance
*disclaimer: market commentary based on current live data. not financial advice. always dyor.*
🚨 $hot: price action looks clean, breakout is loading!
quick market scan on $hot and the macro structure is coiling hard. order book is heavy at the local support floor and the daily accumulation zone has been defended perfectly by the buyers. smart money is silently accumulating while weak hands panic close.
price action looks clean as we approach the key overhead compression. whales are buying the local dips, absorbing all sell pressure near 0.000306. once the volume kicks in, this symmetrical structure is going to pop aggressively toward the 0.000353 major liquidity pool. bags are packed and we are just waiting for the trigger.
if you're betting on this bounce, you can check the trading pair below to position yourself.
are you buying this move or waiting for lower numbers? let me know below! 👇
$HOT
backed by hours of chart scanning. if this alpha makes you green, hitting the tip button supports the grind.
#hot #holo #Web3 #Binance
*disclaimer: market commentary based on current live data. not financial advice. always dyor.*
quick market scan on $hot and the macro structure is coiling hard. order book is heavy at the local support floor and the daily accumulation zone has been defended perfectly by the buyers. smart money is silently accumulating while weak hands panic close.
price action looks clean as we approach the key overhead compression. whales are buying the local dips, absorbing all sell pressure near 0.000306. once the volume kicks in, this symmetrical structure is going to pop aggressively toward the 0.000353 major liquidity pool. bags are packed and we are just waiting for the trigger.
if you're betting on this bounce, you can check the trading pair below to position yourself.
are you buying this move or waiting for lower numbers? let me know below! 👇
$HOT
backed by hours of chart scanning. if this alpha makes you green, hitting the tip button supports the grind.
#hot #holo #Web3 #Binance
*disclaimer: market commentary based on current live data. not financial advice. always dyor.*
1
996


·
--
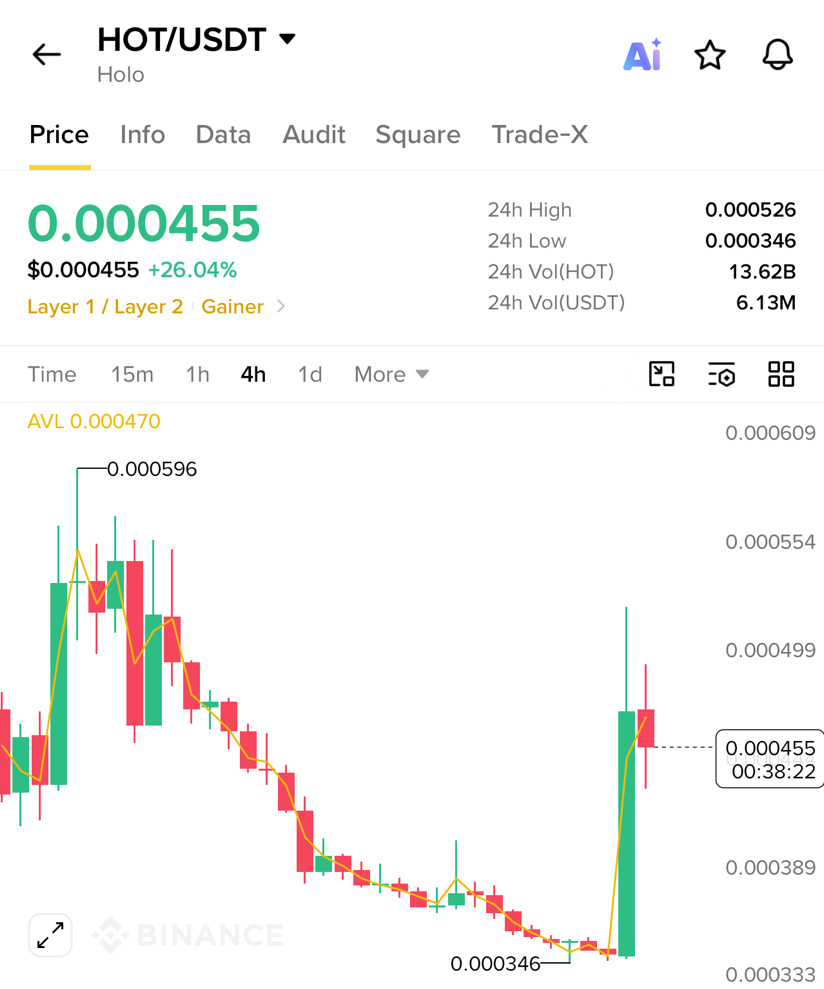
HOLO (HOT): A Major Comeback or Another Price Correction? Here's What Traders Must Watch!Holo (HOT) is attracting attention as traders evaluate its recent price movements and the launch of HoloFuel. But is HOT preparing for a recovery, or could sellers push the price lower?
Let's break down the market structure, important price levels, and potential opportunities.
🔍 Market Overview
According to Binance market data on November 8, 2026:
Current Price: $0.0003493
24H Change: -5.88%
24H High: $0.0003728
24H Low: $0.0003458
Market Cap: Approximately $62 million
24H Trading Volume: Approximately $5.2 million.
This development could attract attention in the longer term, but real adoption and sustained demand will be important factors to watch.
🐂 Bullish vs. 🐻 Bearish Scenario
Bullish Scenario: If buyers defend $0.000345 and reclaim $0.000383 with strong volume, HOT could attempt a move toward $0.000410.
Bearish Scenario: If selling pressure increases and $0.000345 breaks, a decline toward $0.000307 becomes a level to monitor.
🎯 Final Verdict
Holo (HOT) is currently at an important technical decision point. Its ecosystem developments offer an interesting long-term narrative, but the short-term chart still requires confirmation from buyers.
My strategy as a trader would be simple: Watch volume, respect support, and never chase a breakout without confirmation.
The next major move could depend on whether buyers can turn resistance into support.
What do you think? Is HOT preparing for a strong comeback, or will bears remain in control?
Disclaimer: This article is for educational purposes only, not financial advice. Cryptocurrency markets are highly volatile. Always do your own research.
Always do your own research.
#Holo #HOT #TechnicalAnalysis #Holofuel
HOLO (HOT): A Major Comeback or Another Price Correction? Here's What Traders Must Watch!
Holo (HOT) is attracting attention as traders evaluate its recent price movements and the launch of HoloFuel. But is HOT preparing for a recovery, or could sellers push the price lower?
Let's break down the market structure, important price levels, and potential opportunities.
🔍 Market Overview
According to Binance market data on November 8, 2026:
Current Price: $0.0003493
24H Change: -5.88%
24H High: $0.0003728
24H Low: $0.0003458
Market Cap: Approximately $62 million
24H Trading Volume: Approximately $5.2 million.
This development could attract attention in the longer term, but real adoption and sustained demand will be important factors to watch.
🐂 Bullish vs. 🐻 Bearish Scenario
Bullish Scenario: If buyers defend $0.000345 and reclaim $0.000383 with strong volume, HOT could attempt a move toward $0.000410.
Bearish Scenario: If selling pressure increases and $0.000345 breaks, a decline toward $0.000307 becomes a level to monitor.
🎯 Final Verdict
Holo (HOT) is currently at an important technical decision point. Its ecosystem developments offer an interesting long-term narrative, but the short-term chart still requires confirmation from buyers.
My strategy as a trader would be simple: Watch volume, respect support, and never chase a breakout without confirmation.
The next major move could depend on whether buyers can turn resistance into support.
What do you think? Is HOT preparing for a strong comeback, or will bears remain in control?
Disclaimer: This article is for educational purposes only, not financial advice. Cryptocurrency markets are highly volatile. Always do your own research.
Always do your own research.
#Holo #HOT #TechnicalAnalysis #Holofuel
Let's break down the market structure, important price levels, and potential opportunities.
🔍 Market Overview
According to Binance market data on November 8, 2026:
Current Price: $0.0003493
24H Change: -5.88%
24H High: $0.0003728
24H Low: $0.0003458
Market Cap: Approximately $62 million
24H Trading Volume: Approximately $5.2 million.
This development could attract attention in the longer term, but real adoption and sustained demand will be important factors to watch.
🐂 Bullish vs. 🐻 Bearish Scenario
Bullish Scenario: If buyers defend $0.000345 and reclaim $0.000383 with strong volume, HOT could attempt a move toward $0.000410.
Bearish Scenario: If selling pressure increases and $0.000345 breaks, a decline toward $0.000307 becomes a level to monitor.
🎯 Final Verdict
Holo (HOT) is currently at an important technical decision point. Its ecosystem developments offer an interesting long-term narrative, but the short-term chart still requires confirmation from buyers.
My strategy as a trader would be simple: Watch volume, respect support, and never chase a breakout without confirmation.
The next major move could depend on whether buyers can turn resistance into support.
What do you think? Is HOT preparing for a strong comeback, or will bears remain in control?
Disclaimer: This article is for educational purposes only, not financial advice. Cryptocurrency markets are highly volatile. Always do your own research.
Always do your own research.
#Holo #HOT #TechnicalAnalysis #Holofuel
296

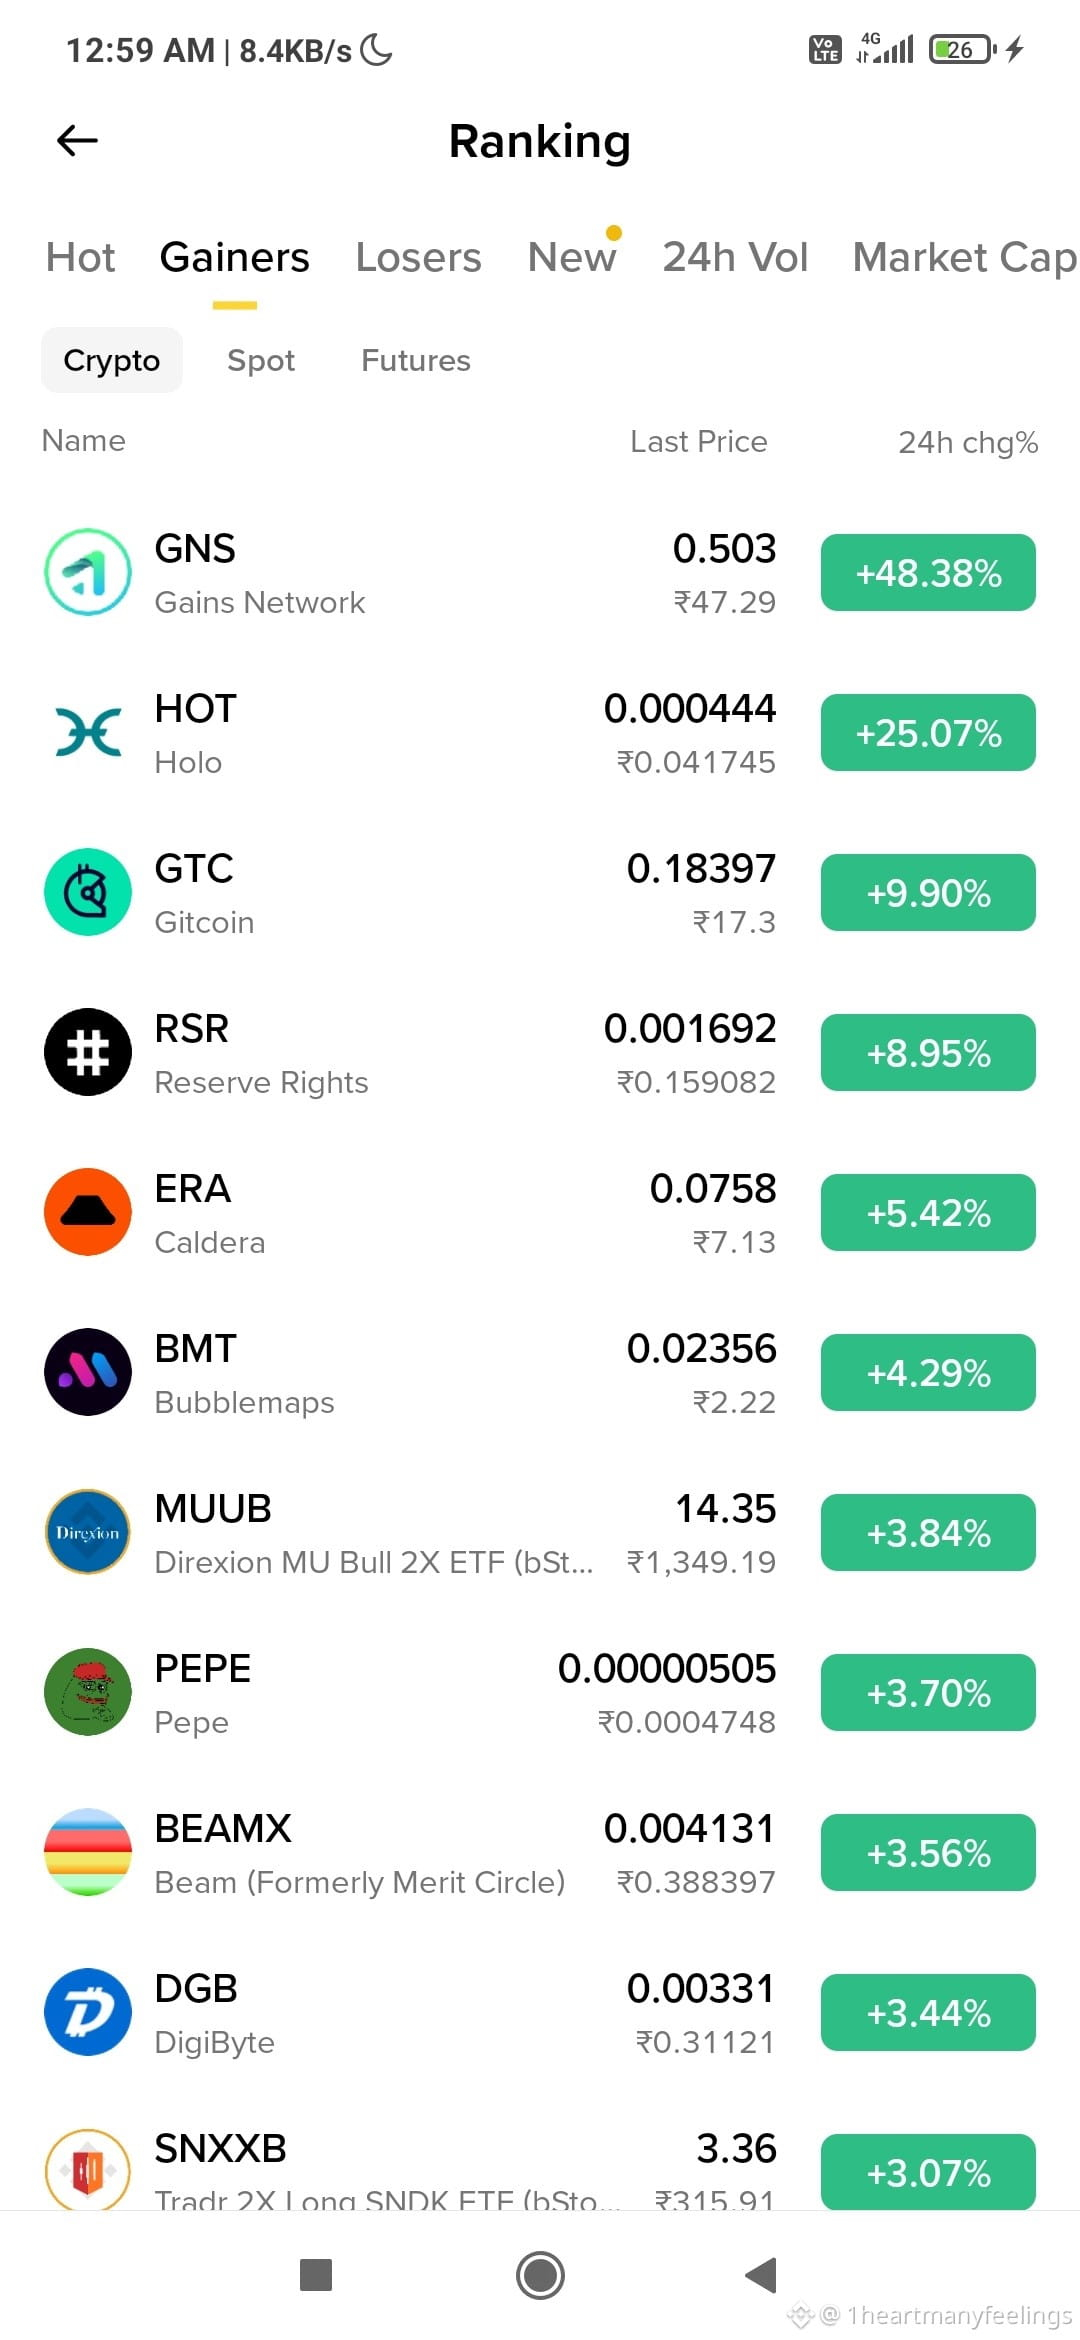
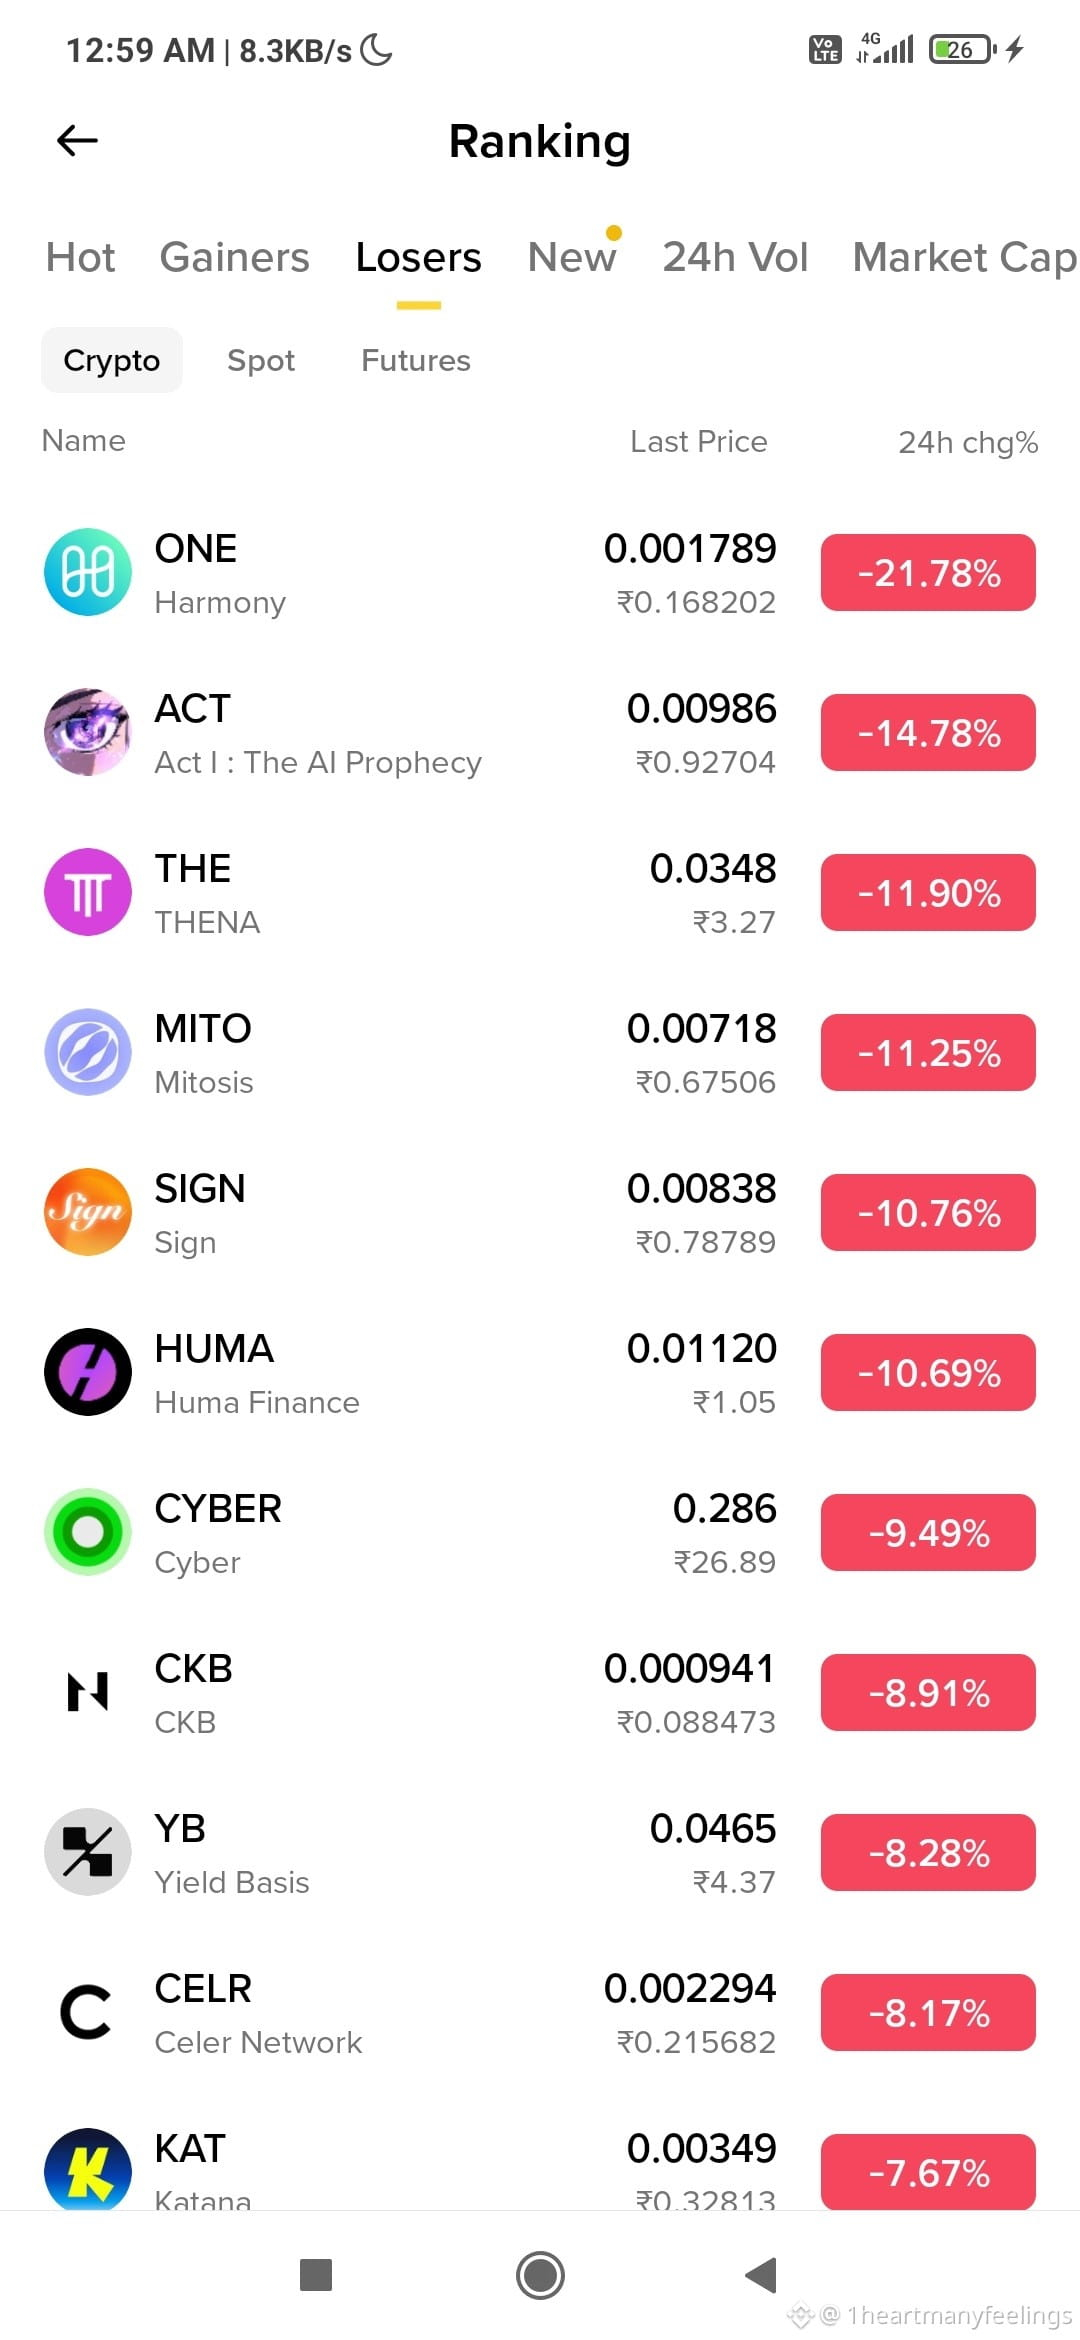
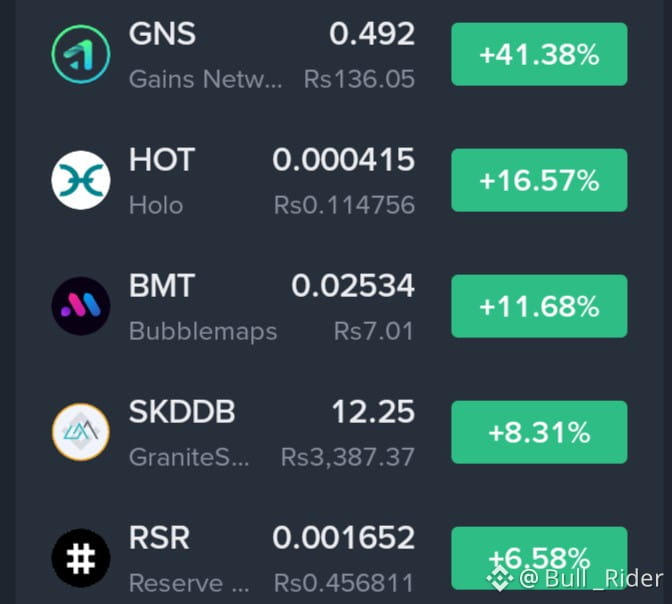
24 hours ago, ONE was +53% and MITO was +29%. Today both are on the top losers list. Meanwhile, two new coins are leading the gainers. Which ones have a reason?
The scoreboard: ONE is down ~25% from last night’s print, and MITO has given back ~18% from yesterday’s high. Neither had a clear catalyst.
HOT (+25%): there’s a real event behind it. HoloFuel went live on Nov 1, and holders can swap HOT 1:1 for HoloFuel. But HOT already rose ~71% in five days earlier this week (RSI was near overbought at the time) and is still ~98% below its 2021 record. Also note that HoloFuel runs under a provisional 90-day license, and only earned HoloFuel can be swapped back to HOT.
GNS (+48%): I couldn’t find a catalyst. Binance reportedly placed GNS under its Monitoring Tag in September, a delisting-risk flag. The protocol earned about $240K in fees over 30 days, and its buyback-and-burn is paused after a June governance vote.
Before you chase a gainer, ask:
1️⃣ Is there a dated, verifiable catalyst?
2️⃣ Can I exit? Check liquidity and volume.
3️⃣ How much of the move is already priced in?
Sharp moves cut both ways. Keep size small, decide your exit first, and never use money you can’t afford to lose.
Tap $HOT , $GNS or $MITO to see live charts. Which one would you rather study first? 👇
Disclosure: I may earn commissions from trades made through links or widgets in my posts (Binance Write to Earn / referral programs). This is analysis, not financial advice, and nothing here guarantees any outcome.
#Crypto #Altcoins #HOT #GNS #one #Binance
24 hours ago, ONE was +53% and MITO was +29%. Today both are on the top losers list. Meanwhile, two new coins are leading the gainers. Which ones have a reason?
The scoreboard: ONE is down ~25% from last night’s print, and MITO has given back ~18% from yesterday’s high. Neither had a clear catalyst.
HOT (+25%): there’s a real event behind it. HoloFuel went live on Nov 1, and holders can swap HOT 1:1 for HoloFuel. But HOT already rose ~71% in five days earlier this week (RSI was near overbought at the time) and is still ~98% below its 2021 record. Also note that HoloFuel runs under a provisional 90-day license, and only earned HoloFuel can be swapped back to HOT.
GNS (+48%): I couldn’t find a catalyst. Binance reportedly placed GNS under its Monitoring Tag in September, a delisting-risk flag. The protocol earned about $240K in fees over 30 days, and its buyback-and-burn is paused after a June governance vote.
Before you chase a gainer, ask:
1️⃣ Is there a dated, verifiable catalyst?
2️⃣ Can I exit? Check liquidity and volume.
3️⃣ How much of the move is already priced in?
Sharp moves cut both ways. Keep size small, decide your exit first, and never use money you can’t afford to lose.
Tap $HOT , $GNS or $MITO to see live charts. Which one would you rather study first? 👇
Disclosure: I may earn commissions from trades made through links or widgets in my posts (Binance Write to Earn / referral programs). This is analysis, not financial advice, and nothing here guarantees any outcome.
#Crypto #Altcoins #HOT #GNS #one #Binance
The scoreboard: ONE is down ~25% from last night’s print, and MITO has given back ~18% from yesterday’s high. Neither had a clear catalyst.
HOT (+25%): there’s a real event behind it. HoloFuel went live on Nov 1, and holders can swap HOT 1:1 for HoloFuel. But HOT already rose ~71% in five days earlier this week (RSI was near overbought at the time) and is still ~98% below its 2021 record. Also note that HoloFuel runs under a provisional 90-day license, and only earned HoloFuel can be swapped back to HOT.
GNS (+48%): I couldn’t find a catalyst. Binance reportedly placed GNS under its Monitoring Tag in September, a delisting-risk flag. The protocol earned about $240K in fees over 30 days, and its buyback-and-burn is paused after a June governance vote.
Before you chase a gainer, ask:
1️⃣ Is there a dated, verifiable catalyst?
2️⃣ Can I exit? Check liquidity and volume.
3️⃣ How much of the move is already priced in?
Sharp moves cut both ways. Keep size small, decide your exit first, and never use money you can’t afford to lose.
Tap $HOT , $GNS or $MITO to see live charts. Which one would you rather study first? 👇
Disclosure: I may earn commissions from trades made through links or widgets in my posts (Binance Write to Earn / referral programs). This is analysis, not financial advice, and nothing here guarantees any outcome.
#Crypto #Altcoins #HOT #GNS #one #Binance
229

$HOT SURGES +16%! OVER 8.7M VOL LAYER 1 / LAYER 2 GAINER WITH FRESH TRAILING SAR SUPPORT AT $0.000394 — RSI AT 75.03 TARGETING A BREAKOUT PAST $0.000423 FOR $0.000526 RETEST?
Binance Layer 1 / Layer 2 top gainers are kicking off the week with intense buying volume! HOT (Holo) has logged a powerful +16.90% daily surge, backed by an impressive 8.71M USDT (19.58B $HOT) in 24-hour trading volume!
After bottoming at 0.000347 and holding dynamic higher-low support at 0.000390, price action launched an aggressive V-shape green bounce. $HOT is currently expanding strong momentum near 0.000415.
Master Scalp Setup & Strategic Levels:
Trade Bias: Strong Bullish Rebound / Scalp Long
Accumulation Entry Zone: 0.000394 – 0.000415 (Trailing SAR dynamic support range)
Key Targets: 0.000423 ➡️ 0.000443 ➡️ 0.000526 (24h Peak Retest)
Stop Loss: Below 0.000385
Why This Setup is Primed for Expansion:
Dynamic Parabolic SAR Trailing Support Flip: Parabolic SAR dots on the 15m chart have cleanly flipped directly beneath price candles at 0.000394, locking firm dynamic support for the ongoing rally.
Strong RSI Momentum Expansion: The 15m RSI (6) sits at a super strong 75.03 in high-momentum territory, supported by steady green volume candles. A decisive 15m push past 0.000423 clears the pathway for a fast move toward 0.000443 and the 0.000526 peak high.
Are you taking a long entry on HOT at this $0.000394 SAR support floor, or waiting for a breakout close above $0.000423? Share your strategy in the comments below!
Trade Now $HOT
{spot}(HOTUSDT)
#HotTrends #HOT #Holo
#BinanceSquare
$HOT SURGES +16%! OVER 8.7M VOL LAYER 1 / LAYER 2 GAINER WITH FRESH TRAILING SAR SUPPORT AT $0.000394 — RSI AT 75.03 TARGETING A BREAKOUT PAST $0.000423 FOR $0.000526 RETEST?
Binance Layer 1 / Layer 2 top gainers are kicking off the week with intense buying volume! HOT (Holo) has logged a powerful +16.90% daily surge, backed by an impressive 8.71M USDT (19.58B $HOT ) in 24-hour trading volume!
After bottoming at 0.000347 and holding dynamic higher-low support at 0.000390, price action launched an aggressive V-shape green bounce. $HOT is currently expanding strong momentum near 0.000415.
Master Scalp Setup & Strategic Levels:
Trade Bias: Strong Bullish Rebound / Scalp Long
Accumulation Entry Zone: 0.000394 – 0.000415 (Trailing SAR dynamic support range)
Key Targets: 0.000423 ➡️ 0.000443 ➡️ 0.000526 (24h Peak Retest)
Stop Loss: Below 0.000385
Why This Setup is Primed for Expansion:
Dynamic Parabolic SAR Trailing Support Flip: Parabolic SAR dots on the 15m chart have cleanly flipped directly beneath price candles at 0.000394, locking firm dynamic support for the ongoing rally.
Strong RSI Momentum Expansion: The 15m RSI (6) sits at a super strong 75.03 in high-momentum territory, supported by steady green volume candles. A decisive 15m push past 0.000423 clears the pathway for a fast move toward 0.000443 and the 0.000526 peak high.
Are you taking a long entry on HOT at this $0.000394 SAR support floor, or waiting for a breakout close above $0.000423? Share your strategy in the comments below!
Trade Now $HOT
#HotTrends #HOT #Holo
#BinanceSquare
Binance Layer 1 / Layer 2 top gainers are kicking off the week with intense buying volume! HOT (Holo) has logged a powerful +16.90% daily surge, backed by an impressive 8.71M USDT (19.58B $HOT ) in 24-hour trading volume!
After bottoming at 0.000347 and holding dynamic higher-low support at 0.000390, price action launched an aggressive V-shape green bounce. $HOT is currently expanding strong momentum near 0.000415.
Master Scalp Setup & Strategic Levels:
Trade Bias: Strong Bullish Rebound / Scalp Long
Accumulation Entry Zone: 0.000394 – 0.000415 (Trailing SAR dynamic support range)
Key Targets: 0.000423 ➡️ 0.000443 ➡️ 0.000526 (24h Peak Retest)
Stop Loss: Below 0.000385
Why This Setup is Primed for Expansion:
Dynamic Parabolic SAR Trailing Support Flip: Parabolic SAR dots on the 15m chart have cleanly flipped directly beneath price candles at 0.000394, locking firm dynamic support for the ongoing rally.
Strong RSI Momentum Expansion: The 15m RSI (6) sits at a super strong 75.03 in high-momentum territory, supported by steady green volume candles. A decisive 15m push past 0.000423 clears the pathway for a fast move toward 0.000443 and the 0.000526 peak high.
Are you taking a long entry on HOT at this $0.000394 SAR support floor, or waiting for a breakout close above $0.000423? Share your strategy in the comments below!
Trade Now $HOT
#HotTrends #HOT #Holo
#BinanceSquare
1
199

·
--
Bullish
UPSIDE MOVE* (*Stop*)❌
$HOT Upside Move Loading... 🚀❌
❌❌❌❌
Accumulation Zone:
Target 1: 0.0
Target 2:0.000
Stop Loss: 0.00
Rule: After TP1, we move SL to breakeven.
What's your plan - Buy the accumulation or chase the breakout? 👇
DYOR | NFA | Spot view only
#HOT
{spot}(HOTUSDT)
#CryptoTrading
UPSIDE MOVE* (*Stop*)❌
$HOT Upside Move Loading... 🚀❌
❌❌❌❌
Accumulation Zone:
Target 1: 0.0
Target 2:0.000
Stop Loss: 0.00
Rule: After TP1, we move SL to breakeven.
What's your plan - Buy the accumulation or chase the breakout? 👇
DYOR | NFA | Spot view only
#HOT
#CryptoTrading
$HOT Upside Move Loading... 🚀❌
❌❌❌❌
Accumulation Zone:
Target 1: 0.0
Target 2:0.000
Stop Loss: 0.00
Rule: After TP1, we move SL to breakeven.
What's your plan - Buy the accumulation or chase the breakout? 👇
DYOR | NFA | Spot view only
#HOT
#CryptoTrading
这个你不用管:
载走,直接爆舱下一个
1
153

·
--
Bullish
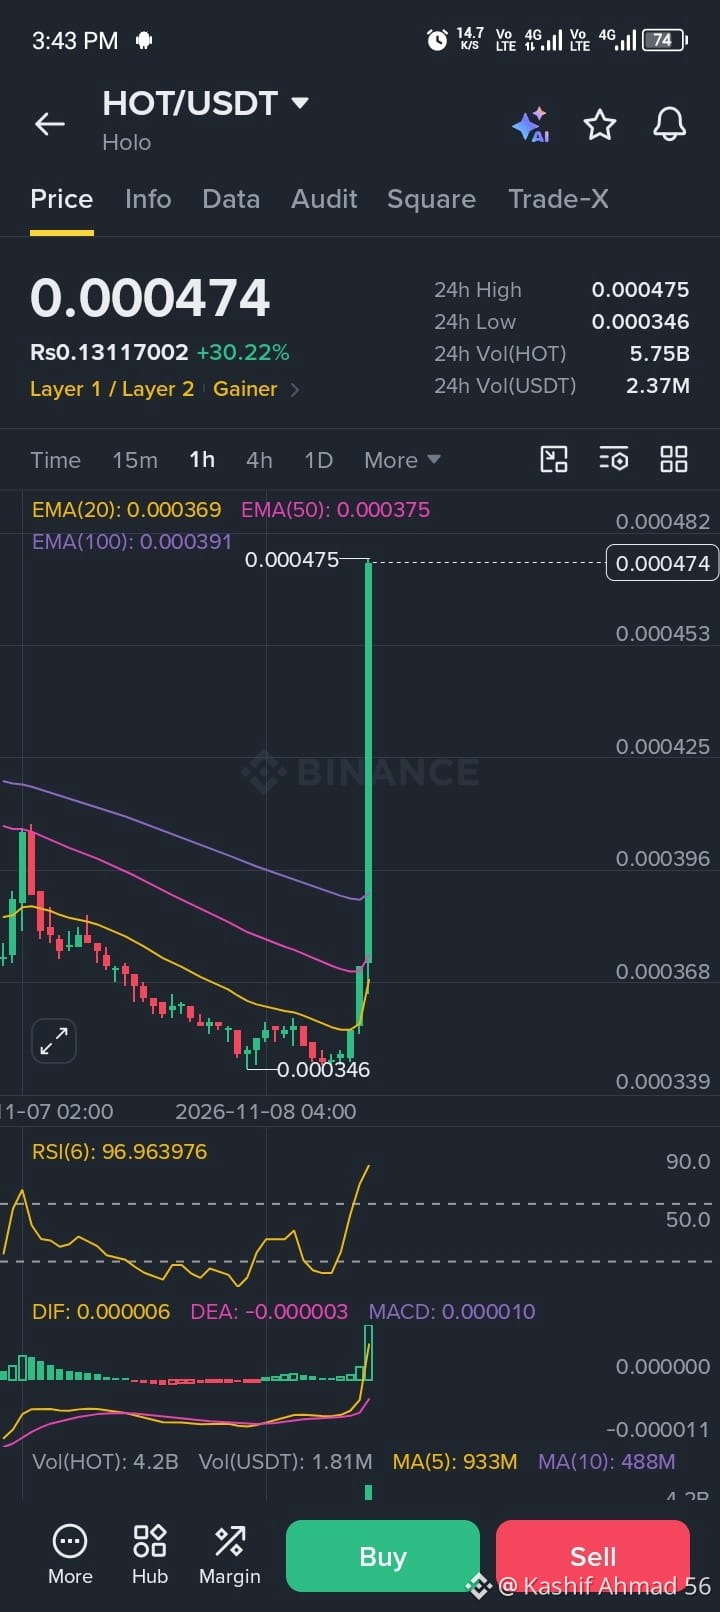
🚀 HOT/USDT — HUGE BREAKOUT! 🔥
HOT is making a powerful move! 📈 Up +30.22% and buyers are showing strong momentum!
💰 Current Price: $0.000474
🔥 24H High: $0.000475
🟢 Support Zone: $0.000425 – $0.000396
🎯 Next Target: $0.000500
🚀 Bigger Target: $0.000550
Could HOT be preparing for another leg up? 👀
🔥 Keep HOT on your watchlist and watch for the next opportunity!
⚠️ Don't rush into buying after a massive pump. Wait for confirmation and manage your risk.
❤️ FOLLOW ME for more crypto updates, potential opportunities and daily market analysis!
Are you BULLISH on HOT? 🔥
#HOT #hotusdt #BinanceSquareBTC #cryptotrading #altcoins
$HOT
{spot}(HOTUSDT)
🚀 HOT/USDT — HUGE BREAKOUT! 🔥
HOT is making a powerful move! 📈 Up +30.22% and buyers are showing strong momentum!
💰 Current Price: $0.000474
🔥 24H High: $0.000475
🟢 Support Zone: $0.000425 – $0.000396
🎯 Next Target: $0.000500
🚀 Bigger Target: $0.000550
Could HOT be preparing for another leg up? 👀
🔥 Keep HOT on your watchlist and watch for the next opportunity!
⚠️ Don't rush into buying after a massive pump. Wait for confirmation and manage your risk.
❤️ FOLLOW ME for more crypto updates, potential opportunities and daily market analysis!
Are you BULLISH on HOT? 🔥
#HOT #hotusdt #BinanceSquareBTC #cryptotrading #altcoins
$HOT
HOT is making a powerful move! 📈 Up +30.22% and buyers are showing strong momentum!
💰 Current Price: $0.000474
🔥 24H High: $0.000475
🟢 Support Zone: $0.000425 – $0.000396
🎯 Next Target: $0.000500
🚀 Bigger Target: $0.000550
Could HOT be preparing for another leg up? 👀
🔥 Keep HOT on your watchlist and watch for the next opportunity!
⚠️ Don't rush into buying after a massive pump. Wait for confirmation and manage your risk.
❤️ FOLLOW ME for more crypto updates, potential opportunities and daily market analysis!
Are you BULLISH on HOT? 🔥
#HOT #hotusdt #BinanceSquareBTC #cryptotrading #altcoins
$HOT
sobia khanum:
Salam bhai! I am also small trader from Pakistan! Following you! Please follow back! 🇵🇰🙏
4
3
1.4k

·
--
Bullish
🔥 Is $HOT gearing up for a massive breakout?
Looking at today's top gainers, HOT (Holo) is catching strong momentum with a solid +24.9% surge!
📊 Quick view:
Current Price: $0.000446
Trend: High volume pushing strong bullish pressure.
Are you holding or trading the swings? Drop your thoughts below! 👇
#BinanceSquare #HOT #crypto #trading #Altcoins
{future}(HOTUSDT)
🔥 Is $HOT gearing up for a massive breakout?
Looking at today's top gainers, HOT (Holo) is catching strong momentum with a solid +24.9% surge!
📊 Quick view:
Current Price: $0.000446
Trend: High volume pushing strong bullish pressure.
Are you holding or trading the swings? Drop your thoughts below! 👇
#BinanceSquare #HOT #crypto #trading #Altcoins
Looking at today's top gainers, HOT (Holo) is catching strong momentum with a solid +24.9% surge!
📊 Quick view:
Current Price: $0.000446
Trend: High volume pushing strong bullish pressure.
Are you holding or trading the swings? Drop your thoughts below! 👇
#BinanceSquare #HOT #crypto #trading #Altcoins

100


·
--
Bearish
$HOT short — Rejection at $0.000486, targeting $0.000430 🩸
HOT pumped +32% in 24 hours and is now hitting heavy resistance at $0.000486. The 4H RSI is overbought at ~71, suggesting buyers are exhausted. A clean 4H close below the $0.000460 support will confirm the short-term breakdown.
Entry: 4H close below $0.000460
SL: Above $0.000526 (24h high)
Target 1: $0.000430
Target 2: $0.000400
If price reclaims $0.000526, the setup is invalid — cut your losses.
$HOT
{future}(HOTUSDT)
DYOR. NFA. High volatility, use strict risk management.
#HOT #Holo #TradeIdea
$HOT short — Rejection at $0.000486, targeting $0.000430 🩸
HOT pumped +32% in 24 hours and is now hitting heavy resistance at $0.000486. The 4H RSI is overbought at ~71, suggesting buyers are exhausted. A clean 4H close below the $0.000460 support will confirm the short-term breakdown.
Entry: 4H close below $0.000460
SL: Above $0.000526 (24h high)
Target 1: $0.000430
Target 2: $0.000400
If price reclaims $0.000526, the setup is invalid — cut your losses.
$HOT
DYOR. NFA. High volatility, use strict risk management.
#HOT #Holo #TradeIdea
HOT pumped +32% in 24 hours and is now hitting heavy resistance at $0.000486. The 4H RSI is overbought at ~71, suggesting buyers are exhausted. A clean 4H close below the $0.000460 support will confirm the short-term breakdown.
Entry: 4H close below $0.000460
SL: Above $0.000526 (24h high)
Target 1: $0.000430
Target 2: $0.000400
If price reclaims $0.000526, the setup is invalid — cut your losses.
$HOT
DYOR. NFA. High volatility, use strict risk management.
#HOT #Holo #TradeIdea
2
514

·
--
$HOT Holo (HOT) – Recent performance & future price prediction
HOLO (HOT)
My approach: Evaluate the recent price movement, buying and selling pressure, support and resistance, and the probability of an upward or downward move.
The key question is whether HOT is preparing for a recovery or continuing its downward trend. A price increase alone does not confirm a trend reversal.
Recent market performance
As of November 8, 2026, market feeds are showing conflicting prices:
Source HOT price 24h movement
$0.0003538 -3.88%
Investing.com $0.000462 +26.96%
$0.0004778 +33.72%
These discrepancies are significant. Verify the actual HOT/USDT exchange price before trading.
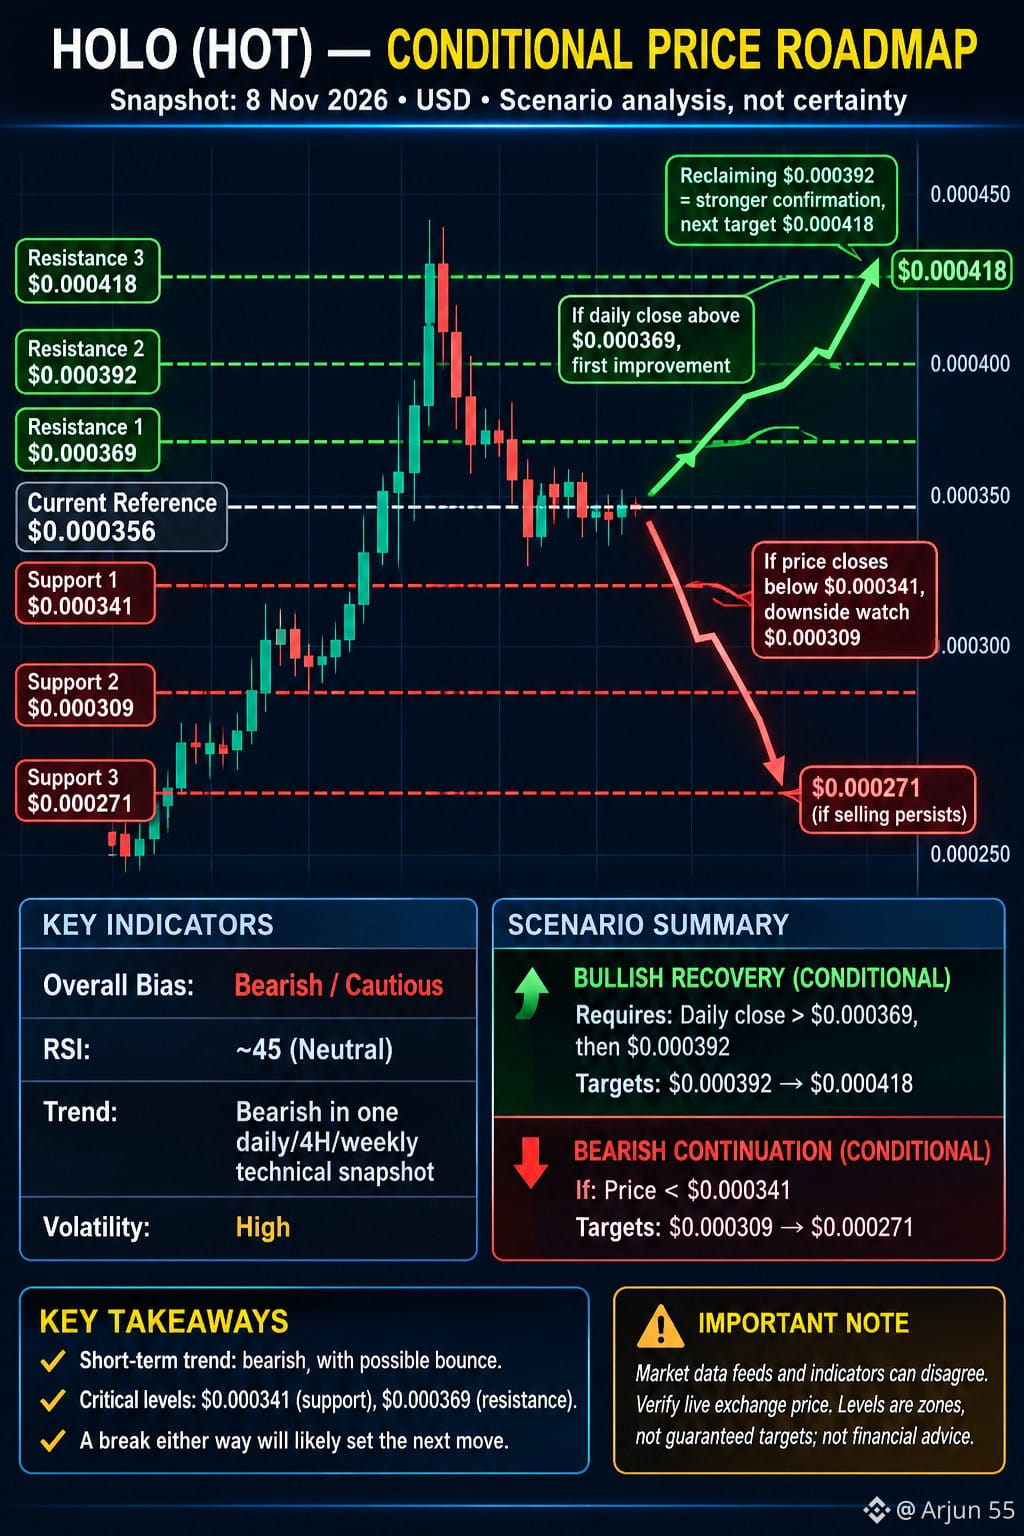
Important technical levels
Using the analysis as the reference:
Level Price
Support 1 $0.000361
Support 2 $0.000307
Resistance 1 $0.000383
A sustained move above $0.000383 would improve the bullish outlook. Losing $0.000307 would increase downside risk.
Future movement prediction
Bullish scenario: Buyers defend support and reclaim resistance, potentially starting another recovery.
Sideways scenario: HOT consolidates while buyers and sellers find balance.
Bearish scenario: Support breaks, leading to another decline.
One important warning: Investing.com reports RSI around 84.9 on its November 8 snapshot, indicating overbought conditions. A pullback is possible even during a strong rally.
My assessment
I would not call HOT a confirmed buy yet. I would wait for price confirmation, particularly a sustained breakout with strong trading volume.
#HOT #BMT #ACT #CPIWatch #USJobData
{spot}(HOTUSDT)
{spot}(BMTUSDT)
{spot}(ACTUSDT)
$HOT Holo (HOT) – Recent performance & future price prediction
HOLO (HOT)
My approach: Evaluate the recent price movement, buying and selling pressure, support and resistance, and the probability of an upward or downward move.
The key question is whether HOT is preparing for a recovery or continuing its downward trend. A price increase alone does not confirm a trend reversal.
Recent market performance
As of November 8, 2026, market feeds are showing conflicting prices:
Source HOT price 24h movement
$0.0003538 -3.88%
Investing.com $0.000462 +26.96%
$0.0004778 +33.72%
These discrepancies are significant. Verify the actual HOT/USDT exchange price before trading.
Important technical levels
Using the analysis as the reference:
Level Price
Support 1 $0.000361
Support 2 $0.000307
Resistance 1 $0.000383
A sustained move above $0.000383 would improve the bullish outlook. Losing $0.000307 would increase downside risk.
Future movement prediction
Bullish scenario: Buyers defend support and reclaim resistance, potentially starting another recovery.
Sideways scenario: HOT consolidates while buyers and sellers find balance.
Bearish scenario: Support breaks, leading to another decline.
One important warning: Investing.com reports RSI around 84.9 on its November 8 snapshot, indicating overbought conditions. A pullback is possible even during a strong rally.
My assessment
I would not call HOT a confirmed buy yet. I would wait for price confirmation, particularly a sustained breakout with strong trading volume.
#HOT #BMT #ACT #CPIWatch #USJobData
HOLO (HOT)
My approach: Evaluate the recent price movement, buying and selling pressure, support and resistance, and the probability of an upward or downward move.
The key question is whether HOT is preparing for a recovery or continuing its downward trend. A price increase alone does not confirm a trend reversal.
Recent market performance
As of November 8, 2026, market feeds are showing conflicting prices:
Source HOT price 24h movement
$0.0003538 -3.88%
Investing.com $0.000462 +26.96%
$0.0004778 +33.72%
These discrepancies are significant. Verify the actual HOT/USDT exchange price before trading.
Important technical levels
Using the analysis as the reference:
Level Price
Support 1 $0.000361
Support 2 $0.000307
Resistance 1 $0.000383
A sustained move above $0.000383 would improve the bullish outlook. Losing $0.000307 would increase downside risk.
Future movement prediction
Bullish scenario: Buyers defend support and reclaim resistance, potentially starting another recovery.
Sideways scenario: HOT consolidates while buyers and sellers find balance.
Bearish scenario: Support breaks, leading to another decline.
One important warning: Investing.com reports RSI around 84.9 on its November 8 snapshot, indicating overbought conditions. A pullback is possible even during a strong rally.
My assessment
I would not call HOT a confirmed buy yet. I would wait for price confirmation, particularly a sustained breakout with strong trading volume.
#HOT #BMT #ACT #CPIWatch #USJobData
131

·
--
$HOT looks ready for another leg up 🚀
Volume is nearly double its usual average today
Entry zone 0.000387 to 0.000406
Stop 0.000377
Targets 0.000439 then 0.000464 then 0.000502
It gained 13.9 percent and is holding strong
Price is in the zone right now
Tap $HOT to buy
Last 7 days of my calls, 30 hit target and 66 hit stop
#HOT #TradingSignals
$HOT looks ready for another leg up 🚀
Volume is nearly double its usual average today
Entry zone 0.000387 to 0.000406
Stop 0.000377
Targets 0.000439 then 0.000464 then 0.000502
It gained 13.9 percent and is holding strong
Price is in the zone right now
Tap $HOT to buy
Last 7 days of my calls, 30 hit target and 66 hit stop
#HOT #TradingSignals
Volume is nearly double its usual average today
Entry zone 0.000387 to 0.000406
Stop 0.000377
Targets 0.000439 then 0.000464 then 0.000502
It gained 13.9 percent and is holding strong
Price is in the zone right now
Tap $HOT to buy
Last 7 days of my calls, 30 hit target and 66 hit stop
#HOT #TradingSignals

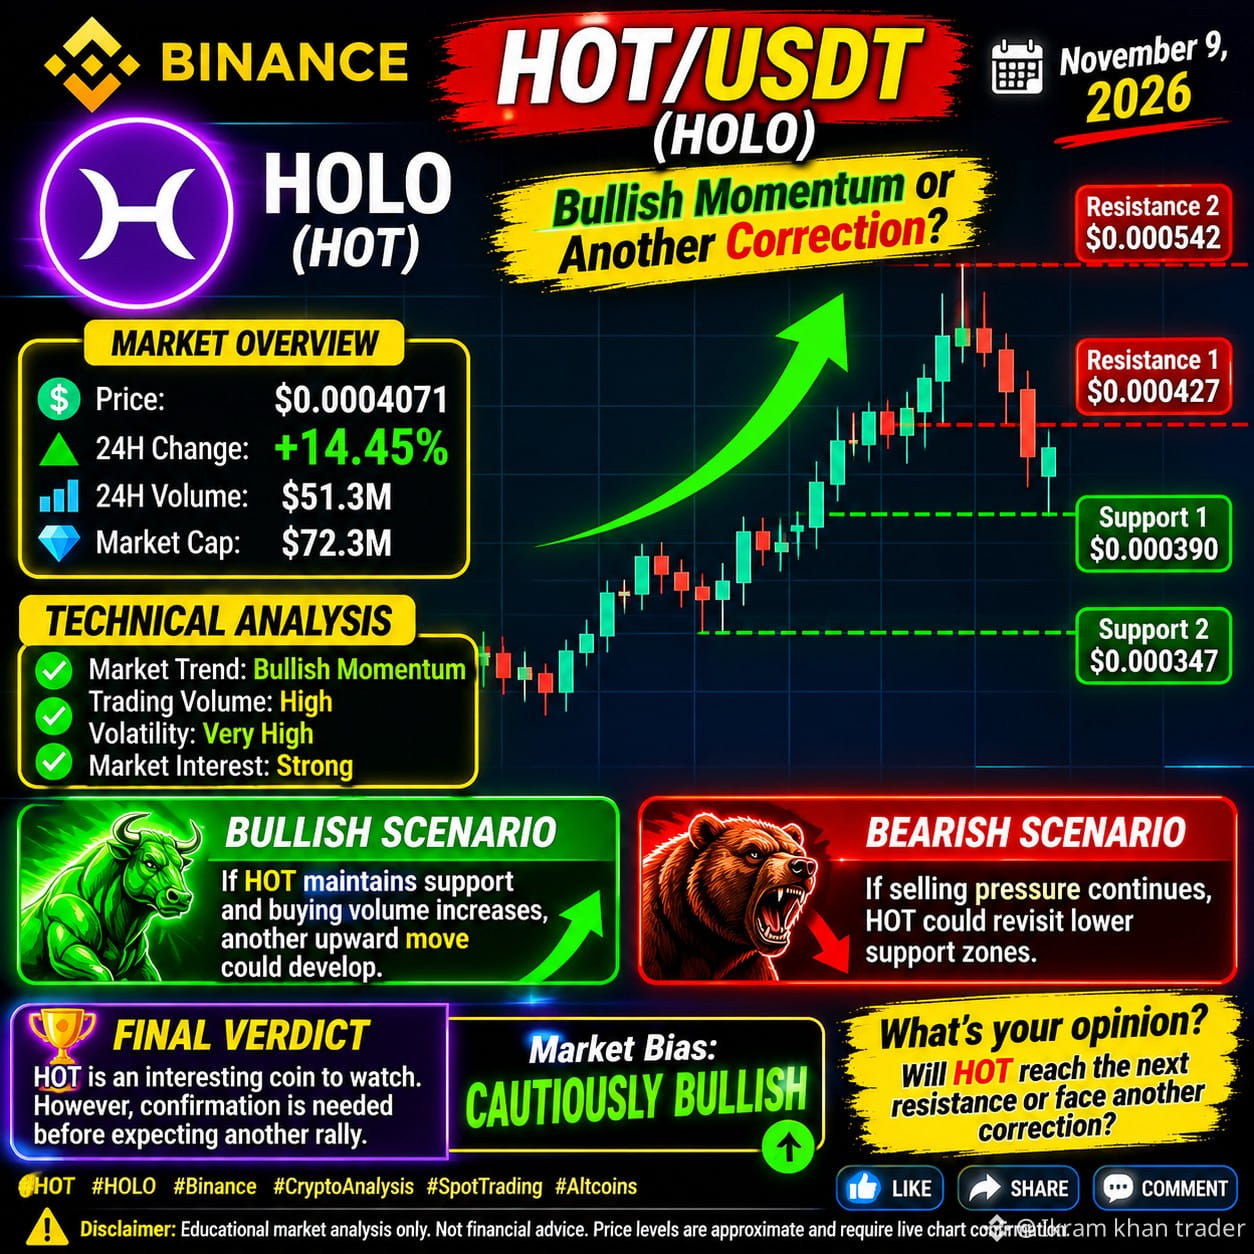
🚀🔥 HOT/USDT – COMPLETE MARKET ANALYSIS 🔥🚀
📅 November 9, 2026
Exchange: Binance Spot
💎 HOLO (HOT) – Bullish Momentum or Another Correction?
📊 MARKET OVERVIEW
$HOT
💰 Price: $0.0004071
🟢 24H Change: +14.45%
📈 24H Volume: $51.3M
💎 Market Cap: $72.3M
🎯 IMPORTANT PRICE LEVELS
🟢 Support 1: $0.000390
🟢 Support 2: $0.000347
🔴 Resistance 1: $0.000427
🔴 Resistance 2: $0.000542
📈 TECHNICAL ANALYSIS
🔥 Market Trend: Bullish Momentum
📊 Trading Volume: High
⚡ Volatility: Very High
💎 Market Interest: Strong
🟢 BULLISH SCENARIO
If HOT maintains support and buying volume increases, another upward move could develop.
🔴 BEARISH SCENARIO
If selling pressure continues, HOT could revisit lower support zones.
🏆 FINAL VERDICT
HOT is an interesting coin to watch. However, confirmation is needed before expecting another rally.
📊 Market Bias: CAUTIOUSLY BULLISH 🟢
💬 What's your opinion?
Will HOT reach the next resistance or face another correction?
👍 LIKE | 🔄 SHARE | 💬 COMMENT
#HOT #HOLO #Binance #CryptoAnalysis" is #SpotTrading. g #Altcoins #CryptoMarket #TradingSignals
🚀🔥 HOT/USDT – COMPLETE MARKET ANALYSIS 🔥🚀
📅 November 9, 2026
Exchange: Binance Spot
💎 HOLO (HOT) – Bullish Momentum or Another Correction?
📊 MARKET OVERVIEW
$HOT
💰 Price: $0.0004071
🟢 24H Change: +14.45%
📈 24H Volume: $51.3M
💎 Market Cap: $72.3M
🎯 IMPORTANT PRICE LEVELS
🟢 Support 1: $0.000390
🟢 Support 2: $0.000347
🔴 Resistance 1: $0.000427
🔴 Resistance 2: $0.000542
📈 TECHNICAL ANALYSIS
🔥 Market Trend: Bullish Momentum
📊 Trading Volume: High
⚡ Volatility: Very High
💎 Market Interest: Strong
🟢 BULLISH SCENARIO
If HOT maintains support and buying volume increases, another upward move could develop.
🔴 BEARISH SCENARIO
If selling pressure continues, HOT could revisit lower support zones.
🏆 FINAL VERDICT
HOT is an interesting coin to watch. However, confirmation is needed before expecting another rally.
📊 Market Bias: CAUTIOUSLY BULLISH 🟢
💬 What's your opinion?
Will HOT reach the next resistance or face another correction?
👍 LIKE | 🔄 SHARE | 💬 COMMENT
#HOT #HOLO #Binance #CryptoAnalysis" is #SpotTrading. g #Altcoins #CryptoMarket #TradingSignals
📅 November 9, 2026
Exchange: Binance Spot
💎 HOLO (HOT) – Bullish Momentum or Another Correction?
📊 MARKET OVERVIEW
$HOT
💰 Price: $0.0004071
🟢 24H Change: +14.45%
📈 24H Volume: $51.3M
💎 Market Cap: $72.3M
🎯 IMPORTANT PRICE LEVELS
🟢 Support 1: $0.000390
🟢 Support 2: $0.000347
🔴 Resistance 1: $0.000427
🔴 Resistance 2: $0.000542
📈 TECHNICAL ANALYSIS
🔥 Market Trend: Bullish Momentum
📊 Trading Volume: High
⚡ Volatility: Very High
💎 Market Interest: Strong
🟢 BULLISH SCENARIO
If HOT maintains support and buying volume increases, another upward move could develop.
🔴 BEARISH SCENARIO
If selling pressure continues, HOT could revisit lower support zones.
🏆 FINAL VERDICT
HOT is an interesting coin to watch. However, confirmation is needed before expecting another rally.
📊 Market Bias: CAUTIOUSLY BULLISH 🟢
💬 What's your opinion?
Will HOT reach the next resistance or face another correction?
👍 LIKE | 🔄 SHARE | 💬 COMMENT
#HOT #HOLO #Binance #CryptoAnalysis" is #SpotTrading. g #Altcoins #CryptoMarket #TradingSignals
126

·
--
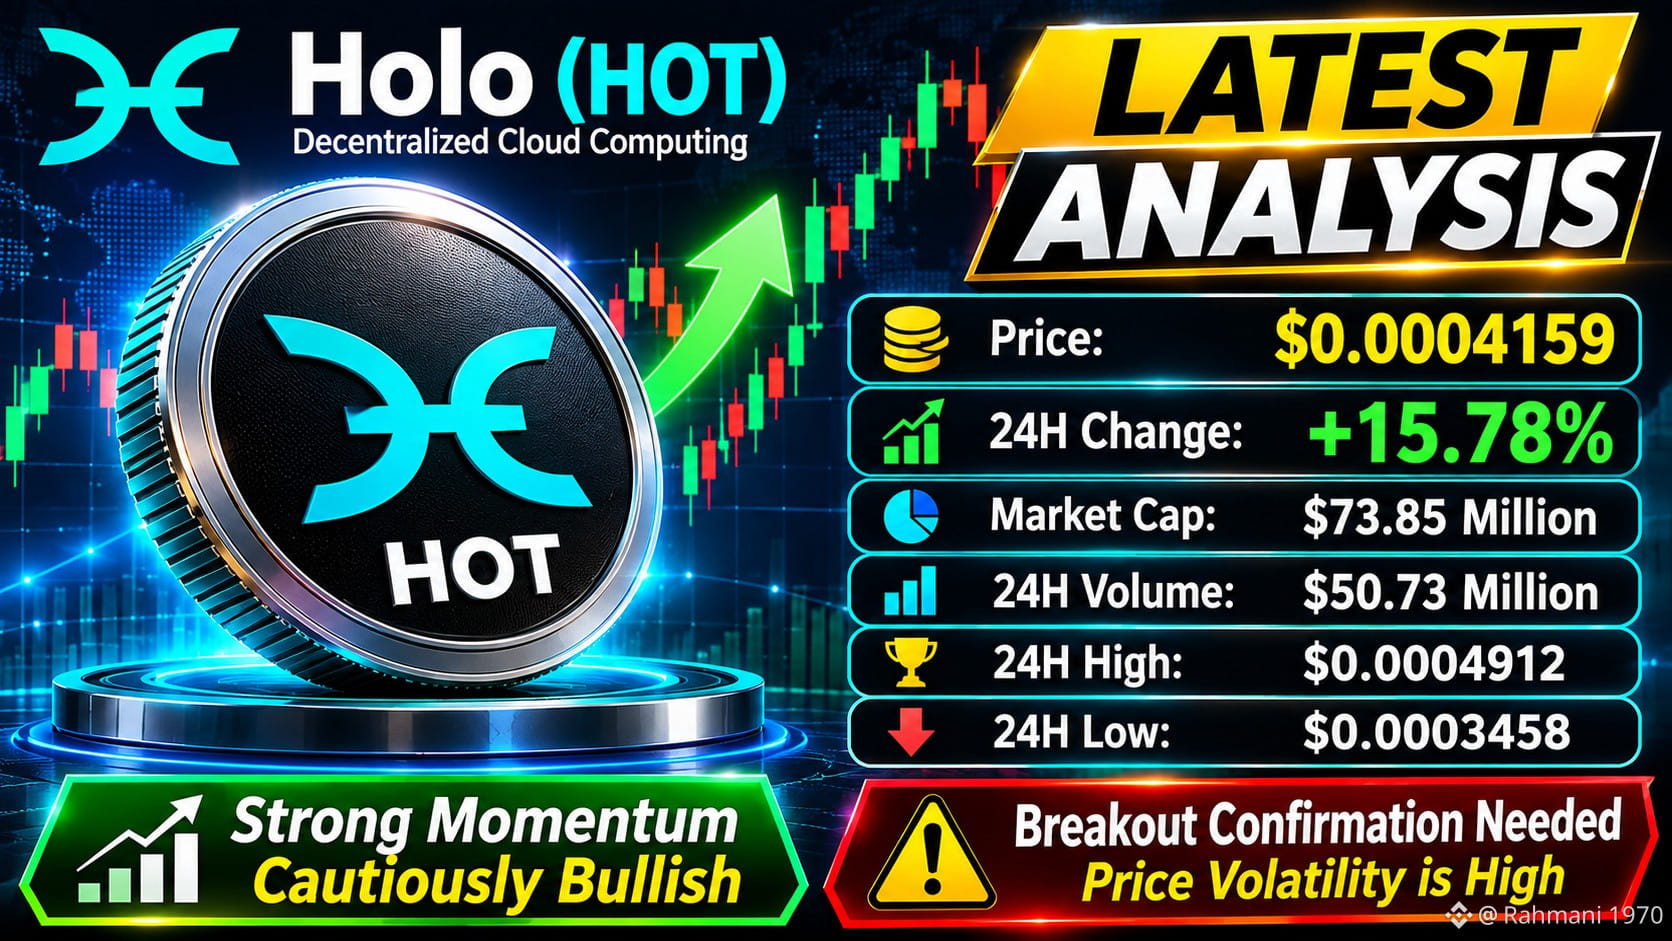
🚀 $HOT Surges 15.78% — Is Holo Starting a New Rally?
Holo ($HOT ) is trading around $0.0004159, gaining 15.78% over 24 hours.
📊 Market Snapshot:
Market Cap: $73.85M
24H Volume: $50.73M
24H High: $0.0004912
24H Low: $0.0003458
Trading activity has increased significantly, suggesting renewed market interest. However, the rally needs confirmation, and volatility remains high.
Market Watch: Can HOT sustain its upward momentum?
#HOT #Holo #CryptoAnalysis #Altcoins👀🚀 #BinanceSquare
{spot}(HOTUSDT)
🚀 $HOT Surges 15.78% — Is Holo Starting a New Rally?
Holo ($HOT ) is trading around $0.0004159, gaining 15.78% over 24 hours.
📊 Market Snapshot:
Market Cap: $73.85M
24H Volume: $50.73M
24H High: $0.0004912
24H Low: $0.0003458
Trading activity has increased significantly, suggesting renewed market interest. However, the rally needs confirmation, and volatility remains high.
Market Watch: Can HOT sustain its upward momentum?
#HOT #Holo #CryptoAnalysis #Altcoins👀🚀 #BinanceSquare
Holo ($HOT ) is trading around $0.0004159, gaining 15.78% over 24 hours.
📊 Market Snapshot:
Market Cap: $73.85M
24H Volume: $50.73M
24H High: $0.0004912
24H Low: $0.0003458
Trading activity has increased significantly, suggesting renewed market interest. However, the rally needs confirmation, and volatility remains high.
Market Watch: Can HOT sustain its upward momentum?
#HOT #Holo #CryptoAnalysis #Altcoins👀🚀 #BinanceSquare
165

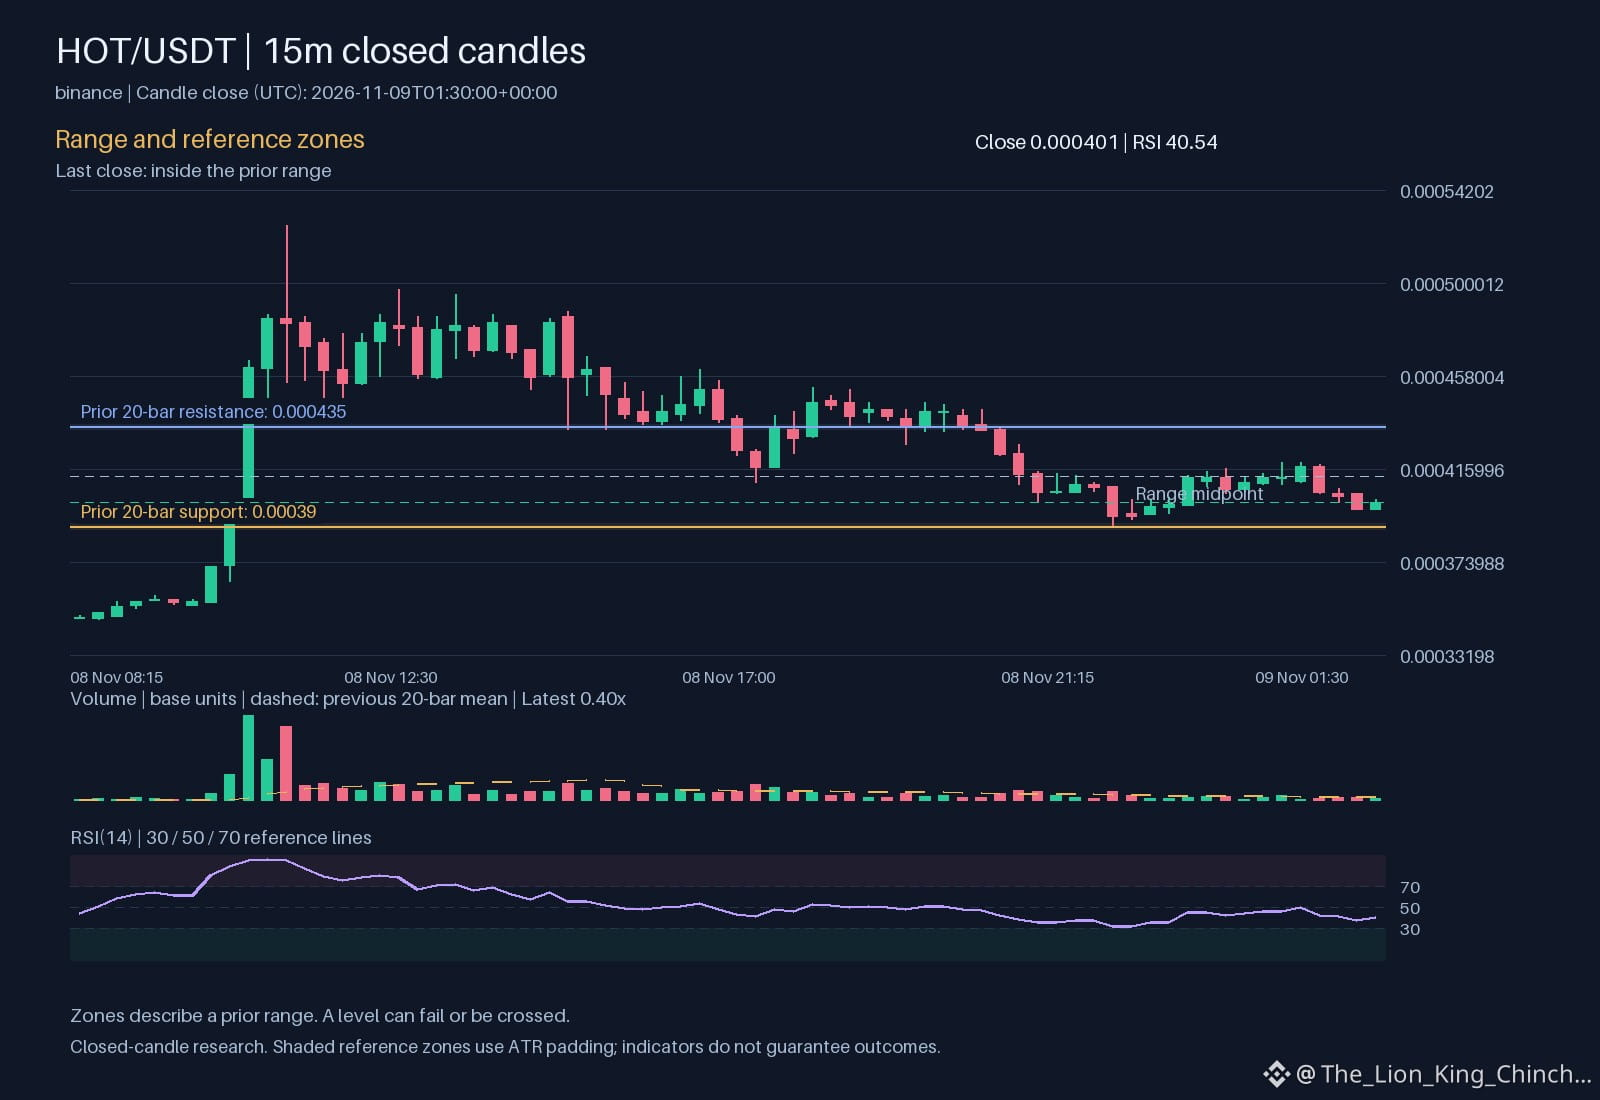
$HOT: Close vs Retest
What distinguishes a genuine breakout from a false start when ${ticker} moves downward with volume not above baseline? The core question for ${ticker} is whether an hourly direction down holds structural support or merely reflects temporary liquidity. The clue here is that price sits inside the recorded range while daily volume remains moderate. This setup suggests caution rather than urgency. A clean close below support might confirm momentum, but without expanded volume, such a move could be weak. The alternative reading is that the current decline is a patient retest. In this scenario, sellers exhaust their orders near support, allowing buyers to step in. This interpretation relies on price holding the lower boundary despite downward pressure. What would weaken the breakout view? If price tags support and rebounds quickly without significant volume spikes, the initial downside move lacks conviction. Conversely, what weakens the retest theory? If the asset collapses through support with sustained volume above average, the floor has failed. A specific way to reassess this is to watch the interaction between price and the average true range. If the distance from price to support is smaller than the typical hourly range, a retest is more likely to persist. If the gap is wider, a clean close becomes plausible. Distinguishing these scenarios requires observing how trade size changes as price approaches key levels. Note that these are conditional mechanisms, not predictions. The current observation remains a downward hourly direction with moderate activity. Traders should avoid assuming direction solely from price movement. The presence of moderate volume hints at indecision. Whether this resolves into a strong close or a stabilizing retest depends on participant behavior at support. The market dynamics for ${ticker} currently favor patience over impulse.
Probabilistic market research, not a recommendation or guaranteed return.
What would convince you: a clean close or a patient retest?
#HOT
$HOT : Close vs Retest
What distinguishes a genuine breakout from a false start when ${ticker} moves downward with volume not above baseline? The core question for ${ticker} is whether an hourly direction down holds structural support or merely reflects temporary liquidity. The clue here is that price sits inside the recorded range while daily volume remains moderate. This setup suggests caution rather than urgency. A clean close below support might confirm momentum, but without expanded volume, such a move could be weak. The alternative reading is that the current decline is a patient retest. In this scenario, sellers exhaust their orders near support, allowing buyers to step in. This interpretation relies on price holding the lower boundary despite downward pressure. What would weaken the breakout view? If price tags support and rebounds quickly without significant volume spikes, the initial downside move lacks conviction. Conversely, what weakens the retest theory? If the asset collapses through support with sustained volume above average, the floor has failed. A specific way to reassess this is to watch the interaction between price and the average true range. If the distance from price to support is smaller than the typical hourly range, a retest is more likely to persist. If the gap is wider, a clean close becomes plausible. Distinguishing these scenarios requires observing how trade size changes as price approaches key levels. Note that these are conditional mechanisms, not predictions. The current observation remains a downward hourly direction with moderate activity. Traders should avoid assuming direction solely from price movement. The presence of moderate volume hints at indecision. Whether this resolves into a strong close or a stabilizing retest depends on participant behavior at support. The market dynamics for ${ticker} currently favor patience over impulse.
Probabilistic market research, not a recommendation or guaranteed return.
What would convince you: a clean close or a patient retest?
#HOT
What distinguishes a genuine breakout from a false start when ${ticker} moves downward with volume not above baseline? The core question for ${ticker} is whether an hourly direction down holds structural support or merely reflects temporary liquidity. The clue here is that price sits inside the recorded range while daily volume remains moderate. This setup suggests caution rather than urgency. A clean close below support might confirm momentum, but without expanded volume, such a move could be weak. The alternative reading is that the current decline is a patient retest. In this scenario, sellers exhaust their orders near support, allowing buyers to step in. This interpretation relies on price holding the lower boundary despite downward pressure. What would weaken the breakout view? If price tags support and rebounds quickly without significant volume spikes, the initial downside move lacks conviction. Conversely, what weakens the retest theory? If the asset collapses through support with sustained volume above average, the floor has failed. A specific way to reassess this is to watch the interaction between price and the average true range. If the distance from price to support is smaller than the typical hourly range, a retest is more likely to persist. If the gap is wider, a clean close becomes plausible. Distinguishing these scenarios requires observing how trade size changes as price approaches key levels. Note that these are conditional mechanisms, not predictions. The current observation remains a downward hourly direction with moderate activity. Traders should avoid assuming direction solely from price movement. The presence of moderate volume hints at indecision. Whether this resolves into a strong close or a stabilizing retest depends on participant behavior at support. The market dynamics for ${ticker} currently favor patience over impulse.
Probabilistic market research, not a recommendation or guaranteed return.
What would convince you: a clean close or a patient retest?
#HOT
144

·
--
EXCLUSIVE VIP ALPHA SETUP: PRECISION BREAKOUT ENTRY CONFIRMED
🎯 VIP ALPHA SIGNAL: $HOT
📈 Momentum: +12.71%
🟢 Entry: 0.000397005
🎯 Target (TP): 0.00043092
🛑 Stop Loss (SL): 0.00037506
Maintain strict risk management with this 1:1.5 Risk-to-Reward structure, allowing the price action to trigger your entry naturally rather than chasing green candles.
Are you taking this setup on the retest or watching from the sidelines? Drop your targets in the comments below! 👇📊
#HOT #PriceAction #CryptoTrading #CryptoNews
EXCLUSIVE VIP ALPHA SETUP: PRECISION BREAKOUT ENTRY CONFIRMED
🎯 VIP ALPHA SIGNAL: $HOT
📈 Momentum: +12.71%
🟢 Entry: 0.000397005
🎯 Target (TP): 0.00043092
🛑 Stop Loss (SL): 0.00037506
Maintain strict risk management with this 1:1.5 Risk-to-Reward structure, allowing the price action to trigger your entry naturally rather than chasing green candles.
Are you taking this setup on the retest or watching from the sidelines? Drop your targets in the comments below! 👇📊
#HOT #PriceAction #CryptoTrading #CryptoNews
🎯 VIP ALPHA SIGNAL: $HOT
📈 Momentum: +12.71%
🟢 Entry: 0.000397005
🎯 Target (TP): 0.00043092
🛑 Stop Loss (SL): 0.00037506
Maintain strict risk management with this 1:1.5 Risk-to-Reward structure, allowing the price action to trigger your entry naturally rather than chasing green candles.
Are you taking this setup on the retest or watching from the sidelines? Drop your targets in the comments below! 👇📊
#HOT #PriceAction #CryptoTrading #CryptoNews
116

·
--
{spot}(HOTUSDT)
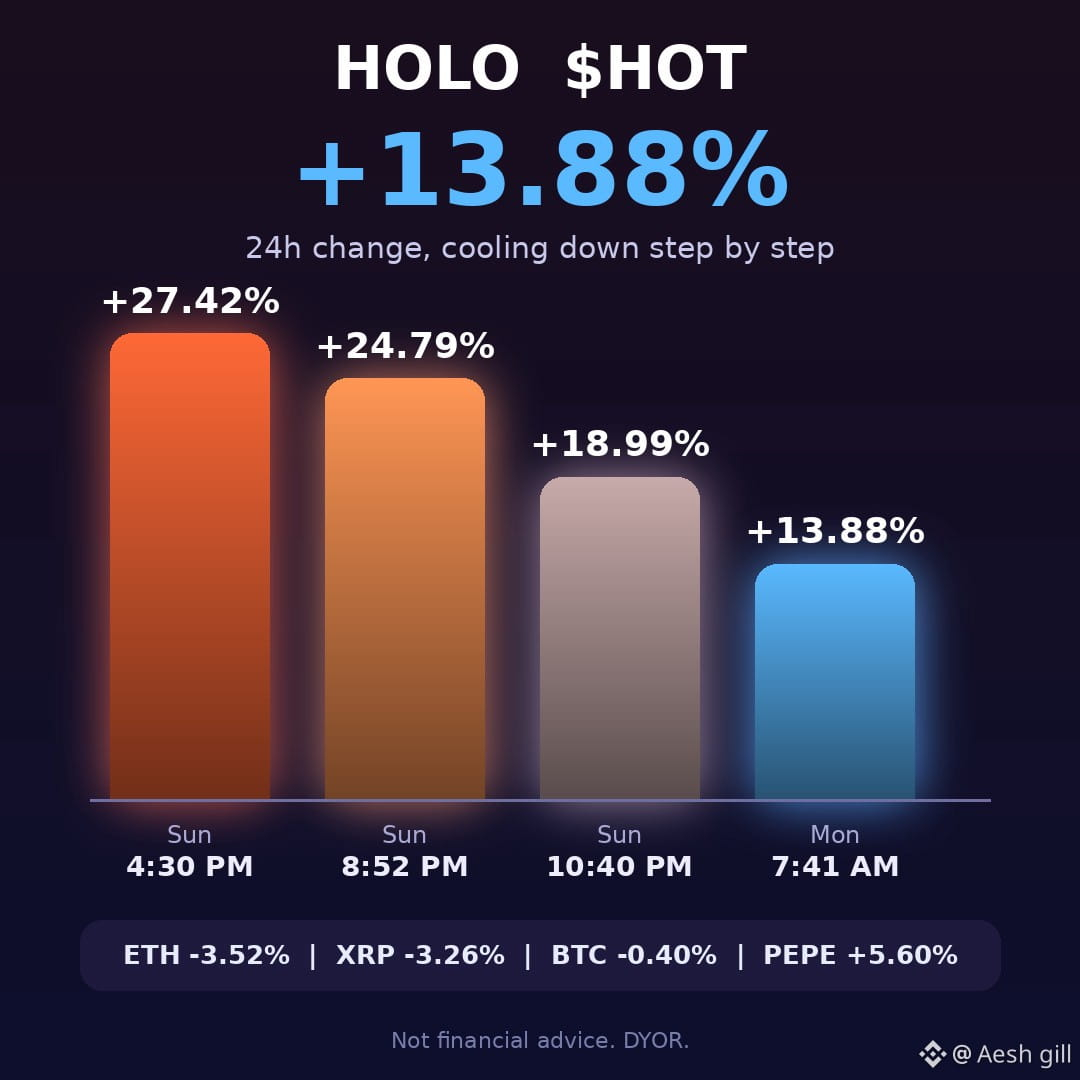
🔥 Holo ($HOT ) is cooling: +27% to +14% since yesterday afternoon 👀
As of 7:41AM (PKT), $HOT is +13.88% in 24h at about $0.000402
The 24h change trail:
• Sun 4:30 PM: +27.42%
• Sun 8:52 PM: +24.79%
• Sun 10:40 PM: +18.99%
• Mon 7:38 AM: +13.88%
The price is ~13% below where it was Sunday at 4:30 PM ($0.00046).
Meanwhile, the majors are red:
• ETH: -3.52%
• XRP: -3.26%
• SOL: -0.89%
• BTC: -0.40%
Only PEPE (+5.60%) is joining HOT in the green.
⚠️ A cooling pump can keep cooling. Check volume, don't average down blindly, and only risk what you can afford to lose.
Is $HOT a dip worth watching, or is the momentum over? 👇
#Holo #HOT #Binance
Not financial advice. DYOR.
🔥 Holo ($HOT ) is cooling: +27% to +14% since yesterday afternoon 👀
As of 7:41AM (PKT), $HOT is +13.88% in 24h at about $0.000402
The 24h change trail:
• Sun 4:30 PM: +27.42%
• Sun 8:52 PM: +24.79%
• Sun 10:40 PM: +18.99%
• Mon 7:38 AM: +13.88%
The price is ~13% below where it was Sunday at 4:30 PM ($0.00046).
Meanwhile, the majors are red:
• ETH: -3.52%
• XRP: -3.26%
• SOL: -0.89%
• BTC: -0.40%
Only PEPE (+5.60%) is joining HOT in the green.
⚠️ A cooling pump can keep cooling. Check volume, don't average down blindly, and only risk what you can afford to lose.
Is $HOT a dip worth watching, or is the momentum over? 👇
#Holo #HOT #Binance
Not financial advice. DYOR.
As of 7:41AM (PKT), $HOT is +13.88% in 24h at about $0.000402
The 24h change trail:
• Sun 4:30 PM: +27.42%
• Sun 8:52 PM: +24.79%
• Sun 10:40 PM: +18.99%
• Mon 7:38 AM: +13.88%
The price is ~13% below where it was Sunday at 4:30 PM ($0.00046).
Meanwhile, the majors are red:
• ETH: -3.52%
• XRP: -3.26%
• SOL: -0.89%
• BTC: -0.40%
Only PEPE (+5.60%) is joining HOT in the green.
⚠️ A cooling pump can keep cooling. Check volume, don't average down blindly, and only risk what you can afford to lose.
Is $HOT a dip worth watching, or is the momentum over? 👇
#Holo #HOT #Binance
Not financial advice. DYOR.
95

🚨 SMART MONEY IS QUIETLY UNLOADING $HOT WHILE THE BROADER MARKET SLEEPS! 💥
Big capital is quietly shifting gears as institutional heavyweights shed billions in tech exposure while index numbers look deceptively calm. 📊
Beneath the surface, heavy distribution is outpacing new shorts by a wide margin, proving that smart money is locking in profits rather than chasing overextended moves. ⚡
I am tracking this underlying rotation closely for signs of seller exhaustion before looking for high-probability setups. 🔍 Are you positioning defensively here or waiting for the flush to complete? 👇
⚠️ Not financial advice. Always manage your risk. 🛡️
🏷️ #HOT #MarketCorrection #SmartMoney #Crypto
🔥 💎
🚨 SMART MONEY IS QUIETLY UNLOADING $HOT WHILE THE BROADER MARKET SLEEPS! 💥
Big capital is quietly shifting gears as institutional heavyweights shed billions in tech exposure while index numbers look deceptively calm. 📊
Beneath the surface, heavy distribution is outpacing new shorts by a wide margin, proving that smart money is locking in profits rather than chasing overextended moves. ⚡
I am tracking this underlying rotation closely for signs of seller exhaustion before looking for high-probability setups. 🔍 Are you positioning defensively here or waiting for the flush to complete? 👇
⚠️ Not financial advice. Always manage your risk. 🛡️
🏷️ #HOT #MarketCorrection #SmartMoney #Crypto
🔥 💎
Big capital is quietly shifting gears as institutional heavyweights shed billions in tech exposure while index numbers look deceptively calm. 📊
Beneath the surface, heavy distribution is outpacing new shorts by a wide margin, proving that smart money is locking in profits rather than chasing overextended moves. ⚡
I am tracking this underlying rotation closely for signs of seller exhaustion before looking for high-probability setups. 🔍 Are you positioning defensively here or waiting for the flush to complete? 👇
⚠️ Not financial advice. Always manage your risk. 🛡️
🏷️ #HOT #MarketCorrection #SmartMoney #Crypto
🔥 💎

Log in to explore more content
Join global crypto users on Binance Square
⚡️ Get latest and useful information about crypto.
💬 Trusted by the world’s largest crypto exchange.
👍 Discover real insights from verified creators.
Email / Phone number
Trending Topics
1
#BitcoinFiveWeeklyLosses
10,803 views
378 Discussing
2
#AIChipSlumpNasdaq
6,197 views
201 Discussing
3
#NvidiaInvestigatesAfterHuang’sAffairApology
3,908 views
103 Discussing
4
#BinanceReopensWithdrawalsForHYPE&APT
161,892 views
1,266 Discussing
5
#SouthKoreaDraftLawTargets15To20%ShareholderCap
163,428 views
860 Discussing
6
#TradFiForBeginners
234,625 views
2,124 Discussing
7
#KeplrAdvisesSocialLoginUsersToTransferAssets
76,387 views
615 Discussing
8
#TetherPlans€28.8MForJuventusCapitalIncrease
55,956 views
455 Discussing
9
#JobsReportRaisesHikeOdds
986,461 views
4,595 Discussing
10
#CPITestsDecemberRateOutlook
449,809 views
2,016 Discussing