
#tslab
tslab
39,456 views
847 Discussing
Hot
Latest

·
--
Electric Edge: $TSLAB Holds Ground on Binance Spot ⚡
Price action: $TSLAB is trading at $359.06 on Binance Spot, up 3.04% over the past 24 hours.
Why it matters: Tesla’s accelerating EV demand and the upcoming Q4 production ramp keep the stock in focus for growth‑oriented investors.
Key levels – Support defense:
- Primary support at $350.00 (floor to watch)
- Mid‑range pivot around $360.00
- Near‑term resistance near $370.00
Short outlook: Buyers must defend the $350 support; a hold signals continued upside toward $370. A break below $350 could trigger a deeper correction, opening the path to $340 and beyond.
#TSLAB #Stocks #BinanceSquare
Electric Edge: $TSLAB Holds Ground on Binance Spot ⚡
Price action: $TSLAB is trading at $359.06 on Binance Spot, up 3.04% over the past 24 hours.
Why it matters: Tesla’s accelerating EV demand and the upcoming Q4 production ramp keep the stock in focus for growth‑oriented investors.
Key levels – Support defense:
- Primary support at $350.00 (floor to watch)
- Mid‑range pivot around $360.00
- Near‑term resistance near $370.00
Short outlook: Buyers must defend the $350 support; a hold signals continued upside toward $370. A break below $350 could trigger a deeper correction, opening the path to $340 and beyond.
#TSLAB #Stocks #BinanceSquare
Price action: $TSLAB is trading at $359.06 on Binance Spot, up 3.04% over the past 24 hours.
Why it matters: Tesla’s accelerating EV demand and the upcoming Q4 production ramp keep the stock in focus for growth‑oriented investors.
Key levels – Support defense:
- Primary support at $350.00 (floor to watch)
- Mid‑range pivot around $360.00
- Near‑term resistance near $370.00
Short outlook: Buyers must defend the $350 support; a hold signals continued upside toward $370. A break below $350 could trigger a deeper correction, opening the path to $340 and beyond.
#TSLAB #Stocks #BinanceSquare
26

·
--
$TSLAB looks ready to go up from here
It is up 5.6 percent today and holding
Entry zone 357.1086 to 360.3979
Stop 345.7471
Targets 380.7293 then 394.7221 then 415.7114
RSI is at 57 so it is strong but safe
Price is sitting right near today's high
Price is in the zone right now
Tap $TSLAB to buy
#TSLAB #TradingSignals
$TSLAB looks ready to go up from here
It is up 5.6 percent today and holding
Entry zone 357.1086 to 360.3979
Stop 345.7471
Targets 380.7293 then 394.7221 then 415.7114
RSI is at 57 so it is strong but safe
Price is sitting right near today's high
Price is in the zone right now
Tap $TSLAB to buy
#TSLAB #TradingSignals
It is up 5.6 percent today and holding
Entry zone 357.1086 to 360.3979
Stop 345.7471
Targets 380.7293 then 394.7221 then 415.7114
RSI is at 57 so it is strong but safe
Price is sitting right near today's high
Price is in the zone right now
Tap $TSLAB to buy
#TSLAB #TradingSignals
1

·
--
🔍 $TSLAB Price Gain Breakdown
5 min: +0.00%
1h: -0.03%
4h: -0.03%
24h: +4.78%
Current price: 359.39, 24h trading volume: $5.24 million
Up +4.78% in a single day, with gains spread across the day rather than concentrated in a short period—more like a gradual, steady climb.
Do you think this is a genuine breakout or a pump-and-dump? 👇
(Data breakdown, not investment advice. DYOR)
#TSLAB
🔍 $TSLAB Price Gain Breakdown
5 min: +0.00%
1h: -0.03%
4h: -0.03%
24h: +4.78%
Current price: 359.39, 24h trading volume: $5.24 million
Up +4.78% in a single day, with gains spread across the day rather than concentrated in a short period—more like a gradual, steady climb.
Do you think this is a genuine breakout or a pump-and-dump? 👇
(Data breakdown, not investment advice. DYOR)
#TSLAB
5 min: +0.00%
1h: -0.03%
4h: -0.03%
24h: +4.78%
Current price: 359.39, 24h trading volume: $5.24 million
Up +4.78% in a single day, with gains spread across the day rather than concentrated in a short period—more like a gradual, steady climb.
Do you think this is a genuine breakout or a pump-and-dump? 👇
(Data breakdown, not investment advice. DYOR)
#TSLAB

·
--

Article
TSLAB|Methodology Breakdown|2026-11-07💡 One detail caught my eye: $TSLAB PRICE_CHANGE_24H reading: 358.74. The 24h rolling price change is +5.7330%, reaching the 5% observation threshold; this does not predict price direction
📊 Data Snapshot
· Metric: PRICE_CHANGE_24H
· Reading: 358.74
· Methodology: Calculated from historical prices of closed candlesticks
A seasoned trader's habit: let volume speak before price—I’ve been watching this one for a long time
Share your thoughts in the comments 👇
## How to interpret this data
This observation is calculated from the sequence of closed candlesticks provided by the source interface. The metric is a mathematical transformation of historical prices; it describes only the point in time when it was observed, does not predict price direction, and is not a buy or sell instruction.
TSLAB|Methodology Breakdown|2026-11-07
💡 One detail caught my eye: $TSLAB PRICE_CHANGE_24H reading: 358.74. The 24h rolling price change is +5.7330%, reaching the 5% observation threshold; this does not predict price direction
📊 Data Snapshot
· Metric: PRICE_CHANGE_24H
· Reading: 358.74
· Methodology: Calculated from historical prices of closed candlesticks
A seasoned trader's habit: let volume speak before price—I’ve been watching this one for a long time
Share your thoughts in the comments 👇
## How to interpret this data
This observation is calculated from the sequence of closed candlesticks provided by the source interface. The metric is a mathematical transformation of historical prices; it describes only the point in time when it was observed, does not predict price direction, and is not a buy or sell instruction.
📊 Data Snapshot
· Metric: PRICE_CHANGE_24H
· Reading: 358.74
· Methodology: Calculated from historical prices of closed candlesticks
A seasoned trader's habit: let volume speak before price—I’ve been watching this one for a long time
Share your thoughts in the comments 👇
## How to interpret this data
This observation is calculated from the sequence of closed candlesticks provided by the source interface. The metric is a mathematical transformation of historical prices; it describes only the point in time when it was observed, does not predict price direction, and is not a buy or sell instruction.

·
--
🚨 TSLAB keeps falling! The 24H loss has widened to 10.5%, and late entrants are still facing downward pressure!
But what’s truly worth watching out for is this: On social platform X, there are currently 0/0 KOLs, and BSQ is only 3. Both the price and market attention are weak, and the data is pending verification.
📊 What does this mean? Those hoping to buy the dip may not have entered yet, while those who bought in at higher prices are being forced to absorb the pullback. Getting the direction right isn’t hard—the hard part is not being the last one left holding the bag.
My take: Short-term outlook is bearish. Absolutely don’t average down blindly! Wait and see until the downtrend stops. Only consider whether the trend is reversing if strong buying support returns and social interest picks up.
Do you think TSLAB will keep sliding, or will a rebound find support out of nowhere? 👇 #TSLAB #cryptocurrency
🚨 TSLAB keeps falling! The 24H loss has widened to 10.5%, and late entrants are still facing downward pressure!
But what’s truly worth watching out for is this: On social platform X, there are currently 0/0 KOLs, and BSQ is only 3. Both the price and market attention are weak, and the data is pending verification.
📊 What does this mean? Those hoping to buy the dip may not have entered yet, while those who bought in at higher prices are being forced to absorb the pullback. Getting the direction right isn’t hard—the hard part is not being the last one left holding the bag.
My take: Short-term outlook is bearish. Absolutely don’t average down blindly! Wait and see until the downtrend stops. Only consider whether the trend is reversing if strong buying support returns and social interest picks up.
Do you think TSLAB will keep sliding, or will a rebound find support out of nowhere? 👇 #TSLAB #cryptocurrency
But what’s truly worth watching out for is this: On social platform X, there are currently 0/0 KOLs, and BSQ is only 3. Both the price and market attention are weak, and the data is pending verification.
📊 What does this mean? Those hoping to buy the dip may not have entered yet, while those who bought in at higher prices are being forced to absorb the pullback. Getting the direction right isn’t hard—the hard part is not being the last one left holding the bag.
My take: Short-term outlook is bearish. Absolutely don’t average down blindly! Wait and see until the downtrend stops. Only consider whether the trend is reversing if strong buying support returns and social interest picks up.
Do you think TSLAB will keep sliding, or will a rebound find support out of nowhere? 👇 #TSLAB #cryptocurrency
·
--
Electric Pulse: $TSLAB Slides on Binance Spot ⚡📉
Price action – $TSLAB is trading at $380.60 on Binance Spot, down 5.81 % over the past 24 h with modest volume. The drop reflects a stretched rally in the EV sector as investors digest broader market caution.
Key levels – Immediate support sits near $365, the prior swing low that anchored the last correction. Mid‑range equilibrium is around $380, acting as a pivot for current price action. The nearest resistance cluster is at $395; a clean break above could reopen upside bias, while a retest of $365 would likely trigger further downside pressure.
Short outlook – Cautious. The recent pullback appears overstretched; watch for a bounce back to the $380‑$385 zone before any renewed advance. A decisive move below $365 would suggest the downtrend may resume, aligning with the analyst’s view of a needed pullback to support.
#TSLAB #Tesla #BinanceSquare
Electric Pulse: $TSLAB Slides on Binance Spot ⚡📉
Price action – $TSLAB is trading at $380.60 on Binance Spot, down 5.81 % over the past 24 h with modest volume. The drop reflects a stretched rally in the EV sector as investors digest broader market caution.
Key levels – Immediate support sits near $365, the prior swing low that anchored the last correction. Mid‑range equilibrium is around $380, acting as a pivot for current price action. The nearest resistance cluster is at $395; a clean break above could reopen upside bias, while a retest of $365 would likely trigger further downside pressure.
Short outlook – Cautious. The recent pullback appears overstretched; watch for a bounce back to the $380‑$385 zone before any renewed advance. A decisive move below $365 would suggest the downtrend may resume, aligning with the analyst’s view of a needed pullback to support.
#TSLAB #Tesla #BinanceSquare
Price action – $TSLAB is trading at $380.60 on Binance Spot, down 5.81 % over the past 24 h with modest volume. The drop reflects a stretched rally in the EV sector as investors digest broader market caution.
Key levels – Immediate support sits near $365, the prior swing low that anchored the last correction. Mid‑range equilibrium is around $380, acting as a pivot for current price action. The nearest resistance cluster is at $395; a clean break above could reopen upside bias, while a retest of $365 would likely trigger further downside pressure.
Short outlook – Cautious. The recent pullback appears overstretched; watch for a bounce back to the $380‑$385 zone before any renewed advance. A decisive move below $365 would suggest the downtrend may resume, aligning with the analyst’s view of a needed pullback to support.
#TSLAB #Tesla #BinanceSquare
29

·
--
⚠️ Recently, TSLAB has been like a sail gently brushed by a breeze—dipping slightly, but still sailing. If you spot subtle signs of a decline, what clue would you look for first to determine whether it’s a temporary pullback or the start of a new consolidation? 🔍
🪙 A gentle reminder: Pay attention to the rhythm of trading volume, and don’t let emotions lead you.
This is not investment advice.
#加密社区 #币圈观察 #TSLAB #行情聊聊 #Write2Earn
⚠️ Recently, TSLAB has been like a sail gently brushed by a breeze—dipping slightly, but still sailing. If you spot subtle signs of a decline, what clue would you look for first to determine whether it’s a temporary pullback or the start of a new consolidation? 🔍
🪙 A gentle reminder: Pay attention to the rhythm of trading volume, and don’t let emotions lead you.
This is not investment advice.
#加密社区 #币圈观察 #TSLAB #行情聊聊 #Write2Earn
🪙 A gentle reminder: Pay attention to the rhythm of trading volume, and don’t let emotions lead you.
This is not investment advice.
#加密社区 #币圈观察 #TSLAB #行情聊聊 #Write2Earn
1

·
--
Bullish
⚡ Tesla just did something nobody priced in.
$408, +32% in 3 months — but still -8.6% YTD. $TSLAB
Q3: 486K deliveries, down 2%. Revenue $28B.
So why the bid? FSD on 75% of US deliveries. Cybercab rides live in Texas. Barclays says a SpaceX tie-up is now "key" to the bull case.
This isn't a car stock anymore. It's an AI bet.
👉 Tap $TSLAB to trade Tesla 24/7 from $5 — even after the bell.
Not financial advice.
#Tesla #TSLAB #RWA #BinanceAlphaAlert
{spot}(TSLABUSDT)
⚡ Tesla just did something nobody priced in.
$408, +32% in 3 months — but still -8.6% YTD. $TSLAB
Q3: 486K deliveries, down 2%. Revenue $28B.
So why the bid? FSD on 75% of US deliveries. Cybercab rides live in Texas. Barclays says a SpaceX tie-up is now "key" to the bull case.
This isn't a car stock anymore. It's an AI bet.
👉 Tap $TSLAB to trade Tesla 24/7 from $5 — even after the bell.
Not financial advice.
#Tesla #TSLAB #RWA #BinanceAlphaAlert
$408, +32% in 3 months — but still -8.6% YTD. $TSLAB
Q3: 486K deliveries, down 2%. Revenue $28B.
So why the bid? FSD on 75% of US deliveries. Cybercab rides live in Texas. Barclays says a SpaceX tie-up is now "key" to the bull case.
This isn't a car stock anymore. It's an AI bet.
👉 Tap $TSLAB to trade Tesla 24/7 from $5 — even after the bell.
Not financial advice.
#Tesla #TSLAB #RWA #BinanceAlphaAlert

1
1
104

·
--
$TSLAB +0.73% | $SPCXB +0.70% | $牛来 +0.62%
#TSLAB nudges to $403.38, up +0.73% on roughly $1.5 M of volume. The modest rise suggests steady buying pressure rather than a breakout.
#SPCXB trades at $138.66, gaining +0.70% with $18.0 M moving hands. The larger flow hints at broader interest despite the small price bump.
#牛来 climbs to $0.0702, up +0.62% on $9.4 M of volume. Its incremental gain paired with solid liquidity could set the stage for a short‑term push. 📈
Watch the divergence between SPCXB’s hefty volume and the tighter trades of TSLAB, which may signal where momentum will consolidate.
#Write2Earn #Binance
$TSLAB +0.73% | $SPCXB +0.70% | $牛来 +0.62%
#TSLAB nudges to $403.38, up +0.73% on roughly $1.5 M of volume. The modest rise suggests steady buying pressure rather than a breakout.
#SPCXB trades at $138.66, gaining +0.70% with $18.0 M moving hands. The larger flow hints at broader interest despite the small price bump.
#牛来 climbs to $0.0702, up +0.62% on $9.4 M of volume. Its incremental gain paired with solid liquidity could set the stage for a short‑term push. 📈
Watch the divergence between SPCXB’s hefty volume and the tighter trades of TSLAB, which may signal where momentum will consolidate.
#Write2Earn #Binance
#TSLAB nudges to $403.38, up +0.73% on roughly $1.5 M of volume. The modest rise suggests steady buying pressure rather than a breakout.
#SPCXB trades at $138.66, gaining +0.70% with $18.0 M moving hands. The larger flow hints at broader interest despite the small price bump.
#牛来 climbs to $0.0702, up +0.62% on $9.4 M of volume. Its incremental gain paired with solid liquidity could set the stage for a short‑term push. 📈
Watch the divergence between SPCXB’s hefty volume and the tighter trades of TSLAB, which may signal where momentum will consolidate.
#Write2Earn #Binance
9
·
--
$TSLAB +0.83% | $SPCXB +0.75% | $ETH +0.65%
#TSLAB trades at $403.91, gaining +0.83% with about $1.5 M of volume.
#SPCXB is priced at $138.86, up +0.75% on a solid $17.5 M of daily volume.
#ETH sits at $2,287.15, climbing +0.65% and moving $434.9 M in trade.
📊 The modest price lifts across all three come with noticeably different liquidity levels, which could affect how quickly any further moves sustain.
#Write2Earn #Binance
$TSLAB +0.83% | $SPCXB +0.75% | $ETH +0.65%
#TSLAB trades at $403.91, gaining +0.83% with about $1.5 M of volume.
#SPCXB is priced at $138.86, up +0.75% on a solid $17.5 M of daily volume.
#ETH sits at $2,287.15, climbing +0.65% and moving $434.9 M in trade.
📊 The modest price lifts across all three come with noticeably different liquidity levels, which could affect how quickly any further moves sustain.
#Write2Earn #Binance
#TSLAB trades at $403.91, gaining +0.83% with about $1.5 M of volume.
#SPCXB is priced at $138.86, up +0.75% on a solid $17.5 M of daily volume.
#ETH sits at $2,287.15, climbing +0.65% and moving $434.9 M in trade.
📊 The modest price lifts across all three come with noticeably different liquidity levels, which could affect how quickly any further moves sustain.
#Write2Earn #Binance
6

Gates said on X that Tesla wasn’t founded by Musk. Musk shot back: “Don’t make me buy Microsoft and fire you.” In the hours after that post, TSLAB’s price moved along with it, but Tesla didn’t produce a single extra car, and its gross margin didn’t budge by a single basis point.
First, let’s look at how this asset is priced. That’s the premise for everything else. TSLAB is tokenized equity. When the U.S. stock market is closed, it has no access to real-time price feeds for the underlying asset, so its price is generated entirely by two-way quotes from market makers. There are 168 hours in a U.S. trading week, but regular trading hours account for only 32.5 of them—less than 20%. In other words, more than 80% of the time, every price tick in this contract comes from market makers managing their inventory and sentiment in the order book, not from new fundamental information. A tweet can change the quote; it can’t change deliveries.
Second, funding fees. Perpetuals settle funding three times a day, or 21 times a week. The key point is that quotes pushed up by tweets during market closure are also factored into funding payments. At that point, longs are paying holding costs on a price that isn’t supported by any new information. Once the tweet loses traction and quotes retreat, funding rates often turn before the price does. This is the cost that’s easiest to overlook.
Third, consider the nature of the event. Gates questioned whether Musk was a founder; Musk responded by saying he’d buy Microsoft and fire him. This is purely an attention-driven event, with no bearing on production capacity, orders, or pricing. Only three things truly anchor the company’s value: quarterly deliveries, gross margin per vehicle, and the pace of FSD monetization. None of these will change because two billionaires trade barbs on social media. So this volatility is essentially a case of neither the numerator nor the denominator moving—only risk appetite has changed.
⚠️ Fourth, consider the risks. Order book depth during market closure is far thinner than during regular trading hours, making spreads and slippage more expensive. More importantly, if fundamental news really does break before the market opens, the gap will be filled all at once at the opening bell. Positions opened while the market is closed have no chance to react to that gap. You’re trying to profit from a shift in sentiment, but you’re taking on the full risk of a gap move.
My view is that this kind of public spat is worth treating only as a signal of rising short-term volatility, not as a basis for predicting direction. If you’re bullish on this asset, your reasons should be deliveries and gross margins—not who won an argument on X. And if you do participate, size your position as if you’re trading a market-maker quote, not shares in an automaker.
#马斯克 #特斯拉 #Crypto #TSLAB
Gates said on X that Tesla wasn’t founded by Musk. Musk shot back: “Don’t make me buy Microsoft and fire you.” In the hours after that post, TSLAB’s price moved along with it, but Tesla didn’t produce a single extra car, and its gross margin didn’t budge by a single basis point.
First, let’s look at how this asset is priced. That’s the premise for everything else. TSLAB is tokenized equity. When the U.S. stock market is closed, it has no access to real-time price feeds for the underlying asset, so its price is generated entirely by two-way quotes from market makers. There are 168 hours in a U.S. trading week, but regular trading hours account for only 32.5 of them—less than 20%. In other words, more than 80% of the time, every price tick in this contract comes from market makers managing their inventory and sentiment in the order book, not from new fundamental information. A tweet can change the quote; it can’t change deliveries.
Second, funding fees. Perpetuals settle funding three times a day, or 21 times a week. The key point is that quotes pushed up by tweets during market closure are also factored into funding payments. At that point, longs are paying holding costs on a price that isn’t supported by any new information. Once the tweet loses traction and quotes retreat, funding rates often turn before the price does. This is the cost that’s easiest to overlook.
Third, consider the nature of the event. Gates questioned whether Musk was a founder; Musk responded by saying he’d buy Microsoft and fire him. This is purely an attention-driven event, with no bearing on production capacity, orders, or pricing. Only three things truly anchor the company’s value: quarterly deliveries, gross margin per vehicle, and the pace of FSD monetization. None of these will change because two billionaires trade barbs on social media. So this volatility is essentially a case of neither the numerator nor the denominator moving—only risk appetite has changed.
⚠️ Fourth, consider the risks. Order book depth during market closure is far thinner than during regular trading hours, making spreads and slippage more expensive. More importantly, if fundamental news really does break before the market opens, the gap will be filled all at once at the opening bell. Positions opened while the market is closed have no chance to react to that gap. You’re trying to profit from a shift in sentiment, but you’re taking on the full risk of a gap move.
My view is that this kind of public spat is worth treating only as a signal of rising short-term volatility, not as a basis for predicting direction. If you’re bullish on this asset, your reasons should be deliveries and gross margins—not who won an argument on X. And if you do participate, size your position as if you’re trading a market-maker quote, not shares in an automaker.
#马斯克 #特斯拉 #Crypto #TSLAB
First, let’s look at how this asset is priced. That’s the premise for everything else. TSLAB is tokenized equity. When the U.S. stock market is closed, it has no access to real-time price feeds for the underlying asset, so its price is generated entirely by two-way quotes from market makers. There are 168 hours in a U.S. trading week, but regular trading hours account for only 32.5 of them—less than 20%. In other words, more than 80% of the time, every price tick in this contract comes from market makers managing their inventory and sentiment in the order book, not from new fundamental information. A tweet can change the quote; it can’t change deliveries.
Second, funding fees. Perpetuals settle funding three times a day, or 21 times a week. The key point is that quotes pushed up by tweets during market closure are also factored into funding payments. At that point, longs are paying holding costs on a price that isn’t supported by any new information. Once the tweet loses traction and quotes retreat, funding rates often turn before the price does. This is the cost that’s easiest to overlook.
Third, consider the nature of the event. Gates questioned whether Musk was a founder; Musk responded by saying he’d buy Microsoft and fire him. This is purely an attention-driven event, with no bearing on production capacity, orders, or pricing. Only three things truly anchor the company’s value: quarterly deliveries, gross margin per vehicle, and the pace of FSD monetization. None of these will change because two billionaires trade barbs on social media. So this volatility is essentially a case of neither the numerator nor the denominator moving—only risk appetite has changed.
⚠️ Fourth, consider the risks. Order book depth during market closure is far thinner than during regular trading hours, making spreads and slippage more expensive. More importantly, if fundamental news really does break before the market opens, the gap will be filled all at once at the opening bell. Positions opened while the market is closed have no chance to react to that gap. You’re trying to profit from a shift in sentiment, but you’re taking on the full risk of a gap move.
My view is that this kind of public spat is worth treating only as a signal of rising short-term volatility, not as a basis for predicting direction. If you’re bullish on this asset, your reasons should be deliveries and gross margins—not who won an argument on X. And if you do participate, size your position as if you’re trading a market-maker quote, not shares in an automaker.
#马斯克 #特斯拉 #Crypto #TSLAB
18

·
--
TSLAB is currently at 408.30, up 4.01% over 24 hours and 7.31% over 7 days. The intraday range is 390.86–409.00, with a 4.6% amplitude.
【Market action】
Damn, I just opened the app and saw TSLAB climbing like crazy.
It hit 390.86 before long, with the amplitude reaching 4.6%.
In a market that tends to follow the downside but not the upside, TSLAB is going against the trend—a positive 24-hour close says it all.
The price tested 390.86 several times without breaking below it, and buyers stepped in decisively on the pullback.
Meanwhile, BTC was up 1.18% over 24 hours. TSLAB’s 4.01% gain clearly outperformed the broader market, indicating stronger investor appetite.
【Macroeconomic factors】 Overnight, U.S. stocks rose: Nasdaq +0.82% and S&P 500 +0.70% (market close on 2026-10-27). BTC ETFs saw net outflows of about $45.2 billion this month. U.S. CPI came in at 3.7% year over year, above expectations. The probability of an interest rate hike at the 2026-10-27/28 policy meeting is around 47%.
The short-term outlook leans bullish.
【Reasons to be bullish】
How exactly did it go up? Well, the chart shows that 4.01% gain. I haven’t looked into it closely.
A 4.01% 24-hour gain alongside a 7.31% seven-day gain shows sustained momentum, not just a one-day spike.
A market that finds support on pullbacks and sees volume on the way up has more staying power than a straight-up rally.
Anyone who knows what’s going on, care to share?
The risk is that after a short-term rise, profit-taking could happen at any time, and chasing the price could leave you caught by a sharp wick.
$TSLAB #TSLAB
TSLAB is currently at 408.30, up 4.01% over 24 hours and 7.31% over 7 days. The intraday range is 390.86–409.00, with a 4.6% amplitude.
【Market action】
Damn, I just opened the app and saw TSLAB climbing like crazy.
It hit 390.86 before long, with the amplitude reaching 4.6%.
In a market that tends to follow the downside but not the upside, TSLAB is going against the trend—a positive 24-hour close says it all.
The price tested 390.86 several times without breaking below it, and buyers stepped in decisively on the pullback.
Meanwhile, BTC was up 1.18% over 24 hours. TSLAB’s 4.01% gain clearly outperformed the broader market, indicating stronger investor appetite.
【Macroeconomic factors】 Overnight, U.S. stocks rose: Nasdaq +0.82% and S&P 500 +0.70% (market close on 2026-10-27). BTC ETFs saw net outflows of about $45.2 billion this month. U.S. CPI came in at 3.7% year over year, above expectations. The probability of an interest rate hike at the 2026-10-27/28 policy meeting is around 47%.
The short-term outlook leans bullish.
【Reasons to be bullish】
How exactly did it go up? Well, the chart shows that 4.01% gain. I haven’t looked into it closely.
A 4.01% 24-hour gain alongside a 7.31% seven-day gain shows sustained momentum, not just a one-day spike.
A market that finds support on pullbacks and sees volume on the way up has more staying power than a straight-up rally.
Anyone who knows what’s going on, care to share?
The risk is that after a short-term rise, profit-taking could happen at any time, and chasing the price could leave you caught by a sharp wick.
$TSLAB #TSLAB
【Market action】
Damn, I just opened the app and saw TSLAB climbing like crazy.
It hit 390.86 before long, with the amplitude reaching 4.6%.
In a market that tends to follow the downside but not the upside, TSLAB is going against the trend—a positive 24-hour close says it all.
The price tested 390.86 several times without breaking below it, and buyers stepped in decisively on the pullback.
Meanwhile, BTC was up 1.18% over 24 hours. TSLAB’s 4.01% gain clearly outperformed the broader market, indicating stronger investor appetite.
【Macroeconomic factors】 Overnight, U.S. stocks rose: Nasdaq +0.82% and S&P 500 +0.70% (market close on 2026-10-27). BTC ETFs saw net outflows of about $45.2 billion this month. U.S. CPI came in at 3.7% year over year, above expectations. The probability of an interest rate hike at the 2026-10-27/28 policy meeting is around 47%.
The short-term outlook leans bullish.
【Reasons to be bullish】
How exactly did it go up? Well, the chart shows that 4.01% gain. I haven’t looked into it closely.
A 4.01% 24-hour gain alongside a 7.31% seven-day gain shows sustained momentum, not just a one-day spike.
A market that finds support on pullbacks and sees volume on the way up has more staying power than a straight-up rally.
Anyone who knows what’s going on, care to share?
The risk is that after a short-term rise, profit-taking could happen at any time, and chasing the price could leave you caught by a sharp wick.
$TSLAB #TSLAB
63


$TSLAB: TSLAB Activity and Peer Relative Volume
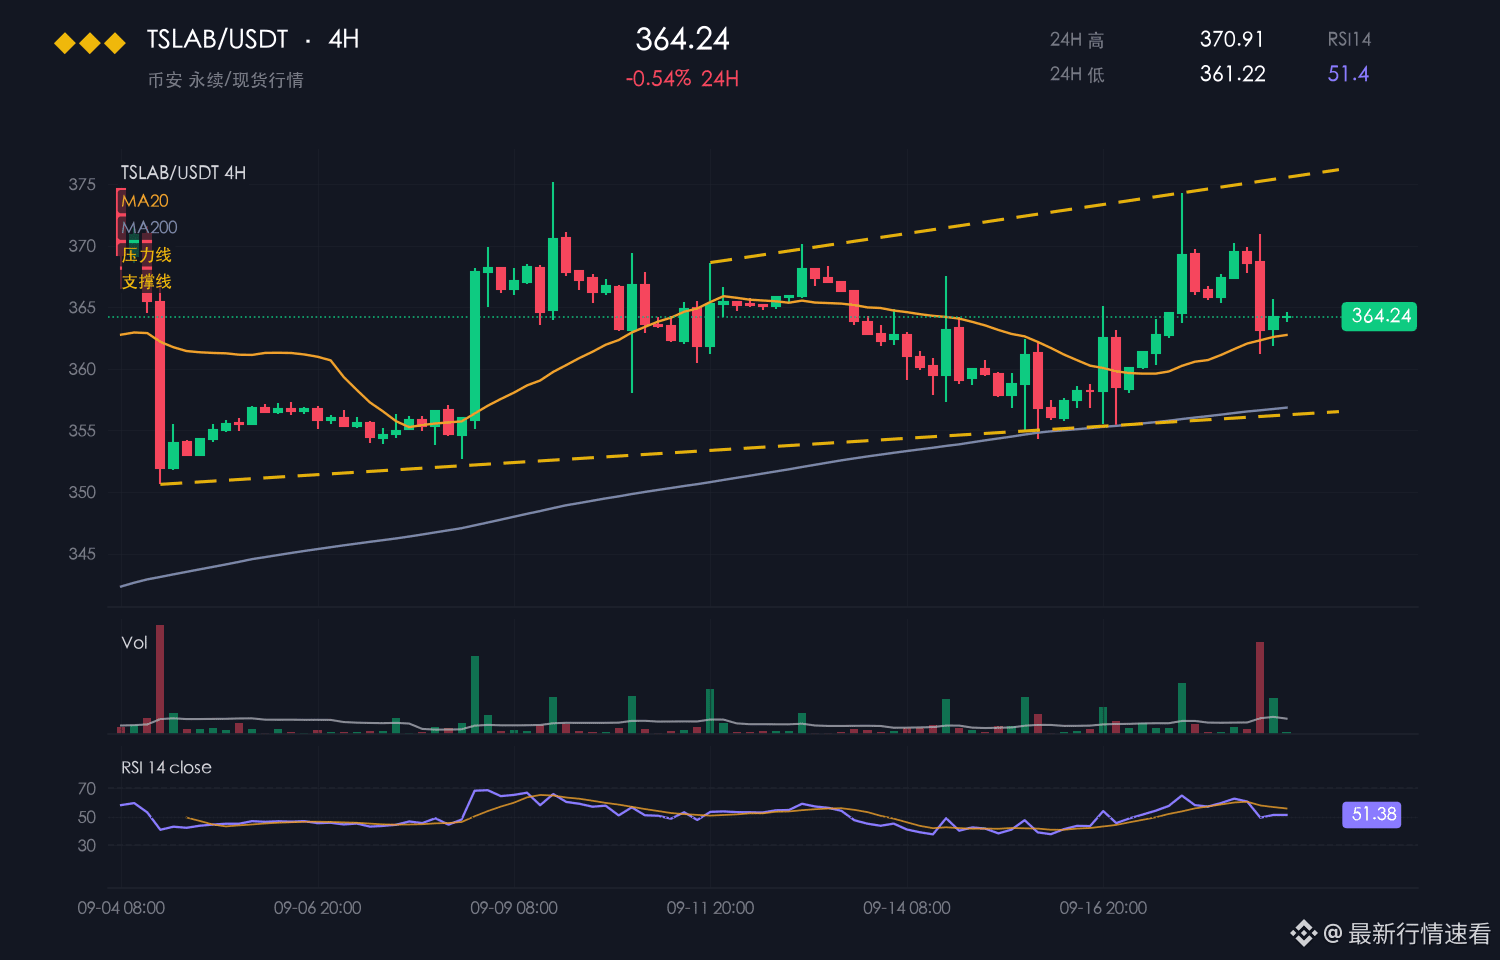
Evaluating $TSLAB involves more than noticing a green candle. Current data shows the asset has an hourly direction trending up with volume above its baseline. While price stands at 394.05, the strength of this move depends on how liquidity absorbs the buying pressure. One mechanism to consider is the interaction between daily volume and recent volatility. With an ATR of 0.930235 and a RSI of 40.4238, the current movement sits within a specific range without confirming a long-term trend.
Looking at the same venue, other assets show different behaviors. For instance, $ETH is moving up but lacks volume above its baseline. Meanwhile, $PARTI matches the primary asset by trending up with high volume. These shared directions on an hourly scale do not imply a common cause or measured correlation. Short-term synchronization often occurs by chance rather than deep structural links.
Traders can reassess this interpretation by monitoring the 394.882 and 396.304 levels. If the price fails to stay above the 393.27 or struggles at the 396.96, the initial volume spike may be a temporary event. Comparing these hourly differences helps distinguish between a fleeting reaction and a sustained shift in market participation.
Probabilistic market research, not a recommendation or guaranteed return.
The comparison to keep in mind: $ETH has hourly direction up and volume not above its baseline; $PARTI has hourly direction up and volume above its baseline. This alone does not establish correlation.
Which matters more in this comparison: direction or how the move holds?
#TSLAB
$TSLAB : TSLAB Activity and Peer Relative Volume
Evaluating $TSLAB involves more than noticing a green candle. Current data shows the asset has an hourly direction trending up with volume above its baseline. While price stands at 394.05, the strength of this move depends on how liquidity absorbs the buying pressure. One mechanism to consider is the interaction between daily volume and recent volatility. With an ATR of 0.930235 and a RSI of 40.4238, the current movement sits within a specific range without confirming a long-term trend.
Looking at the same venue, other assets show different behaviors. For instance, $ETH is moving up but lacks volume above its baseline. Meanwhile, $PARTI matches the primary asset by trending up with high volume. These shared directions on an hourly scale do not imply a common cause or measured correlation. Short-term synchronization often occurs by chance rather than deep structural links.
Traders can reassess this interpretation by monitoring the 394.882 and 396.304 levels. If the price fails to stay above the 393.27 or struggles at the 396.96, the initial volume spike may be a temporary event. Comparing these hourly differences helps distinguish between a fleeting reaction and a sustained shift in market participation.
Probabilistic market research, not a recommendation or guaranteed return.
The comparison to keep in mind: $ETH has hourly direction up and volume not above its baseline; $PARTI has hourly direction up and volume above its baseline. This alone does not establish correlation.
Which matters more in this comparison: direction or how the move holds?
#TSLAB
Evaluating $TSLAB involves more than noticing a green candle. Current data shows the asset has an hourly direction trending up with volume above its baseline. While price stands at 394.05, the strength of this move depends on how liquidity absorbs the buying pressure. One mechanism to consider is the interaction between daily volume and recent volatility. With an ATR of 0.930235 and a RSI of 40.4238, the current movement sits within a specific range without confirming a long-term trend.
Looking at the same venue, other assets show different behaviors. For instance, $ETH is moving up but lacks volume above its baseline. Meanwhile, $PARTI matches the primary asset by trending up with high volume. These shared directions on an hourly scale do not imply a common cause or measured correlation. Short-term synchronization often occurs by chance rather than deep structural links.
Traders can reassess this interpretation by monitoring the 394.882 and 396.304 levels. If the price fails to stay above the 393.27 or struggles at the 396.96, the initial volume spike may be a temporary event. Comparing these hourly differences helps distinguish between a fleeting reaction and a sustained shift in market participation.
Probabilistic market research, not a recommendation or guaranteed return.
The comparison to keep in mind: $ETH has hourly direction up and volume not above its baseline; $PARTI has hourly direction up and volume above its baseline. This alone does not establish correlation.
Which matters more in this comparison: direction or how the move holds?
#TSLAB
27
$TSLAB: Why Volume Can Mislead a Breakout
**Myth:** A price rise on the hourly chart automatically means a strong breakout if volume is above baseline.
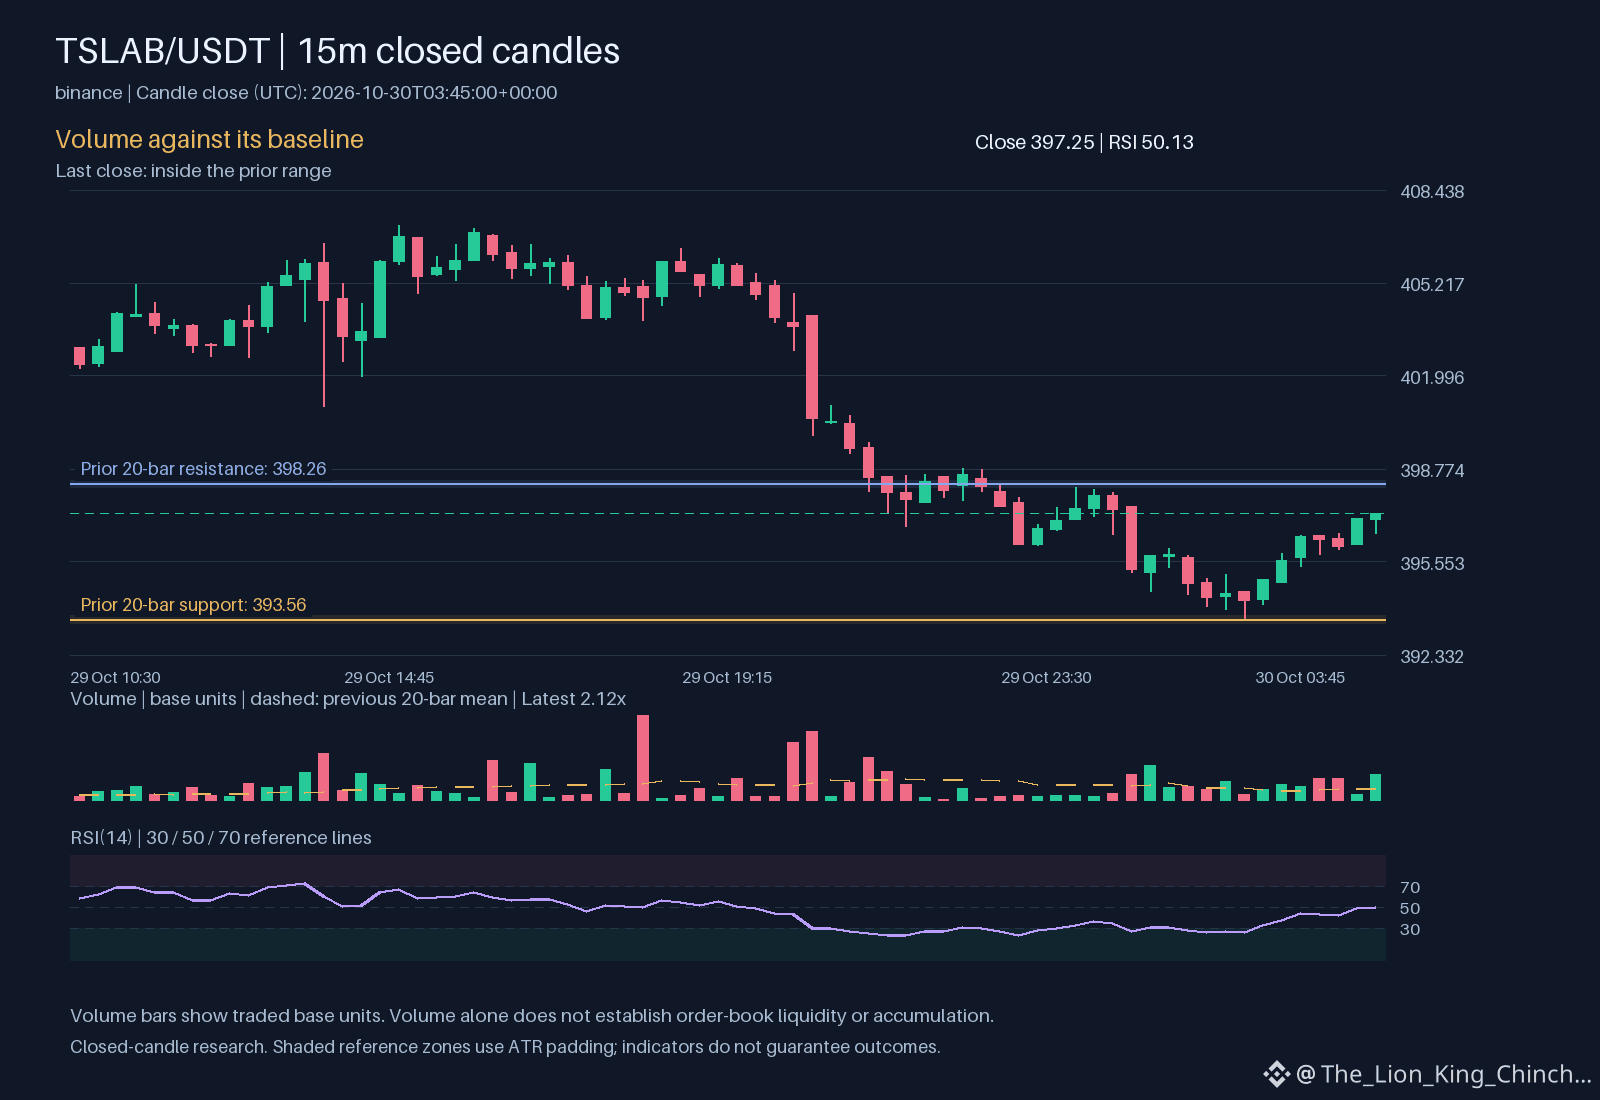
**Answer:** Volume above the usual level shows interest, but it does not guarantee that the price move will hold. When volume spikes, many traders are entering at the same time, which can create a temporary push. If the underlying order flow is not sustained, the price can reverse once the short‑term buying pressure fades. The observation for $TSLAB shows an hourly up direction while 2.11762 indicates volume above baseline. This pattern often appears when a few large buyers dominate the trade, inflating volume without broad participation.
**Mechanism:** Imagine a crowd trying to push a door open. If only a handful of strong people push, the door moves a little, but when they stop, the door swings back. In markets, a few large orders raise volume, but without many small participants, the price lacks a solid foundation. The market may retest the nearest support, often near the 393.56 level, or consolidate around the 401.537.
**Where it stops applying:** The explanation loses relevance when volume remains high for several periods and aligns with other confirming signals, such as a clear EMA crossover (396.669 above 398.83) or a rising RSI 50.1281. In that case, the broader participation suggests the move is more durable.
**Reassessment tip:** Track how volume changes after the initial rise. If 2.11762 drops back toward baseline while price stays up, consider tightening stops near the recent low or the 393.56 zone. This simple check helps separate a fleeting push from a genuine breakout.
Probabilistic market research, not a recommendation or guaranteed return.
Which trading assumption would you like to question next?
#TSLAB #CryptoLearning
$TSLAB : Why Volume Can Mislead a Breakout
**Myth:** A price rise on the hourly chart automatically means a strong breakout if volume is above baseline.
**Answer:** Volume above the usual level shows interest, but it does not guarantee that the price move will hold. When volume spikes, many traders are entering at the same time, which can create a temporary push. If the underlying order flow is not sustained, the price can reverse once the short‑term buying pressure fades. The observation for $TSLAB shows an hourly up direction while 2.11762 indicates volume above baseline. This pattern often appears when a few large buyers dominate the trade, inflating volume without broad participation.
**Mechanism:** Imagine a crowd trying to push a door open. If only a handful of strong people push, the door moves a little, but when they stop, the door swings back. In markets, a few large orders raise volume, but without many small participants, the price lacks a solid foundation. The market may retest the nearest support, often near the 393.56 level, or consolidate around the 401.537.
**Where it stops applying:** The explanation loses relevance when volume remains high for several periods and aligns with other confirming signals, such as a clear EMA crossover (396.669 above 398.83) or a rising RSI 50.1281. In that case, the broader participation suggests the move is more durable.
**Reassessment tip:** Track how volume changes after the initial rise. If 2.11762 drops back toward baseline while price stays up, consider tightening stops near the recent low or the 393.56 zone. This simple check helps separate a fleeting push from a genuine breakout.
Probabilistic market research, not a recommendation or guaranteed return.
Which trading assumption would you like to question next?
#TSLAB #CryptoLearning
**Myth:** A price rise on the hourly chart automatically means a strong breakout if volume is above baseline.
**Answer:** Volume above the usual level shows interest, but it does not guarantee that the price move will hold. When volume spikes, many traders are entering at the same time, which can create a temporary push. If the underlying order flow is not sustained, the price can reverse once the short‑term buying pressure fades. The observation for $TSLAB shows an hourly up direction while 2.11762 indicates volume above baseline. This pattern often appears when a few large buyers dominate the trade, inflating volume without broad participation.
**Mechanism:** Imagine a crowd trying to push a door open. If only a handful of strong people push, the door moves a little, but when they stop, the door swings back. In markets, a few large orders raise volume, but without many small participants, the price lacks a solid foundation. The market may retest the nearest support, often near the 393.56 level, or consolidate around the 401.537.
**Where it stops applying:** The explanation loses relevance when volume remains high for several periods and aligns with other confirming signals, such as a clear EMA crossover (396.669 above 398.83) or a rising RSI 50.1281. In that case, the broader participation suggests the move is more durable.
**Reassessment tip:** Track how volume changes after the initial rise. If 2.11762 drops back toward baseline while price stays up, consider tightening stops near the recent low or the 393.56 zone. This simple check helps separate a fleeting push from a genuine breakout.
Probabilistic market research, not a recommendation or guaranteed return.
Which trading assumption would you like to question next?
#TSLAB #CryptoLearning
65

·
--
$TSLAB
🚀 TSLAB — Quick Market Overview
TSLAB is a tokenized Tesla asset that gives users blockchain-based exposure to Tesla (TSLA).
📊 Why watch TSLAB?
• Tracks Tesla’s performance
• 24/7 blockchain trading
• Built on BNB Chain
• Part of the growing RWA sector
• DeFi integration potential
📈 If Tesla moves higher, TSLAB may also benefit. However, price volatility, liquidity and regulatory risks remain.
🔎 Key levels to watch: Recent high around $435 and the $400 area.
⚠️ This is not financial advice. Always DYOR before trading.
#TSLAB #Tesla #RWA #Crypto #Binance #DeFi #DYORDYOR
$TSLAB
🚀 TSLAB — Quick Market Overview
TSLAB is a tokenized Tesla asset that gives users blockchain-based exposure to Tesla (TSLA).
📊 Why watch TSLAB?
• Tracks Tesla’s performance
• 24/7 blockchain trading
• Built on BNB Chain
• Part of the growing RWA sector
• DeFi integration potential
📈 If Tesla moves higher, TSLAB may also benefit. However, price volatility, liquidity and regulatory risks remain.
🔎 Key levels to watch: Recent high around $435 and the $400 area.
⚠️ This is not financial advice. Always DYOR before trading.
#TSLAB #Tesla #RWA #Crypto #Binance #DeFi #DYORDYOR
🚀 TSLAB — Quick Market Overview
TSLAB is a tokenized Tesla asset that gives users blockchain-based exposure to Tesla (TSLA).
📊 Why watch TSLAB?
• Tracks Tesla’s performance
• 24/7 blockchain trading
• Built on BNB Chain
• Part of the growing RWA sector
• DeFi integration potential
📈 If Tesla moves higher, TSLAB may also benefit. However, price volatility, liquidity and regulatory risks remain.
🔎 Key levels to watch: Recent high around $435 and the $400 area.
⚠️ This is not financial advice. Always DYOR before trading.
#TSLAB #Tesla #RWA #Crypto #Binance #DeFi #DYORDYOR

58

·
--
TSLAB signal for a local Buy 🚀
The 1h timeframe continues to show an uptrend, with confirmed support from the upper boundary of the 15m Bull OB. The RSI indicator on the 1h and 15m timeframes (54.16) points to growth, alongside the formation of a bullish 15m Heikin Ashi candle and no strong resistance.
Entry point: 404.8$
TP💵: 417$ (+3%)
SL🙊: 402.4$
⚠️ Using a stop-loss is essential for risk management. This information is for analytical purposes only and does not constitute financial advice.
$TSLAB #TSLAB
TSLAB signal for a local Buy 🚀
The 1h timeframe continues to show an uptrend, with confirmed support from the upper boundary of the 15m Bull OB. The RSI indicator on the 1h and 15m timeframes (54.16) points to growth, alongside the formation of a bullish 15m Heikin Ashi candle and no strong resistance.
Entry point: 404.8$
TP💵: 417$ (+3%)
SL🙊: 402.4$
⚠️ Using a stop-loss is essential for risk management. This information is for analytical purposes only and does not constitute financial advice.
$TSLAB #TSLAB
The 1h timeframe continues to show an uptrend, with confirmed support from the upper boundary of the 15m Bull OB. The RSI indicator on the 1h and 15m timeframes (54.16) points to growth, alongside the formation of a bullish 15m Heikin Ashi candle and no strong resistance.
Entry point: 404.8$
TP💵: 417$ (+3%)
SL🙊: 402.4$
⚠️ Using a stop-loss is essential for risk management. This information is for analytical purposes only and does not constitute financial advice.
$TSLAB #TSLAB
114

·
--
$TSLAB Sets a New 24-Hour Low at 399.39, Breaking Below the Previous Low of 400.74.
Buyers couldn’t catch it in time. After the panic selling, prices often need time to digest the move. Catch the falling knife or wait a little longer?
#TSLAB
It’s your money. You decide.
$TSLAB Sets a New 24-Hour Low at 399.39, Breaking Below the Previous Low of 400.74.
Buyers couldn’t catch it in time. After the panic selling, prices often need time to digest the move. Catch the falling knife or wait a little longer?
#TSLAB
It’s your money. You decide.
Buyers couldn’t catch it in time. After the panic selling, prices often need time to digest the move. Catch the falling knife or wait a little longer?
#TSLAB
It’s your money. You decide.

·
--
Here it comes!
$TSLAB has broken below support—the 24-hour low has been smashed!
Current price: 398.36. The previous low of 400.74 couldn't hold…
Don't average down on a bad call. Where's the bottom? What do you think?
#TSLAB
It's your money. You decide.
Here it comes!
$TSLAB has broken below support—the 24-hour low has been smashed!
Current price: 398.36. The previous low of 400.74 couldn't hold…
Don't average down on a bad call. Where's the bottom? What do you think?
#TSLAB
It's your money. You decide.
$TSLAB has broken below support—the 24-hour low has been smashed!
Current price: 398.36. The previous low of 400.74 couldn't hold…
Don't average down on a bad call. Where's the bottom? What do you think?
#TSLAB
It's your money. You decide.
3

Intraday | $TSLAB fell below its 24-hour low, trading at 398.49 (previous low: 400.74), down 0.98% over 24 hours. In a weak market, the key thing to watch is whether trading volume contracts. I’ll share any updates as soon as they happen.
#TSLAB
Intraday | $TSLAB fell below its 24-hour low, trading at 398.49 (previous low: 400.74), down 0.98% over 24 hours. In a weak market, the key thing to watch is whether trading volume contracts. I’ll share any updates as soon as they happen.
#TSLAB
#TSLAB
9
$TSLAB: Moving Beyond Volume Spikes
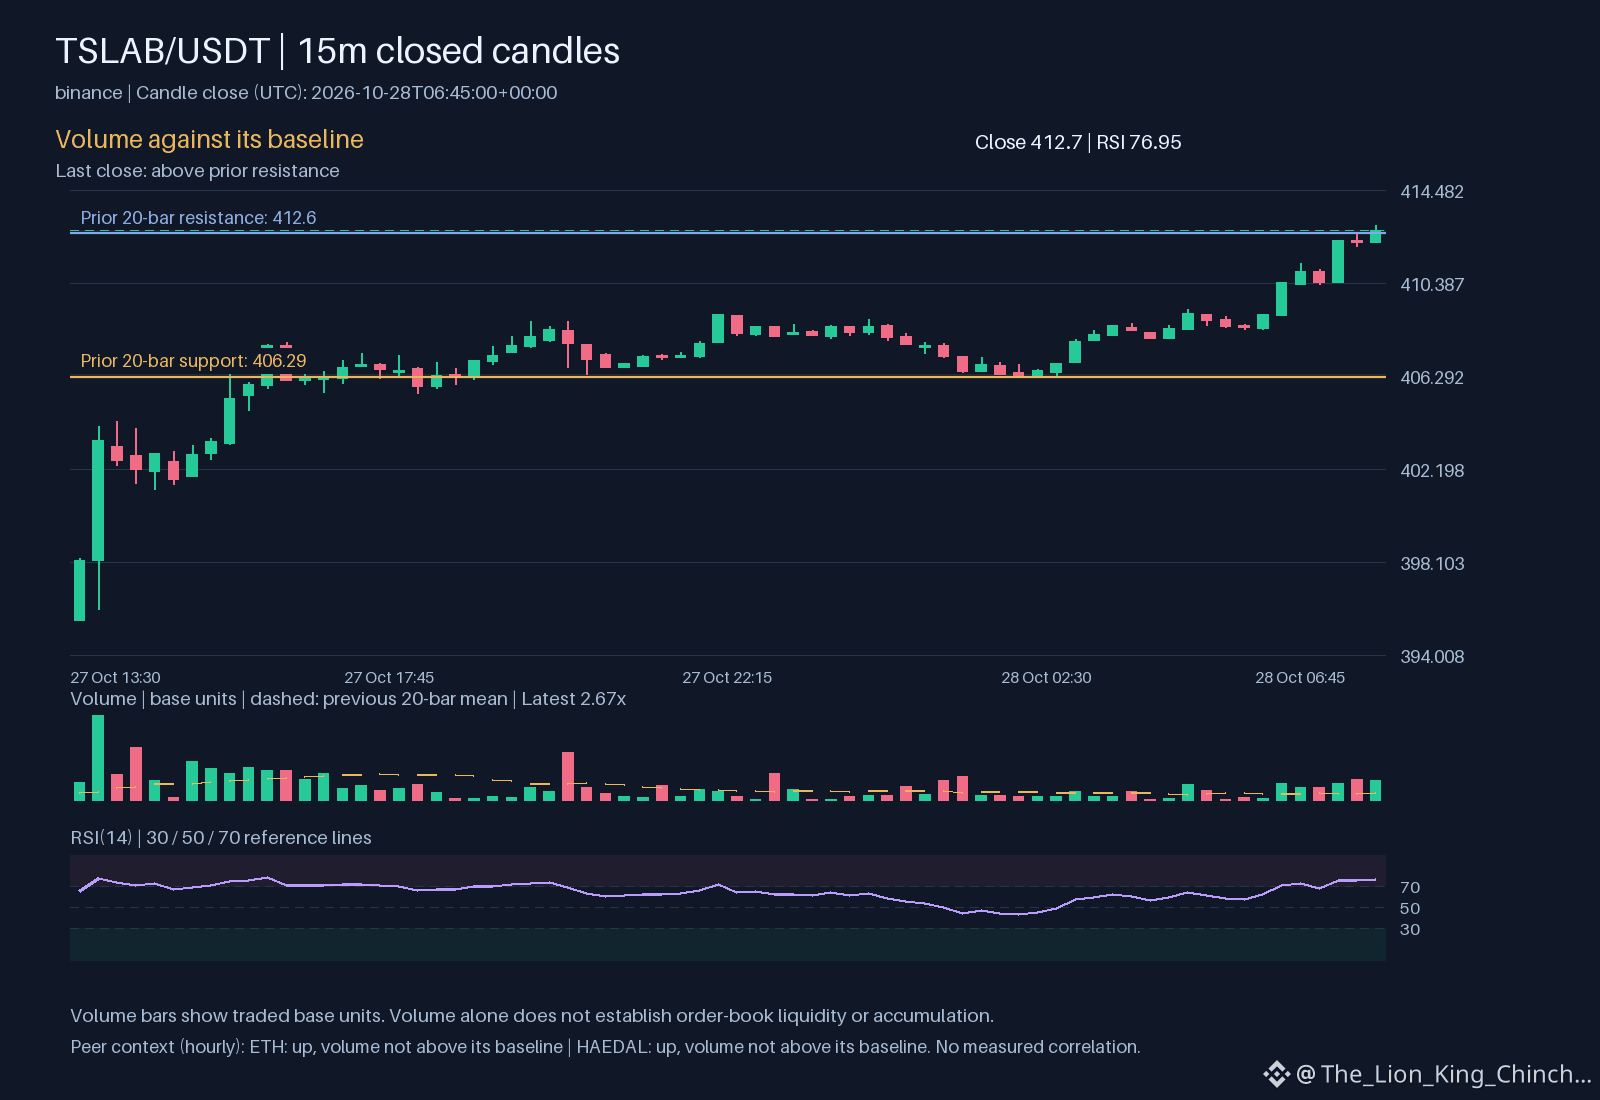
Trading $TSLAB currently shows an upward hourly direction while the volume remains above its baseline. This activity places the price at 412.7, which is currently positioned above the resistance level of 412.6. When an asset moves past such markers on elevated volume, the immediate question is whether the momentum reflects sustained interest or a temporary reaction to localized order flow.
Looking at peers on the same venue, $ETH and $HAEDAL both show an upward hourly direction as well. However, their volume remains at or below their respective baselines. This difference is significant. While all three assets moved up during the same hour, the mechanics behind the moves differ. A shared direction does not indicate a measured correlation or a common cause. It simply shows that multiple assets can move upward simultaneously for different reasons.
The presence of high volume on $TSLAB suggests a different level of participation compared to $ETH and $HAEDAL. One scenario is that the high volume confirms the breakout above 412.6, while another scenario suggests a climax where the move might struggle to hold. To reassess this interpretation, one should monitor if the price remains above 409.677 as volume returns to normal levels. Monitoring 76.9452 at 76.9452 also helps identify if the move is entering an overextended state. Ultimately, how a move holds matters more than the initial direction.
Probabilistic market research, not a recommendation or guaranteed return.
The comparison to keep in mind: $ETH has hourly direction up and volume not above its baseline; $HAEDAL has hourly direction up and volume not above its baseline. This alone does not establish correlation.
Which matters more in this comparison: direction or how the move holds?
#TSLAB #ETH #HAEDAL #CryptoWatchlist
$TSLAB : Moving Beyond Volume Spikes
Trading $TSLAB currently shows an upward hourly direction while the volume remains above its baseline. This activity places the price at 412.7, which is currently positioned above the resistance level of 412.6. When an asset moves past such markers on elevated volume, the immediate question is whether the momentum reflects sustained interest or a temporary reaction to localized order flow.
Looking at peers on the same venue, $ETH and $HAEDAL both show an upward hourly direction as well. However, their volume remains at or below their respective baselines. This difference is significant. While all three assets moved up during the same hour, the mechanics behind the moves differ. A shared direction does not indicate a measured correlation or a common cause. It simply shows that multiple assets can move upward simultaneously for different reasons.
The presence of high volume on $TSLAB suggests a different level of participation compared to $ETH and $HAEDAL . One scenario is that the high volume confirms the breakout above 412.6, while another scenario suggests a climax where the move might struggle to hold. To reassess this interpretation, one should monitor if the price remains above 409.677 as volume returns to normal levels. Monitoring 76.9452 at 76.9452 also helps identify if the move is entering an overextended state. Ultimately, how a move holds matters more than the initial direction.
Probabilistic market research, not a recommendation or guaranteed return.
The comparison to keep in mind: $ETH has hourly direction up and volume not above its baseline; $HAEDAL has hourly direction up and volume not above its baseline. This alone does not establish correlation.
Which matters more in this comparison: direction or how the move holds?
#TSLAB #ETH #HAEDAL #CryptoWatchlist
Trading $TSLAB currently shows an upward hourly direction while the volume remains above its baseline. This activity places the price at 412.7, which is currently positioned above the resistance level of 412.6. When an asset moves past such markers on elevated volume, the immediate question is whether the momentum reflects sustained interest or a temporary reaction to localized order flow.
Looking at peers on the same venue, $ETH and $HAEDAL both show an upward hourly direction as well. However, their volume remains at or below their respective baselines. This difference is significant. While all three assets moved up during the same hour, the mechanics behind the moves differ. A shared direction does not indicate a measured correlation or a common cause. It simply shows that multiple assets can move upward simultaneously for different reasons.
The presence of high volume on $TSLAB suggests a different level of participation compared to $ETH and $HAEDAL . One scenario is that the high volume confirms the breakout above 412.6, while another scenario suggests a climax where the move might struggle to hold. To reassess this interpretation, one should monitor if the price remains above 409.677 as volume returns to normal levels. Monitoring 76.9452 at 76.9452 also helps identify if the move is entering an overextended state. Ultimately, how a move holds matters more than the initial direction.
Probabilistic market research, not a recommendation or guaranteed return.
The comparison to keep in mind: $ETH has hourly direction up and volume not above its baseline; $HAEDAL has hourly direction up and volume not above its baseline. This alone does not establish correlation.
Which matters more in this comparison: direction or how the move holds?
#TSLAB #ETH #HAEDAL #CryptoWatchlist
81
Log in to explore more content
Join global crypto users on Binance Square
⚡️ Get latest and useful information about crypto.
💬 Trusted by the world’s largest crypto exchange.
👍 Discover real insights from verified creators.
Email / Phone number
Trending Topics
1
#JobsReportRaisesHikeOdds
272,373 views
2,128 Discussing
2
#CPITestsDecemberRateOutlook
28,751 views
374 Discussing
3
#BitcoinRebounds$75KAsChipsLead
22,342 views
229 Discussing
4
#US Data Center Rules May Constrain AI Expansion
41,939 views
159 Discussing
5
#ARKPlans14ThematicETFsCoveringAIAndTokenizedMarkets
295 views
11 Discussing
6
#WillAnthropicListOnTime
67,946 views
852 Discussing
7
#WillUS-IranTensionsBoostSafe-HavenDemand?
15,903 views
147 Discussing
8
#BitcoinETFsSee$412MNetOutflows
4,313 views
46 Discussing
9
#HKSFCPlansToRestrictCryptoAndExchangeTerms
14,819 views
265 Discussing
10
#TradFiForBeginners
42,897 views
637 Discussing