

#btc
btc
9.4G views
61.1M Discussing
Hot
Latest


🟡 Bitcoin price wobbles ahead of Fed’s rate decision
Bitcoin (BTC) dipped as low as $59,500 on Binance ahead of tomorrow’s Federal Open Market Committee (FOMC) meeting. Market participants are bracing for a hawkish stance from the Federal Reserve (Fed), with expectations set for unchanged interest rates.
The CME FedWatch Tool indicates a mere 4.4% of economists predict a rate cut—the first in over a decade—while a dominant 95.6% anticipate rates to hold steady between 525-550 basis points.
According to The Kobeissi Letter, current market data indicates a 36% probability that there will be no interest rate cuts this year. Four months ago, the likelihood of maintaining current rates was only about 3%.
Expectations have also shifted to just one reduction this year. Previously, the market anticipated six rate cuts. Additionally, the probability of experiencing two or more rate cuts has diminished to 31%.
🔺 Stagflation risk
Amidst this financial climate, the US grapples with stagflation risks as inflation persists and economic growth slows.
The first quarter of 2024 saw GDP growth decelerate to 1.6%, falling short of the 2.2% forecast and down from the previous quarter’s 3.4%. Concurrently, the US Core PCE inflation index climbed from 2.0% to 3.7%.
Fed Chair Jerome Powell stated that recent data does not make the Fed more confident, suggesting a longer timeline to regain economic stability. He expressed belief in the adequacy of current policies to navigate the risks at hand, hinting at sustained high-interest rates without increases.
Bitcoin’s trajectory mirrored these economic uncertainties, dropping below $62,000 earlier in the week due to renewed stagflation worries.
A brief rally above $64,000 occurred with the launch of spot Bitcoin and Ethereum ETFs in Hong Kong yesterday, but the momentum was short-lived as investor caution set in ahead of the Fed’s key decision.
$BTC #BTC #Bitcoin

ABO3ZAM:
الوضع حرج، البيتكوين يختبر مناطق دعم حساسة قبل قرار الفيدرالي. الأفضل ننتظر إغلاق الشمعة ونشوف وين السيولة بتتوجه قبل أي دخول جديد. 🤝
133
56
391
294k

·
--
📡 Market Update | BTC Holds Near 80K Ahead of Fed Decision
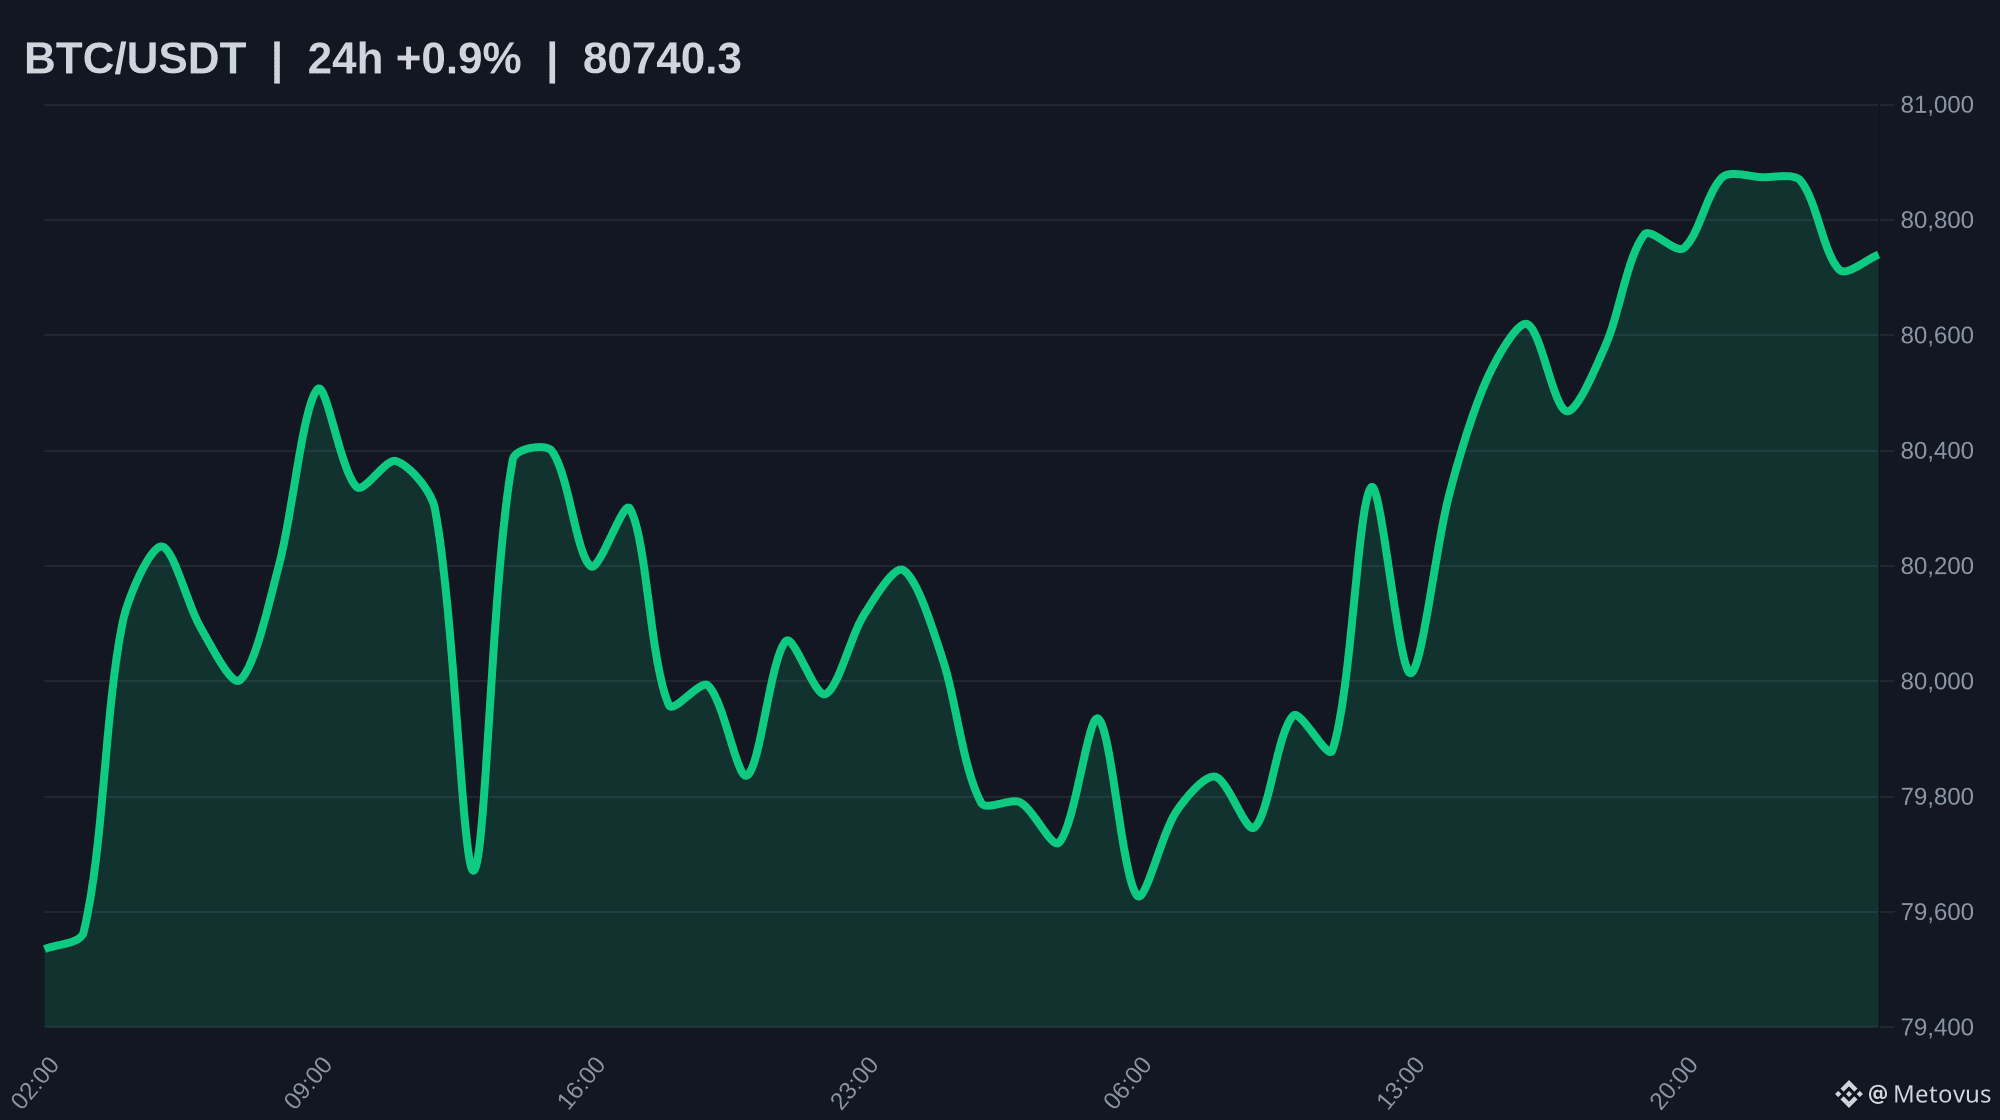
BTC is holding near 80,700 this morning, little changed to slightly higher on the day, while ETH trades near 2,344 and SOL holds just above 101. The move looks like a pause rather than a breakout, with traders waiting for the next macro catalyst.
That catalyst is the Fed decision later today in US time. Markets widely expect rates to stay at 3.75% to 4.00%, with September CPI at 3.7% still well above target and a December hike still on the table. The statement tone could matter more than the hold itself.
👀 The recent 24 hour range for BTC runs from near 79,400 to near 81,200. A clear move beyond either side could set the tone into the decision, and follow through is worth watching.
Personal opinion, not financial advice. DYOR.
#BTC #Crypto #CryptoMarket #Fed
$BTCUSDT $ETHUSDT $SOLUSDT
259

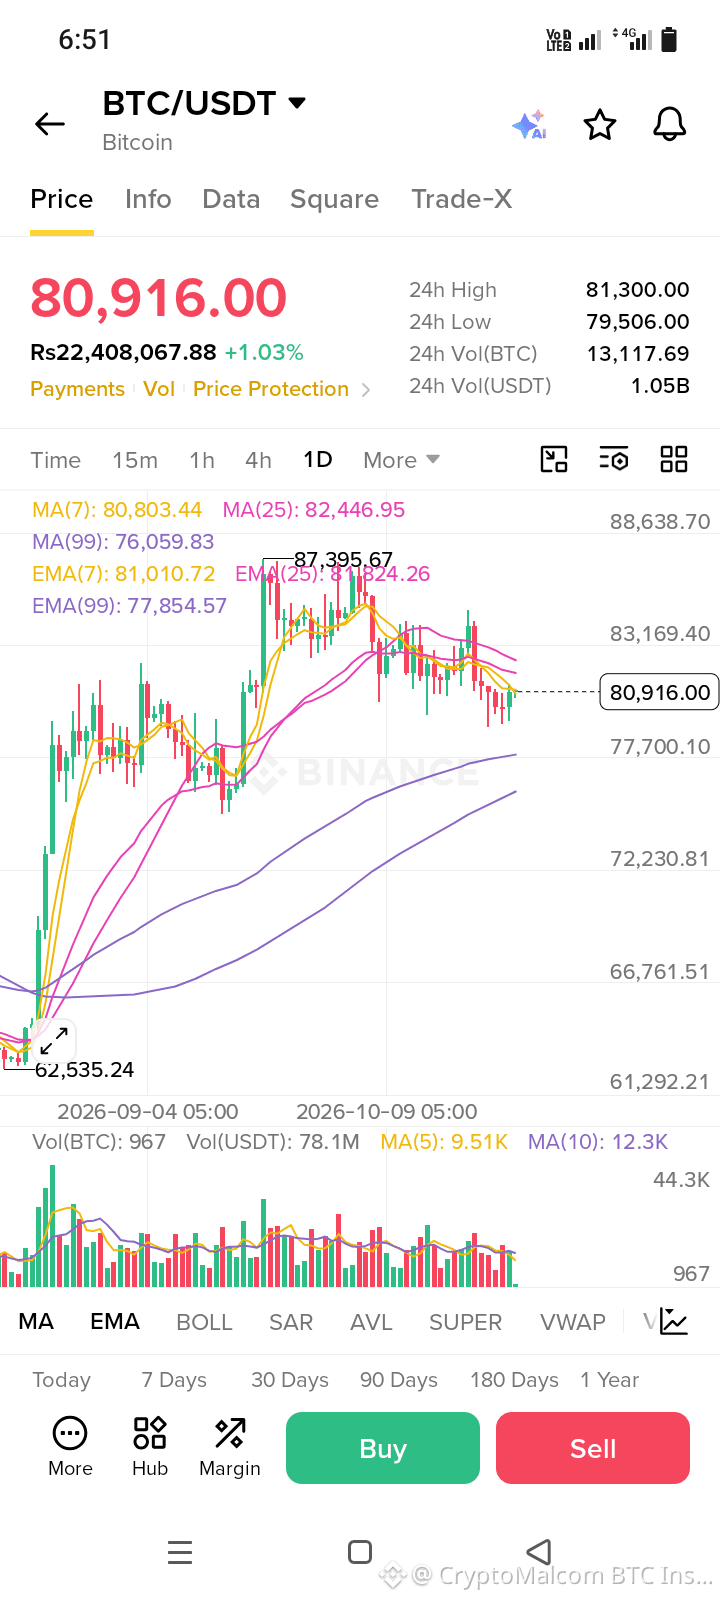
🔥 $BTC / USDT (1D) – Bullish Rebound & Key Support Hold!
Bitcoin is showing strong upward momentum on the daily timeframe, gaining +1.03% and holding firm above structural support zones[span_1](start_span)[span_1](end_span)! 📈
📊 Market Stats:
• Current Price: $80,916.00 (+1.03%)[span_2](start_span)[span_2](end_span)
• 24h High / Low: $81,300.00 / $79,506.00[span_3](start_span)[span_3](end_span)
• 24h Volume: 1.05B USDT[span_4](start_span)[span_4](end_span)
🎯 Trading Setup:
💰 Entry Zone: 79,000.00 - 80,916.00
🛡️ Stop Loss: 77,500.00
Take-Profit Targets:
🎯 TP1: 83,169.40[span_5](start_span)[span_5](end_span)
🎯 TP2: 87,395.67[span_6](start_span)[span_6](end_span)
🎯 TP3: 88,638.70[span_7](start_span)[span_7](end_span)
💡 Technical Outlook:
BTC is consolidating near moving average bands after a healthy retest. A continued push above $81,300 resistance opens the door for a strong rally toward upper targets.
Will BTC break past $82,000 today? Drop your thoughts below! 👇🚀
#BTC #Bitcoin #BinanceSquare #CryptoSignals #TechnicalAnalysis
NFA – Educational purposes only.
10

·
--
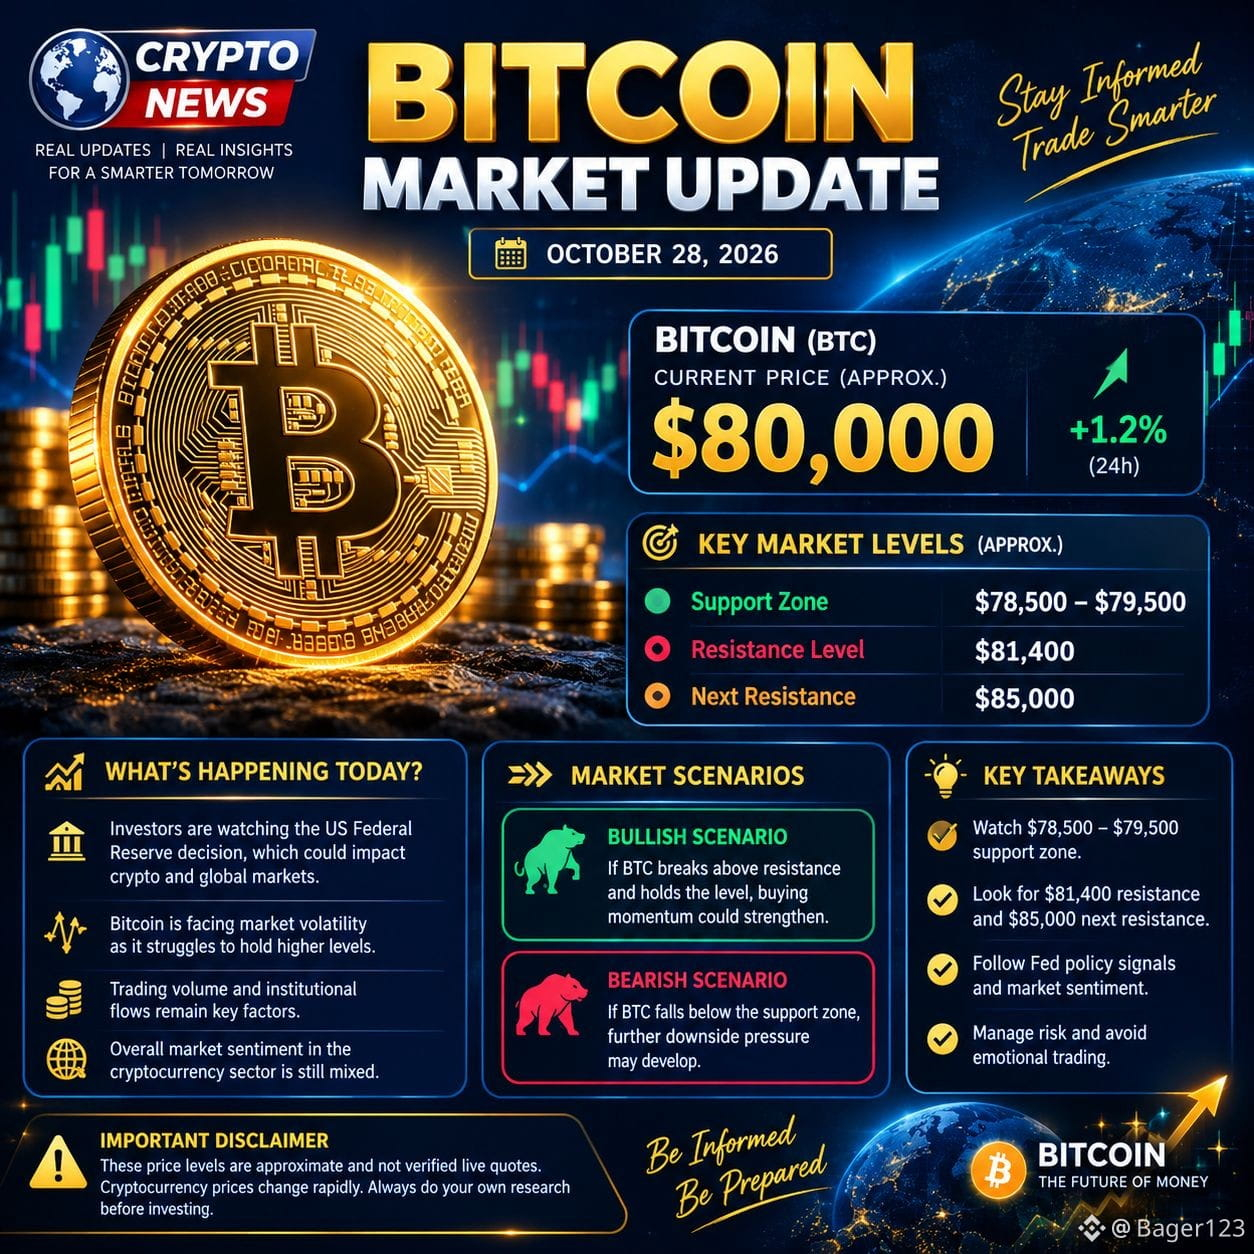
🚨 BITCOIN LATEST MARKET UPDATE 🚨 📅 October 28, 2026
₿ BITCOIN (BTC) — CRYPTO MARKET WATCH
Bitcoin is facing market volatility as investors closely monitor price movements, global economic developments, and the upcoming US Federal Reserve decision.
📊 KEY MARKET LEVELS
💰 Market Watch: Around $80,000
🟢 Support Zone: $78,500–$79,500
🔴 Resistance Level: Around $81,400
🚀 Next Resistance: Around $85,000
📈 BULLISH SCENARIO If Bitcoin breaks above resistance and holds the level, buying momentum could strengthen.
📉 BEARISH SCENARIO If BTC falls below its support zone, further downside pressure may develop.
🌍 WHAT TO WATCH TODAY? • US Federal Reserve policy signals • Bitcoin trading volume • Institutional investment flows • Overall cryptocurrency market sentiment
⚠️ IMPORTANT DISCLAIMER: These price levels are approximate and not verified live quotes. Cryptocurrency prices change rapidly. Always conduct your own research before investing.
🔥 Stay tuned for more Bitcoin and crypto market updates!
#Bitcoin #BTC #CryptoNews #BitcoinUpdate
1
39

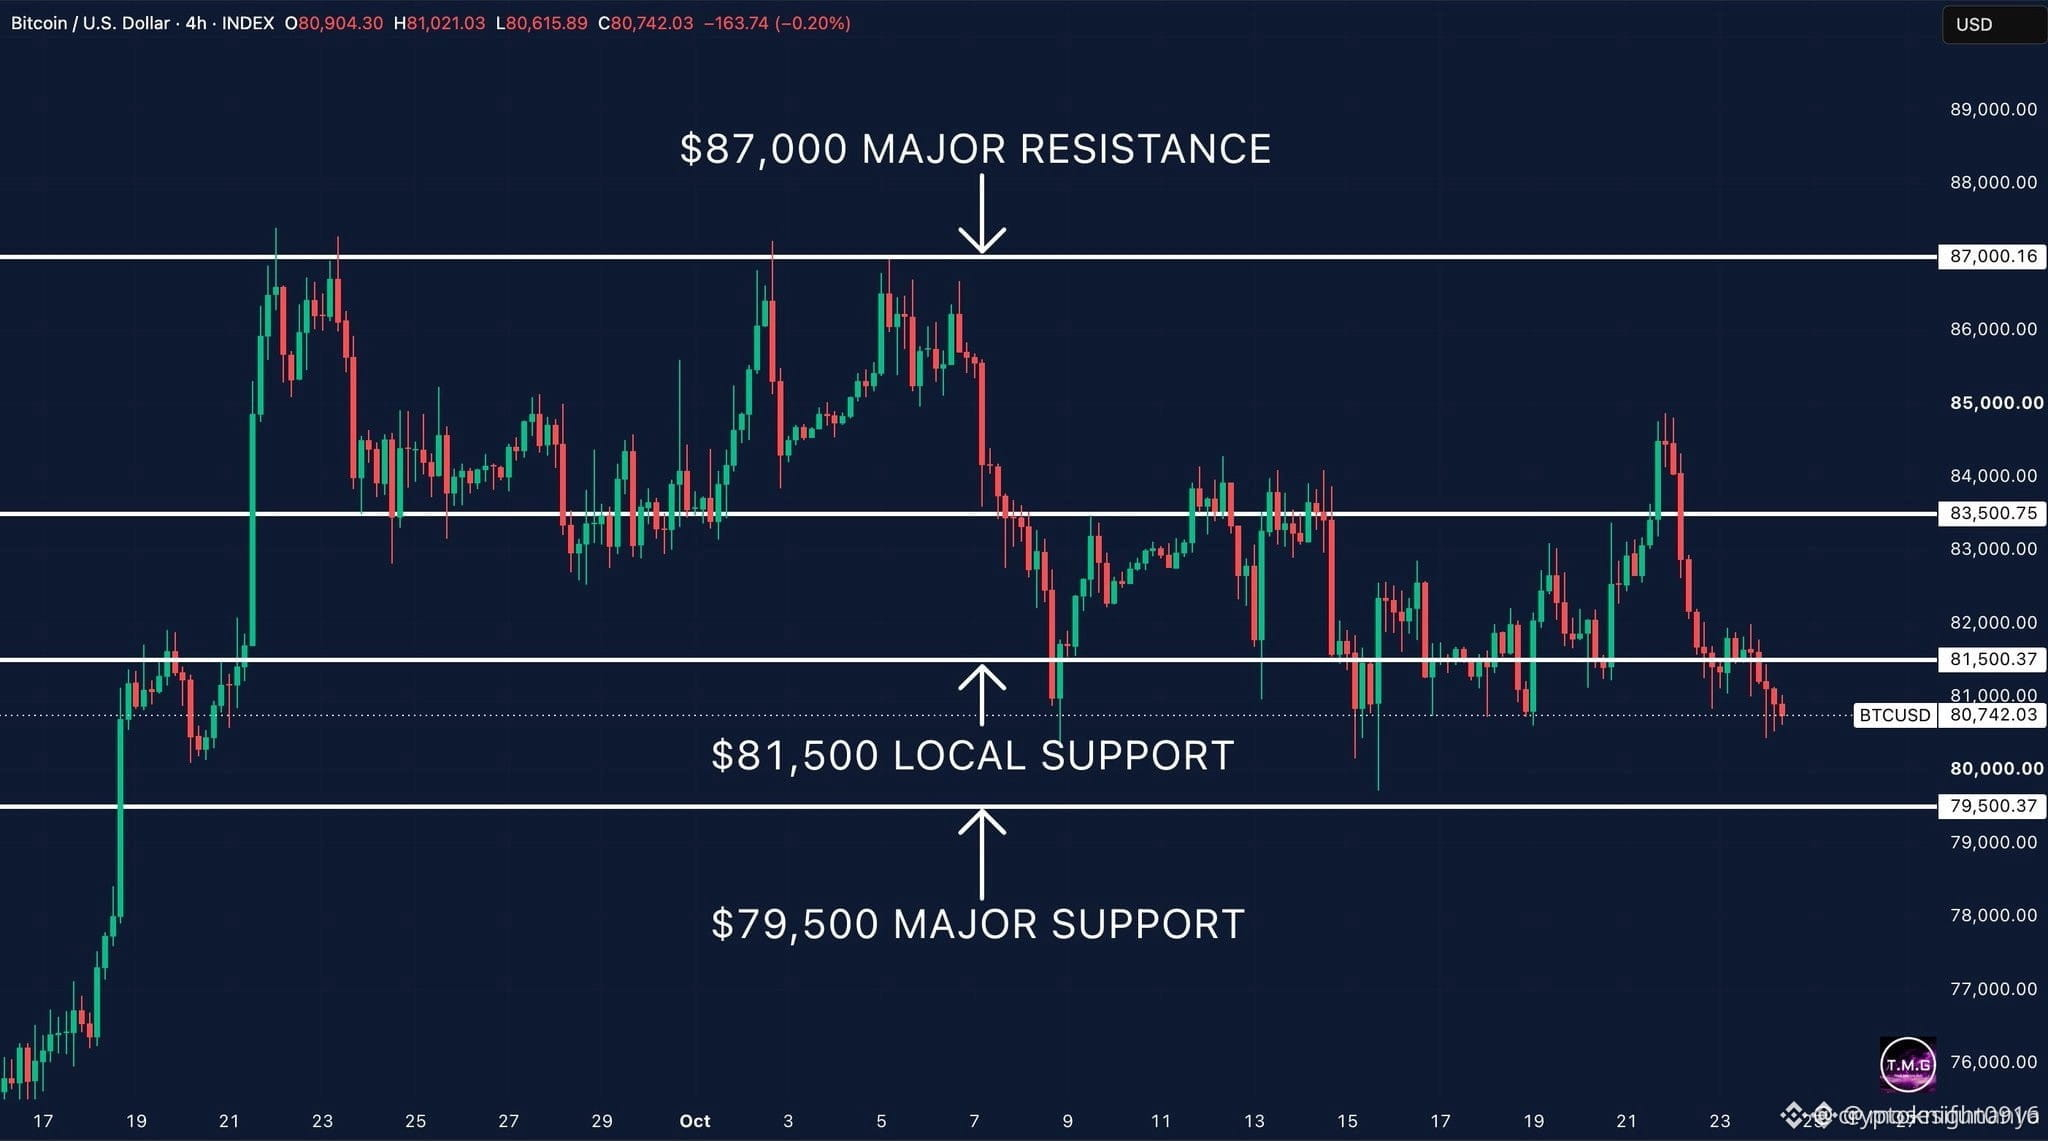
Bitcoin $BTC has lost the $81,500 support on the 4H chart and is now trading around $80,740.
The rejection from $84,500 was aggressive, and buyers have failed to reclaim the levels that would put them back in control.
$81,500 is now the level to recover. If BTC continues to trade below it, $79,500 is the next major support.
Reclaim $81,500 and the door opens for another attempt at $83,500.
For now, the market needs to prove buyers are ready to step back in.
#BTC
{spot}(BTCUSDT)
Bitcoin $BTC has lost the $81,500 support on the 4H chart and is now trading around $80,740.
The rejection from $84,500 was aggressive, and buyers have failed to reclaim the levels that would put them back in control.
$81,500 is now the level to recover. If BTC continues to trade below it, $79,500 is the next major support.
Reclaim $81,500 and the door opens for another attempt at $83,500.
For now, the market needs to prove buyers are ready to step back in.
#BTC
44

·
--
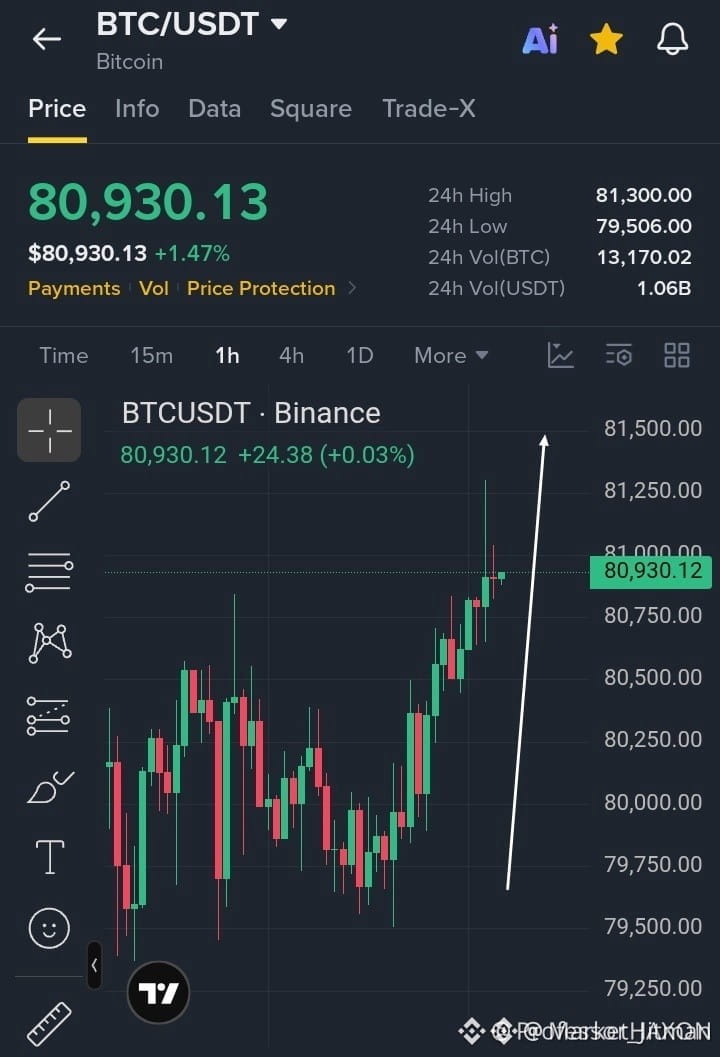
🚀 $BTC BULLISH SURGE TO 81K – MOMENTUM ROCKETS! 🟢
Entry: 80,800-80,950 ⚡
Target: 81,100 🚀
Target: 81,300 🎯
Target: 81,500 💥
Stop Loss: 80,500 ⚠️
📊 The 1‑hour chart is carving higher highs, with the price snapping back from the 80,500 floor and marching toward the 81k ceiling. 🦈 Smart money is stacking bids in the 80,800‑80,950 zone, and each candle adds fresh volume, confirming the bullish thrust. ⚡ A clean break above 81,000 could unleash the next wave, while a dip back under 80,500 would signal a liquidity sweep.
💬 Are you riding this upward push or waiting for the next liquidity trap? 👇
⚠️ Not financial advice. Always manage your risk. 🛡️
🏷️ #BTC #LongSetup #BTCBull #Momentum #Crypto
🔥 💎
9

🚀 $BTC RIPS THROUGH TP1, SETTING SIGHTS ON NEXT BREAKOUT! 📈
Entry: 80,775.6 ⚡
Target: 81,296.6 🚀
Stop Loss: 80,567.2 ⚠️
📊 The 0.39% pop from 80,775.6 to 81,088.2 was fueled by a fresh liquidity sweep, with smart‑money sharks snapping up the dip. 🦈 Volume on the 1H surged past the 20‑period average, and the order block at 80,800 is now acting as a springboard. 💡 Keep eyes on the 81,300 resistance – a clean break could unleash a bullish wave toward 82k. 💬 Are you riding this surge or waiting for a retest? 👇
⚠️ Not financial advice. Always manage your risk. 🛡️
🏷️ #BTC #LongSetup #Breakout #Crypto
🔥 🚀
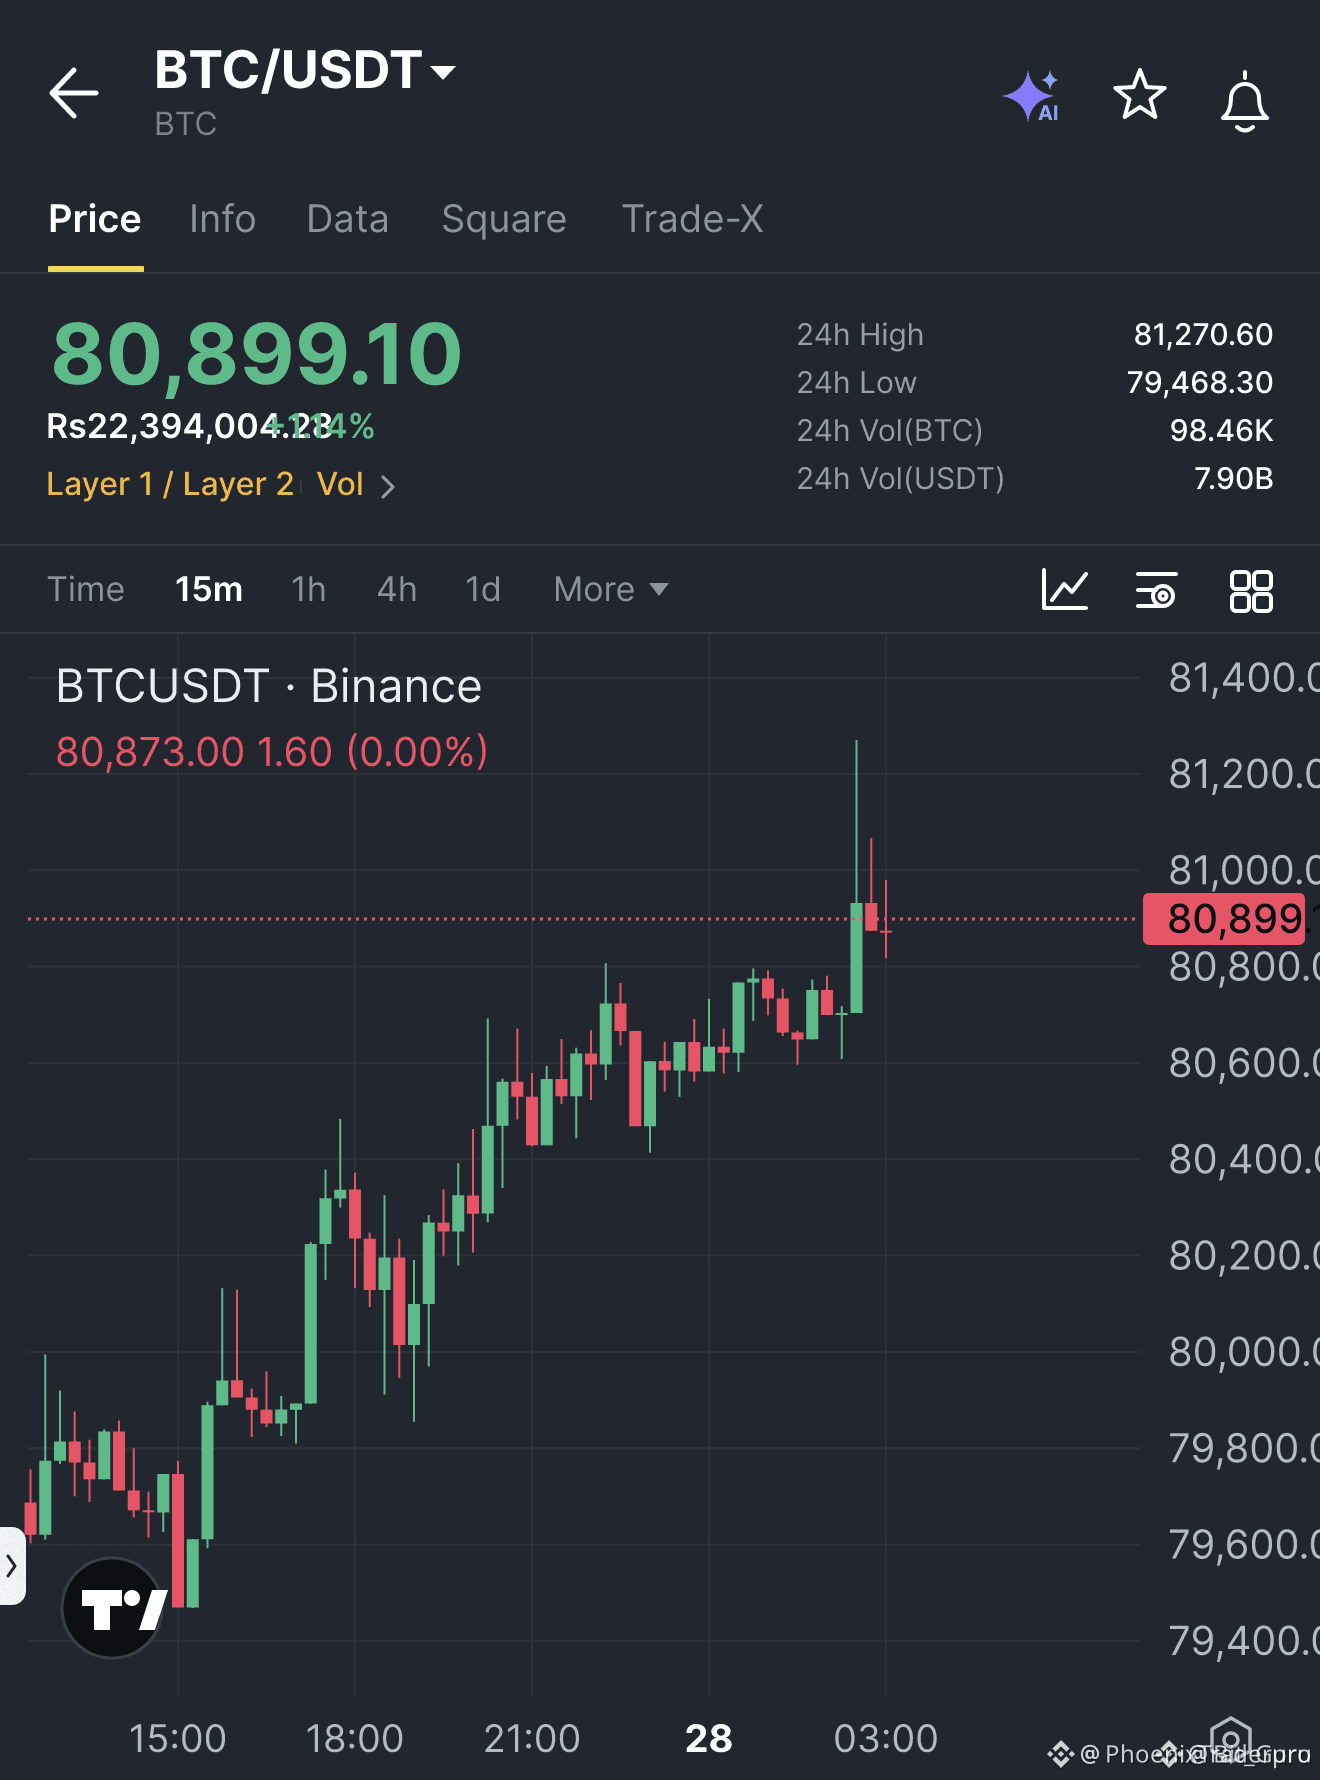
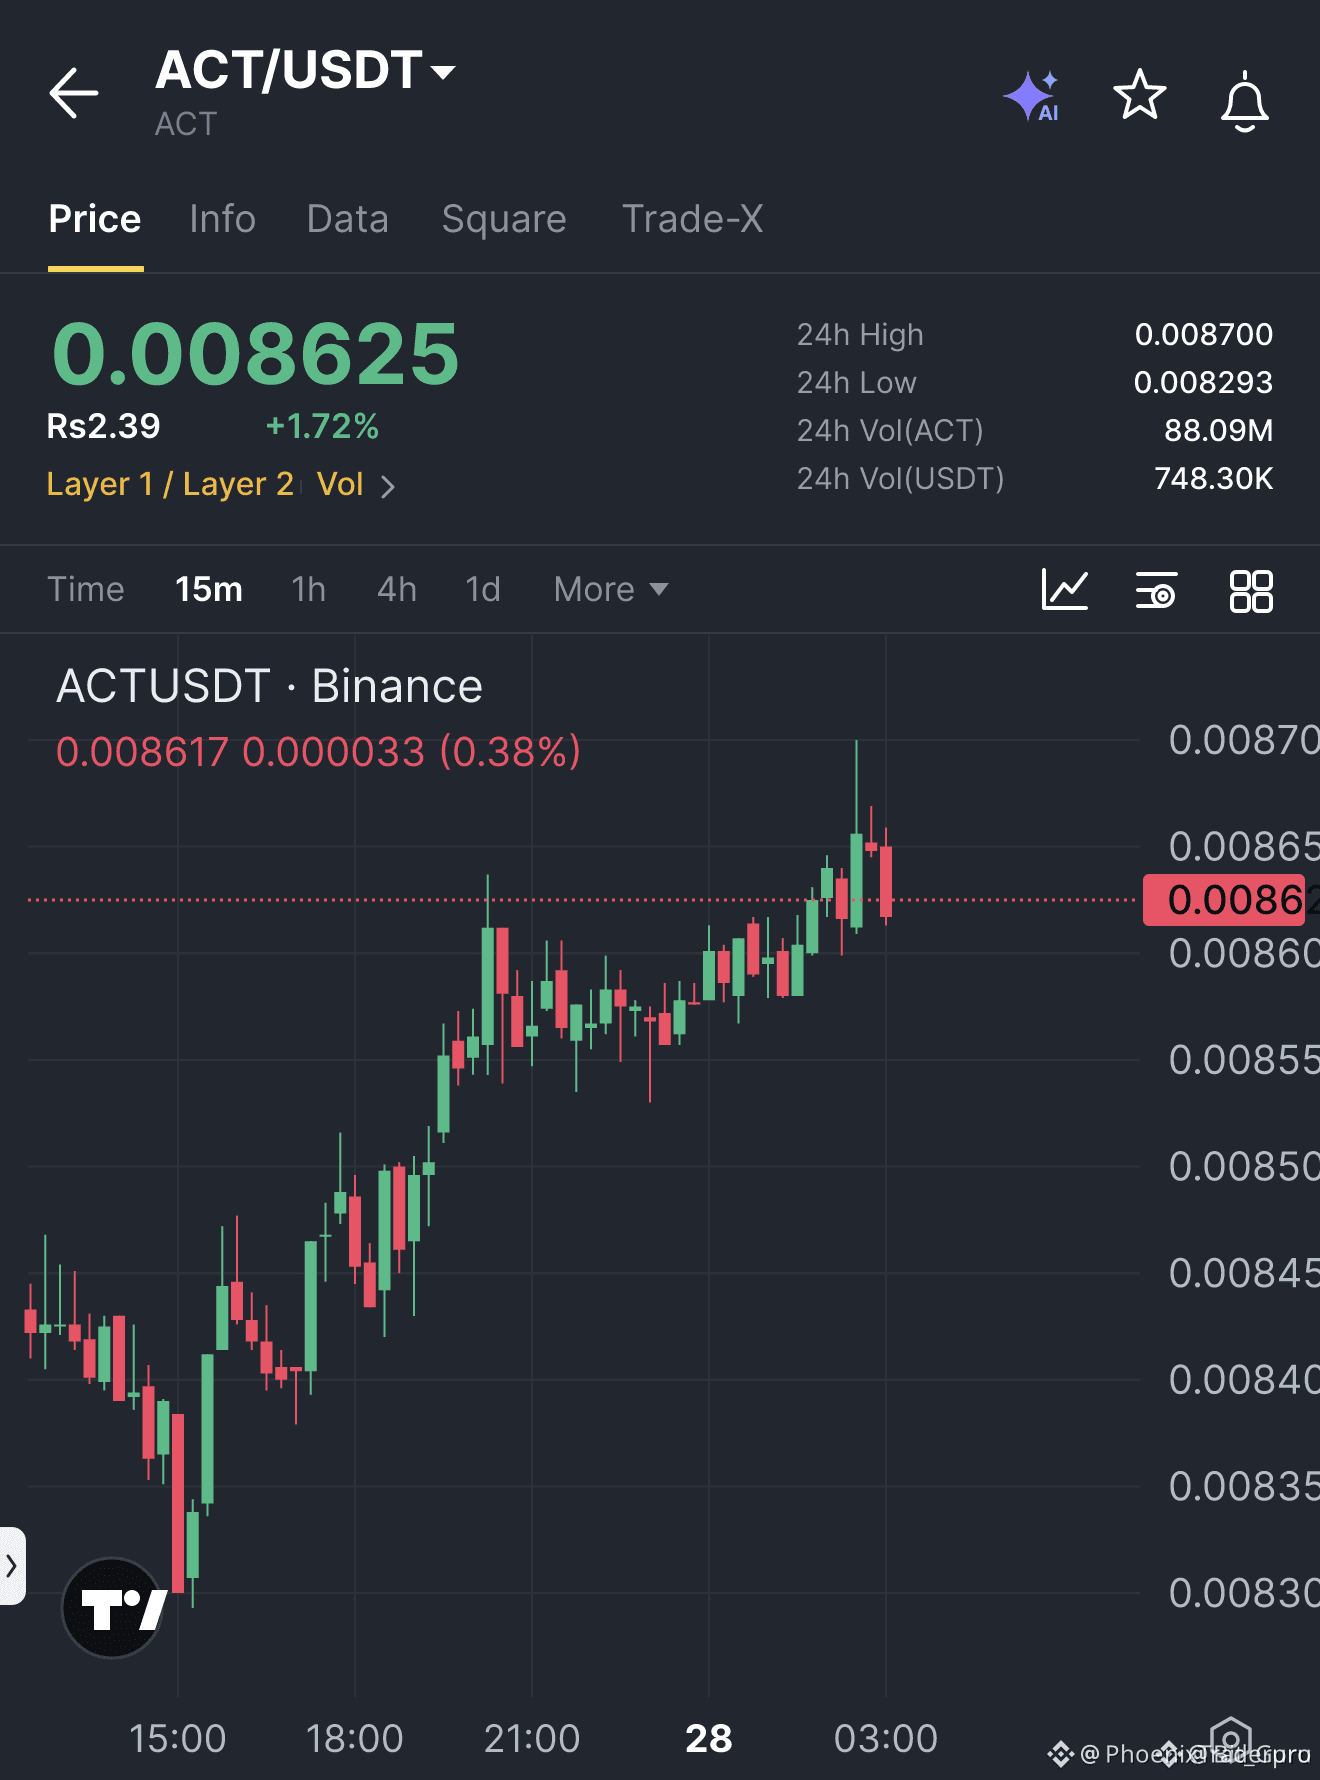
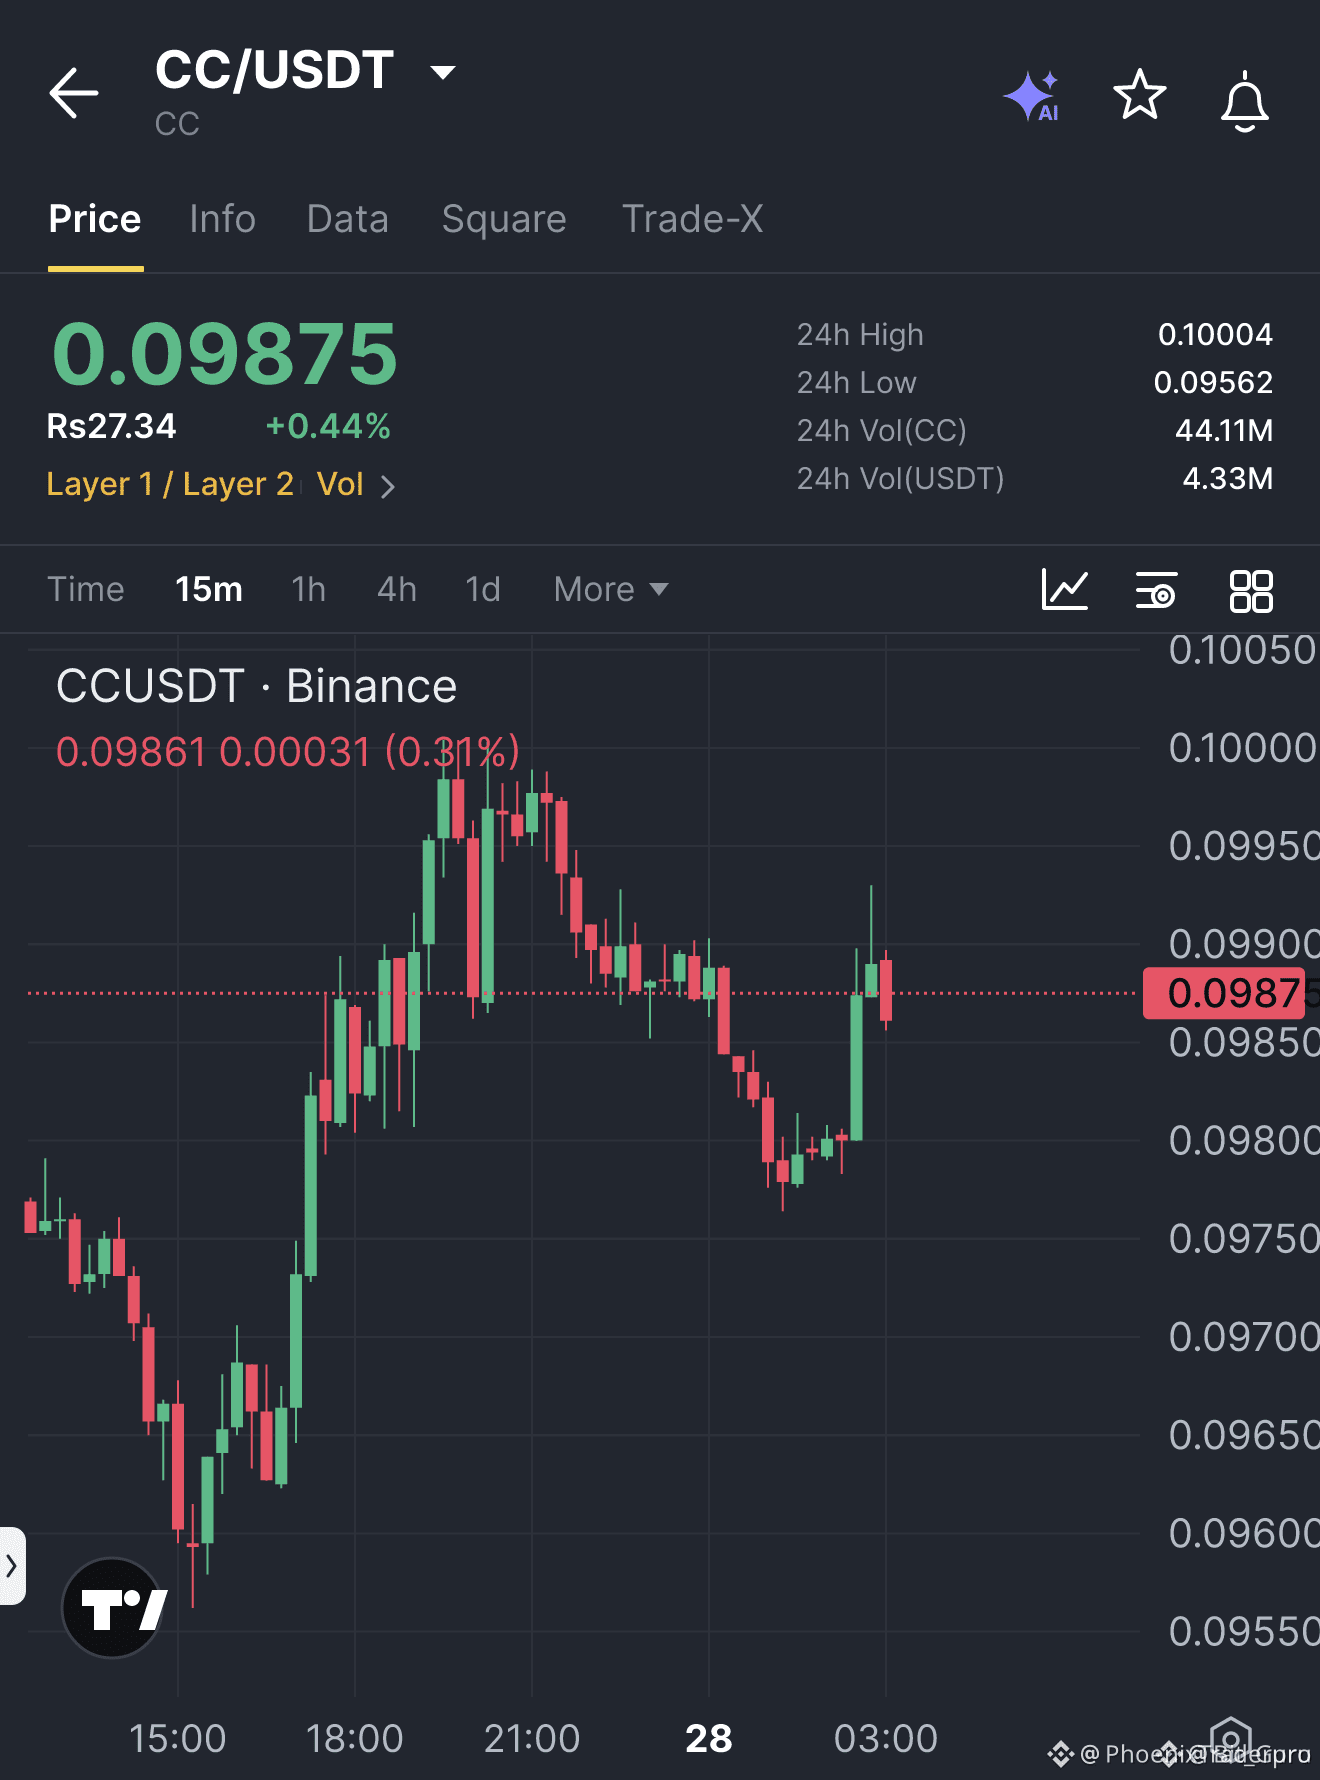
24

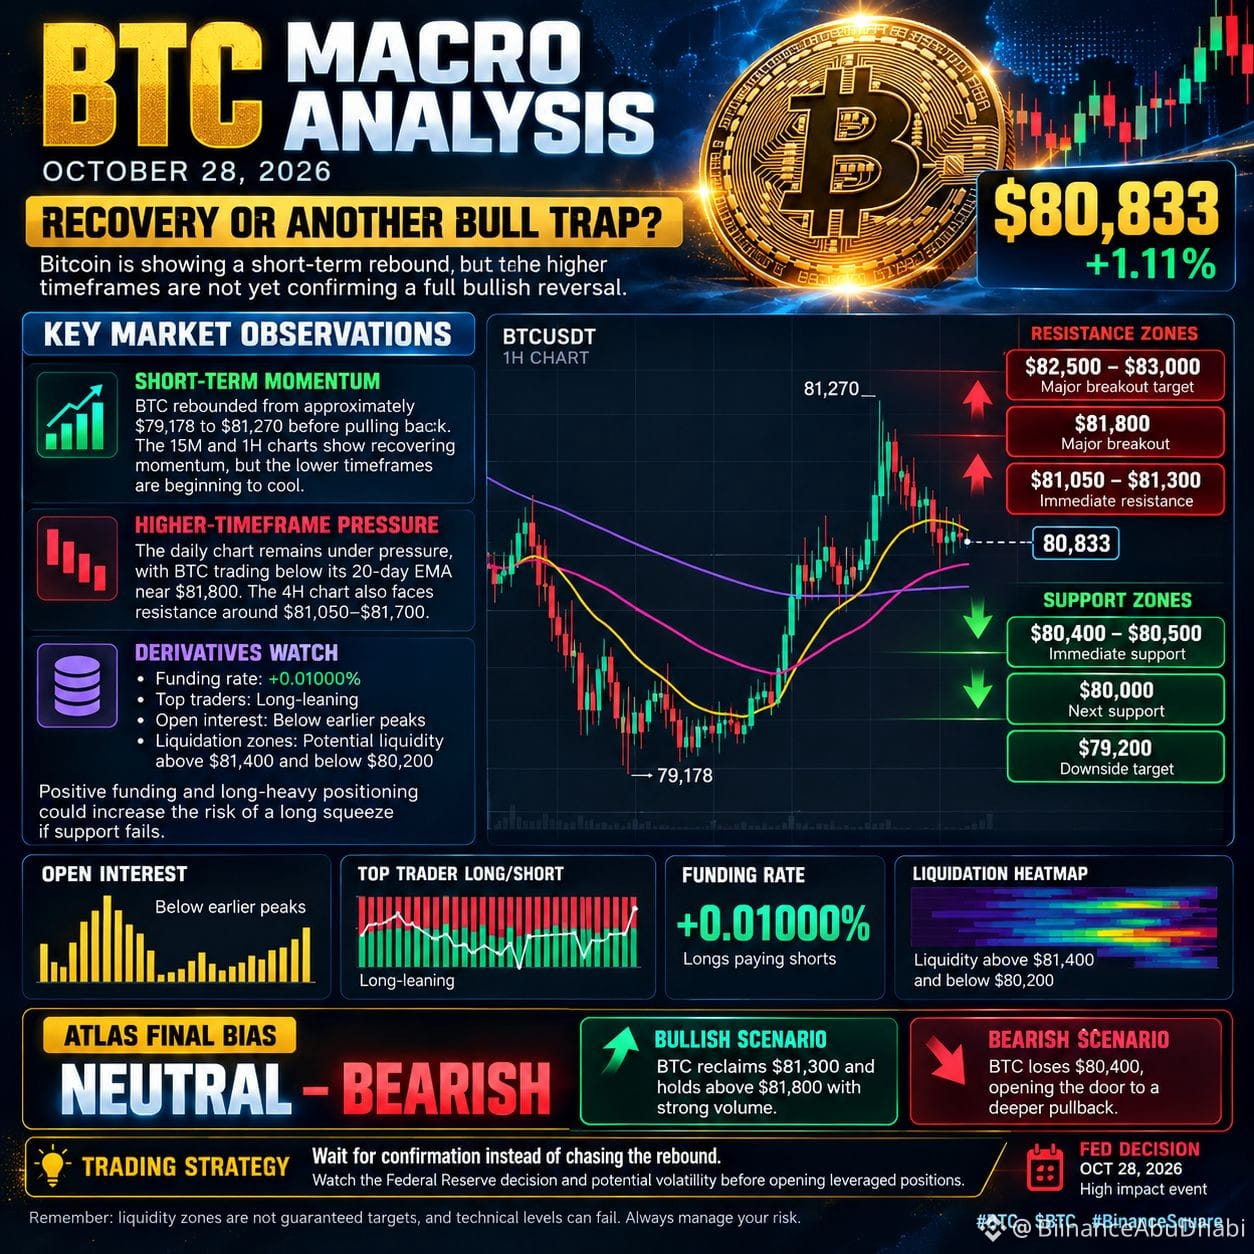
📊 BTC MACRO ANALYSIS OCTOBER 28, 2026 02:53AM GST
.
₿ Bitcoin at $80,833 — Recovery or Another Bull Trap?
.
Bitcoin is showing a short-term rebound, but the higher timeframes are not yet confirming a full bullish reversal. The next major resistance zone could determine BTC’s direction.
.
🔎 KEY MARKET OBSERVATIONS
.
📈 Short-Term Momentum
BTC rebounded from approximately $79,178 to $81,270 before pulling back. The 15M and 1H charts show recovering momentum, but the lower timeframes are beginning to cool.
.
⚠️ Higher-Timeframe Pressure
The daily chart remains under pressure, with BTC trading below its 20-day EMA near $81,800. The 4H chart also faces resistance around $81,050–$81,700.
.
📊 Derivatives Watch
• Funding rate: +0.01000%
• Top traders: Long-leaning
• Open interest: Below earlier peaks
• Liquidation zones: Potential liquidity above $81,400 and below $80,200
.
Positive funding and long-heavy positioning could increase the risk of a long squeeze if support fails.
.
🎯 IMPORTANT BTC LEVELS
.
🟢 Resistance: $81,050–$81,300
🚀 Major breakout: $81,800
🎯 Upside targets: $82,500–$83,000
.
🔴 Immediate support: $80,400–$80,500
⚠️ Breakdown risk: Below $80,400
🎯 Downside targets: $80,000 → $79,200
.
📌 FINAL BIAS: NEUTRAL–BEARISH
.
✅ Bullish scenario: BTC reclaims $81,300 and holds above $81,800 with strong volume.
.
❌ Bearish scenario: BTC loses $80,400, opening the door to a deeper pullback.
.
🛡️ Trading strategy: Wait for confirmation instead of chasing the rebound. Watch the Federal Reserve decision and potential volatility before opening leveraged positions.
.
Remember: liquidity zones are not guaranteed targets, and technical levels can fail.
.
💬 What’s your view? Will BTC break above $81,800 or revisit $79,200 first?
.
#BTC $BTC #BinanceSquare #Bitcoin #MacroAnalysis
.
₿ Bitcoin at $80,833 — Recovery or Another Bull Trap?
.
Bitcoin is showing a short-term rebound, but the higher timeframes are not yet confirming a full bullish reversal. The next major resistance zone could determine BTC’s direction.
.
🔎 KEY MARKET OBSERVATIONS
.
📈 Short-Term Momentum
BTC rebounded from approximately $79,178 to $81,270 before pulling back. The 15M and 1H charts show recovering momentum, but the lower timeframes are beginning to cool.
.
⚠️ Higher-Timeframe Pressure
The daily chart remains under pressure, with BTC trading below its 20-day EMA near $81,800. The 4H chart also faces resistance around $81,050–$81,700.
.
📊 Derivatives Watch
• Funding rate: +0.01000%
• Top traders: Long-leaning
• Open interest: Below earlier peaks
• Liquidation zones: Potential liquidity above $81,400 and below $80,200
.
Positive funding and long-heavy positioning could increase the risk of a long squeeze if support fails.
.
🎯 IMPORTANT BTC LEVELS
.
🟢 Resistance: $81,050–$81,300
🚀 Major breakout: $81,800
🎯 Upside targets: $82,500–$83,000
.
🔴 Immediate support: $80,400–$80,500
⚠️ Breakdown risk: Below $80,400
🎯 Downside targets: $80,000 → $79,200
.
📌 FINAL BIAS: NEUTRAL–BEARISH
.
✅ Bullish scenario: BTC reclaims $81,300 and holds above $81,800 with strong volume.
.
❌ Bearish scenario: BTC loses $80,400, opening the door to a deeper pullback.
.
🛡️ Trading strategy: Wait for confirmation instead of chasing the rebound. Watch the Federal Reserve decision and potential volatility before opening leveraged positions.
.
Remember: liquidity zones are not guaranteed targets, and technical levels can fail.
.
💬 What’s your view? Will BTC break above $81,800 or revisit $79,200 first?
.
#BTC $BTC #BinanceSquare #Bitcoin #MacroAnalysis
37

·
--
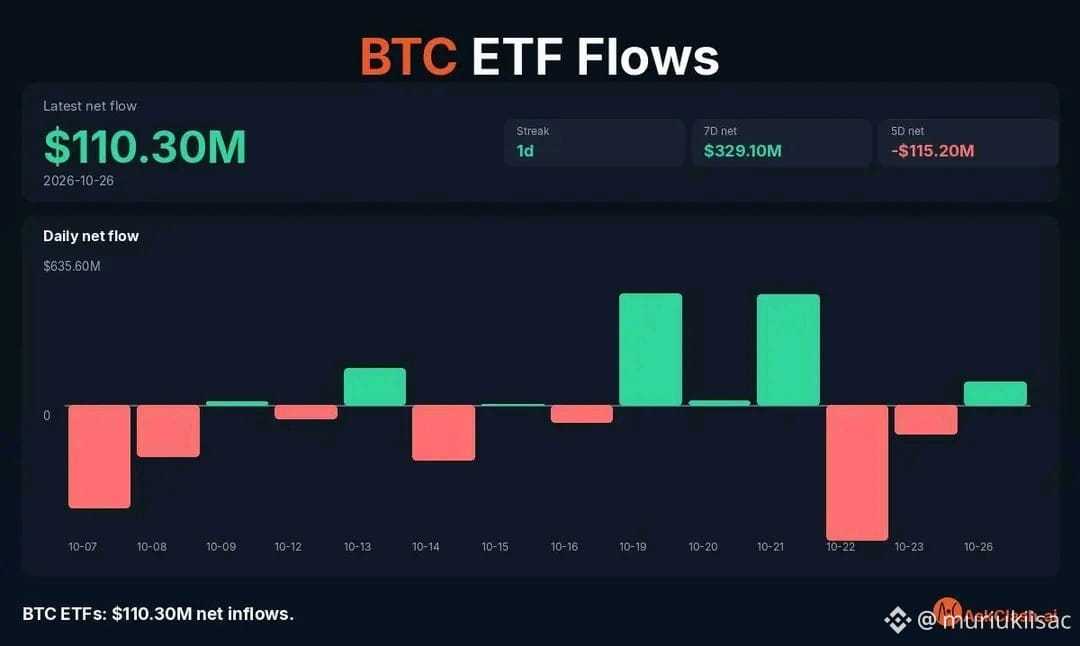
🚨 LATEST: U.S. spot Bitcoin ETFs attracted $110.3 million in net inflows yesterday 🚀
BlackRock's $IBIT accounted for ALL of it. The other 11 funds reported zero net flows.
Two days of outflows snapped, with one fund doing all the heavy lifting.
#CanMicrosoftDeliverOnAI
#CanGoogleDefindItsCore
#FOMCWatch
#BTC $BNB $BTC $ZEC
BlackRock's $IBIT accounted for ALL of it. The other 11 funds reported zero net flows.
Two days of outflows snapped, with one fund doing all the heavy lifting.
#CanMicrosoftDeliverOnAI
#CanGoogleDefindItsCore
#FOMCWatch
#BTC $BNB $BTC $ZEC
1
522

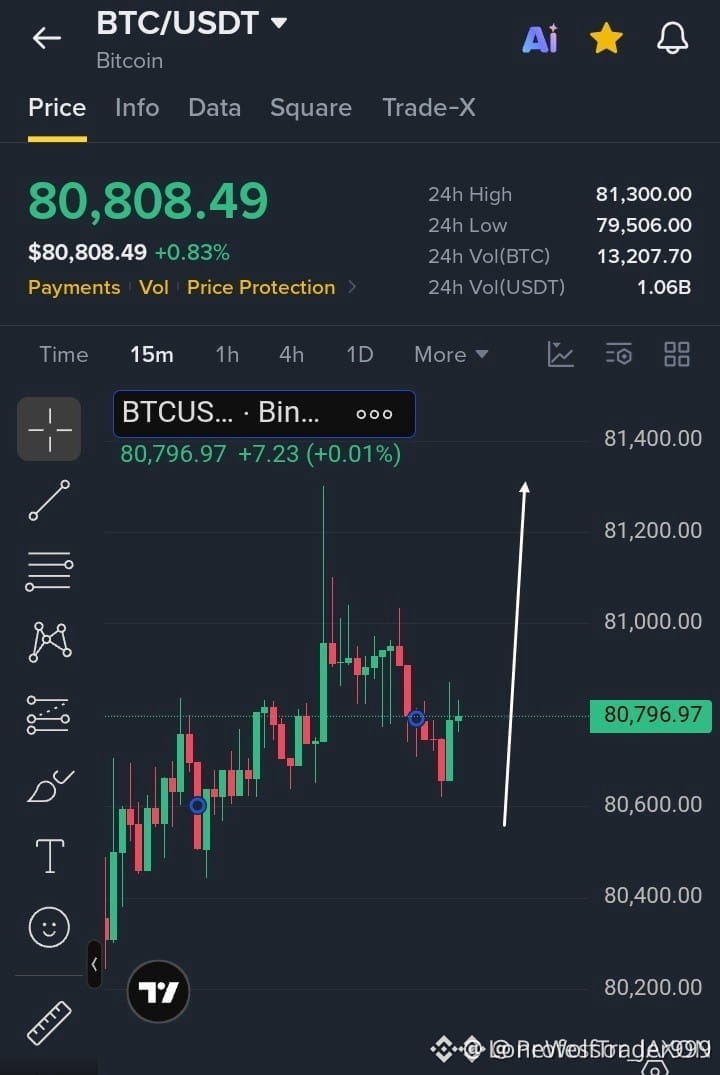
🚀🦈 $BTC SURGES TOWARD 81K AS WHALES RECLAIM THE UPPER ZONE!
Entry: 80,750‑80,850 ⚡
Target: 81,000 🚀
Target: 81,200 🚀
Target: 81,350 🚀
Stop Loss: 80,550 ⚠️
Buyers are stacking above the 80,600 floor, and the order flow shows a clear liquidity sweep at the 80,850 ceiling. 📊⚡ The 4‑hour volume is ticking up, feeding the breakout momentum.
If the price cracks 80,850, the next resistance corridor of 81,000‑81,350 lights up like a runway for the next wave. 🌊📌 Smart money is likely to defend that zone, turning the move into a mini‑rocket. 💬 Are you ready to ride the surge or waiting for the next dip? 👇
⚠️ Not financial advice. Always manage your risk. 🛡️
🏷️ #BTC #LongSetup #Bullish #Crypto
🚀 ⚡

·
--
🚀 $BTC EYES THE NEXT TOP‑10 SPOT SURGE! 📈
📊 Institutional order flow on the 4H chart shows a tightening range around the 27,800‑28,200 zone, a classic liquidity pool where smart money often accumulates before a breakout. 🦈 A subtle bullish order block formed last session, and volume is ticking up, hinting at an impending push toward the 30k threshold. 💡 Keep an eye on the break of the 28,200 line; a clean close could trigger a swift rally as the market reclaims the higher‑timeframe bias. 💬 Do you anticipate a swift climb to the next resistance or a consolidation test first? 👇
⚠️ Not financial advice. Always manage your risk. 🛡️
🏷️ #BTC #LongSetup #LiquidityHunt #Crypto
🔥 🚀
2

🚨 A $60M WHALE JUST BID THE $BTC DIP WITH 20X LEVERAGE! 🦈
Entry: 75,821 - 76,500 ⚡
Smart money isn't waiting around for permission. 🦈 On-chain metrics reveal a heavy whale account just filled $9.3M of a massive $60M buy grid on $BTC , locking in 121.5 BTC at an average price of $76,499 with 20x leverage.
With another 671 BTC in limit bids stacked between $75,479 and $76,245, this player is aggressively absorbing sell pressure right beneath current market price. 📊 The position is already in green profit with zero intention of pulling liquidity.
💡 When institutional bids anchor $50M+ in passive buy ladders, market dips tend to get swallowed fast. 💬 Are you bidding alongside this whale liquidity or waiting for one more sweep? 👇
⚠️ Not financial advice. Always manage your risk. 🛡️
🏷️ #BTC #WhaleAlert #LongSetup #Crypto
🔥 🦈
4

·
--
$BTC After 6 Years of Losses, Ariel's Bobrinskoy Says Bonds Are Back. Ariel's Charlie Bobrinskoy says bonds are worth buying as the 10-year Treasury yields 5% and AI-linked stocks wobble.
📈 Trade impact on $BTC: Strong institutional demand is bullish and supports dip-buying on pullbacks. Watch for a breakout continuation if volume holds above key resistance.
How are you trading this move? 👇
#BTC #Crypto #News
$BTC After 6 Years of Losses, Ariel's Bobrinskoy Says Bonds Are Back. Ariel's Charlie Bobrinskoy says bonds are worth buying as the 10-year Treasury yields 5% and AI-linked stocks wobble.
📈 Trade impact on $BTC : Strong institutional demand is bullish and supports dip-buying on pullbacks. Watch for a breakout continuation if volume holds above key resistance.
How are you trading this move? 👇
#BTC #Crypto #News
📈 Trade impact on $BTC : Strong institutional demand is bullish and supports dip-buying on pullbacks. Watch for a breakout continuation if volume holds above key resistance.
How are you trading this move? 👇
#BTC #Crypto #News
10
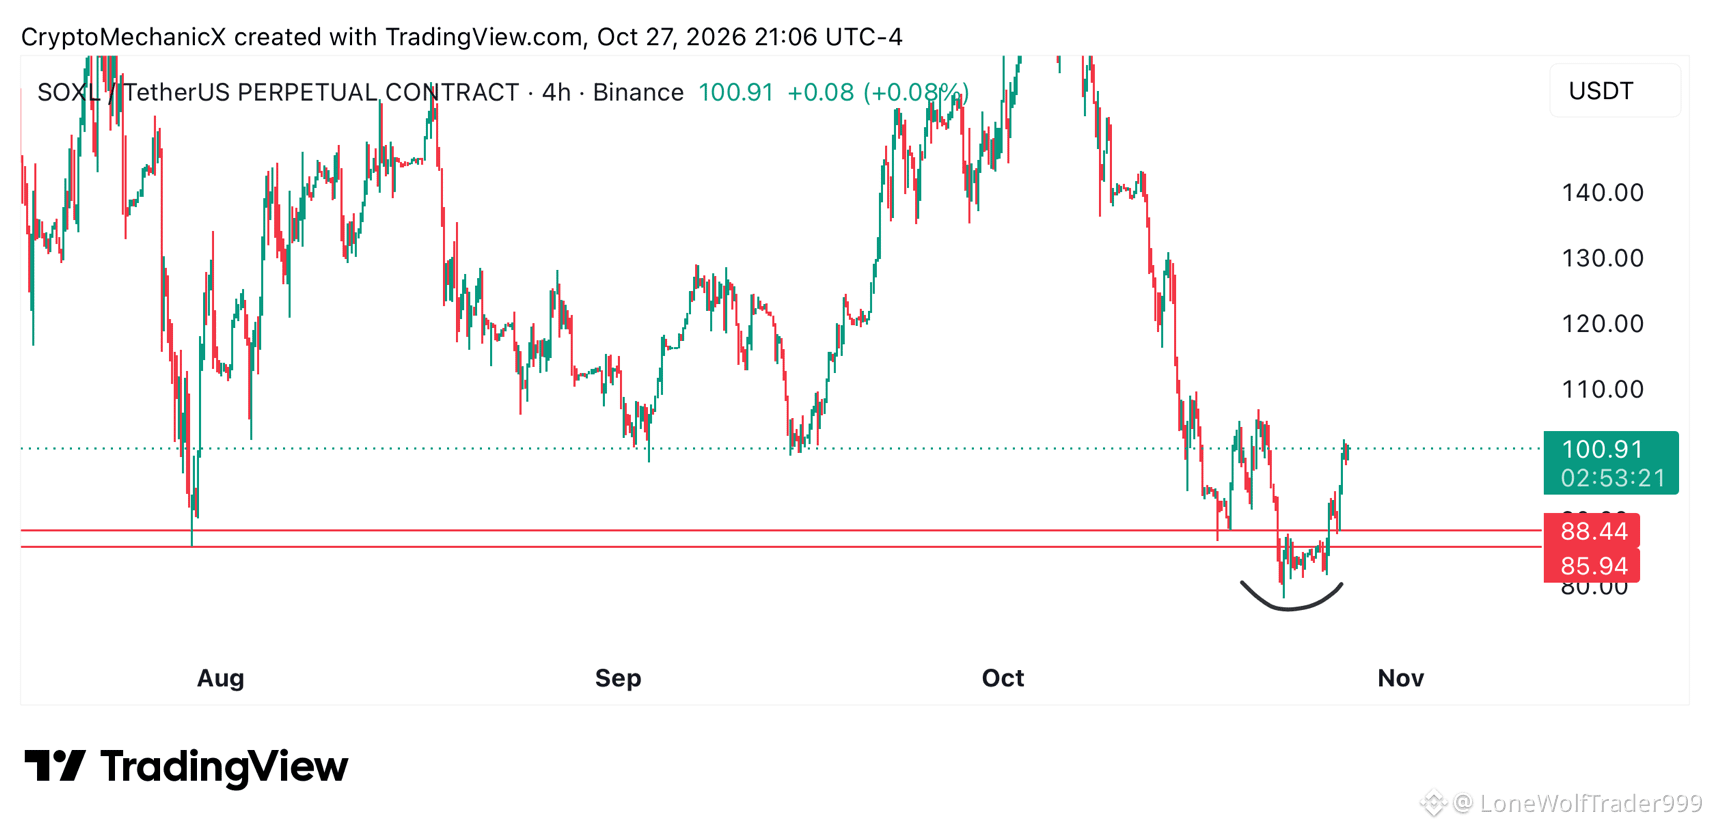
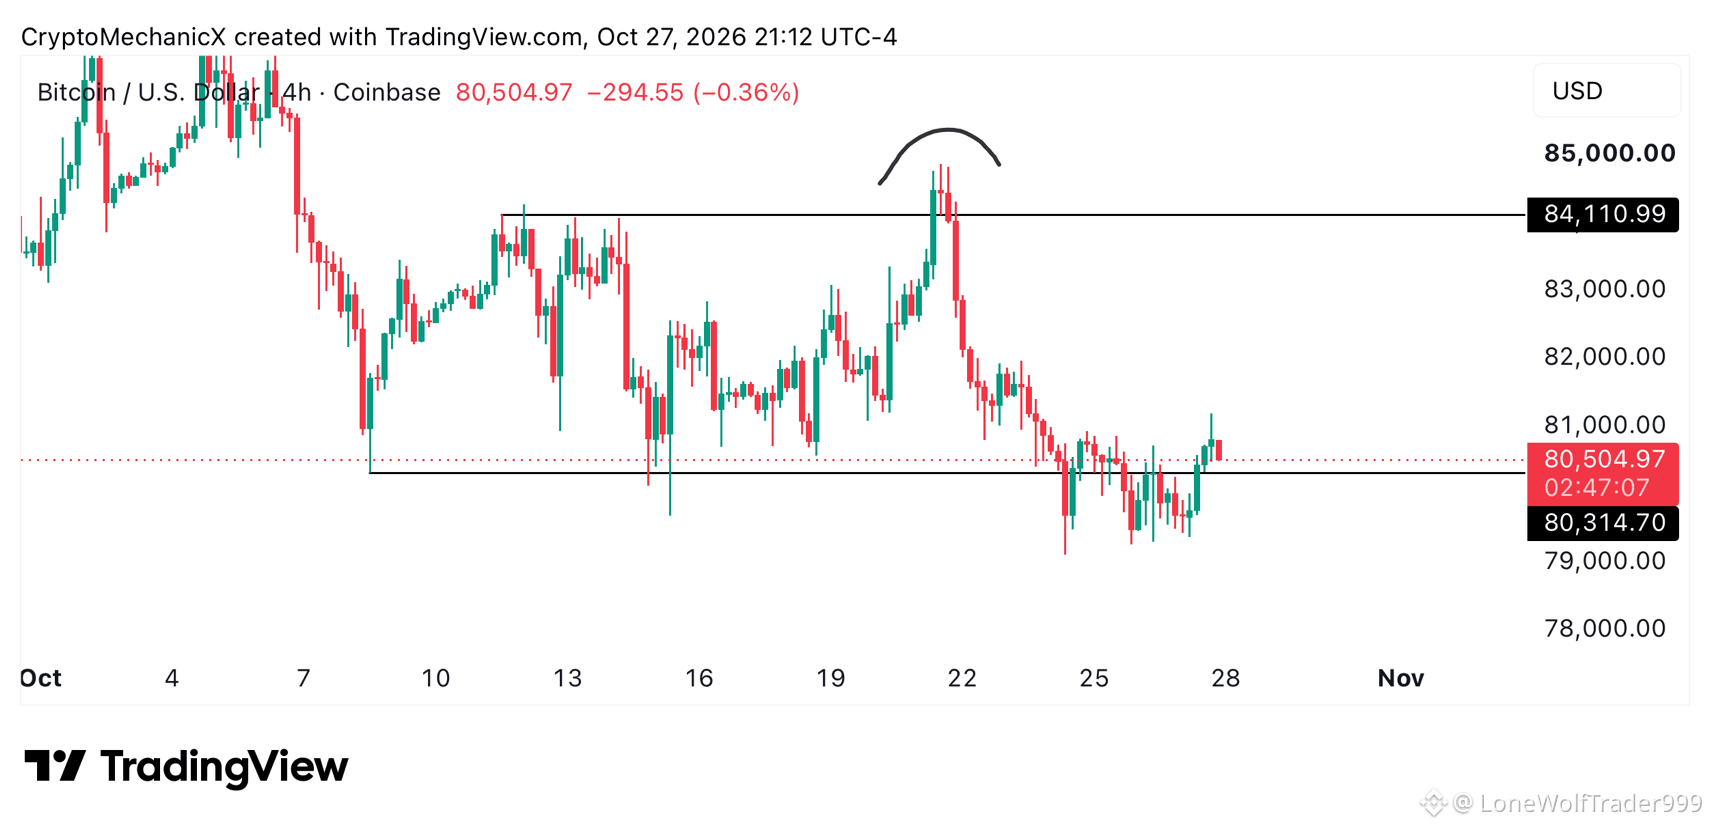
🚀 $BTC RECLAIMS FAKEOUT LOW, BEAR TRAP UNLEASHED! 🦈
📊 The recent $84k dip mirrored the $SOXL play: sellers stormed in, short positions flooded, then price snapped back, slapping the bears with a swift 15% pop. ⚡ When a major low is breached and instantly retaken, liquidity gets locked and the market flips hard—speed is the profit driver. 🐋 Smart money’s already loading the next upward thrust, hunting the freshly‑squeezed shorts.
💬 Are you primed to ride this squeeze or sitting on the sidelines? 👇
⚠️ Not financial advice. Always manage your risk. 🛡️
🏷️ #BTC #BearTrap #Fakeout #Crypto
🐂 🌕

·
--
$USDC -0.02% | $BTC +1.00% | $ETH +1.36%
#USDC held at $1.00, slipping 0.02% while seeing $1.42 B of daily volume.
#BTC rose to $80,846.01, up 1.00% on $1.06 B of flow, keeping the narrative of renewed buying interest alive.
#ETH climbed to $2,351.62, gaining 1.36% with $482.6 M moving through its market.
👀 The disparity between BTC’s larger volume and ETH’s higher percentage gain could hint at shifting trader focus.
#Write2Earn #Binance
11
·
--
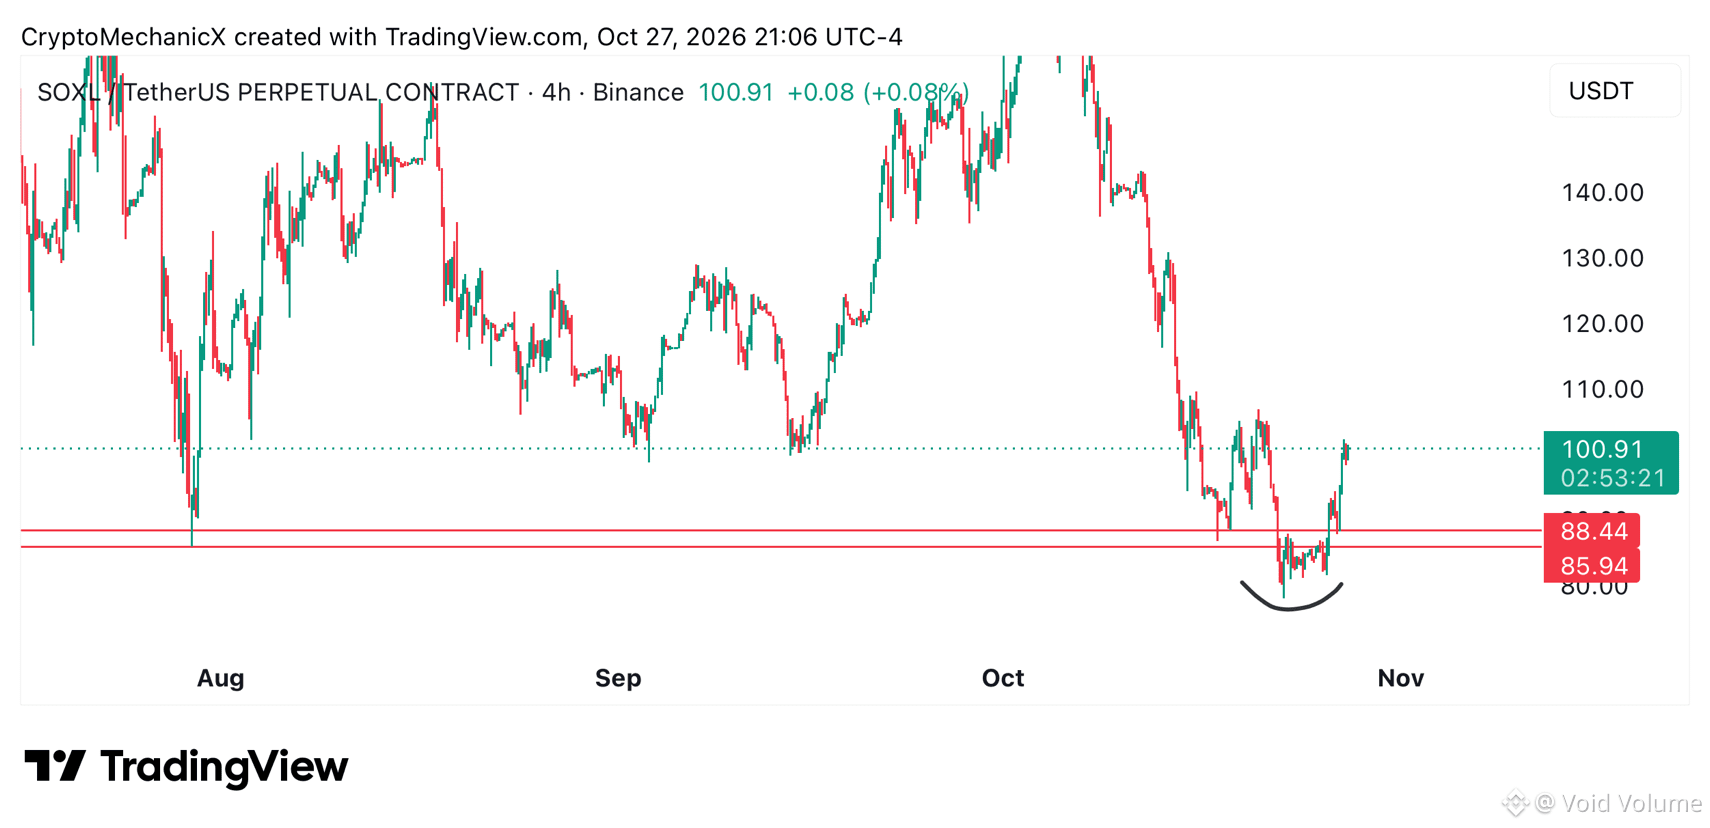
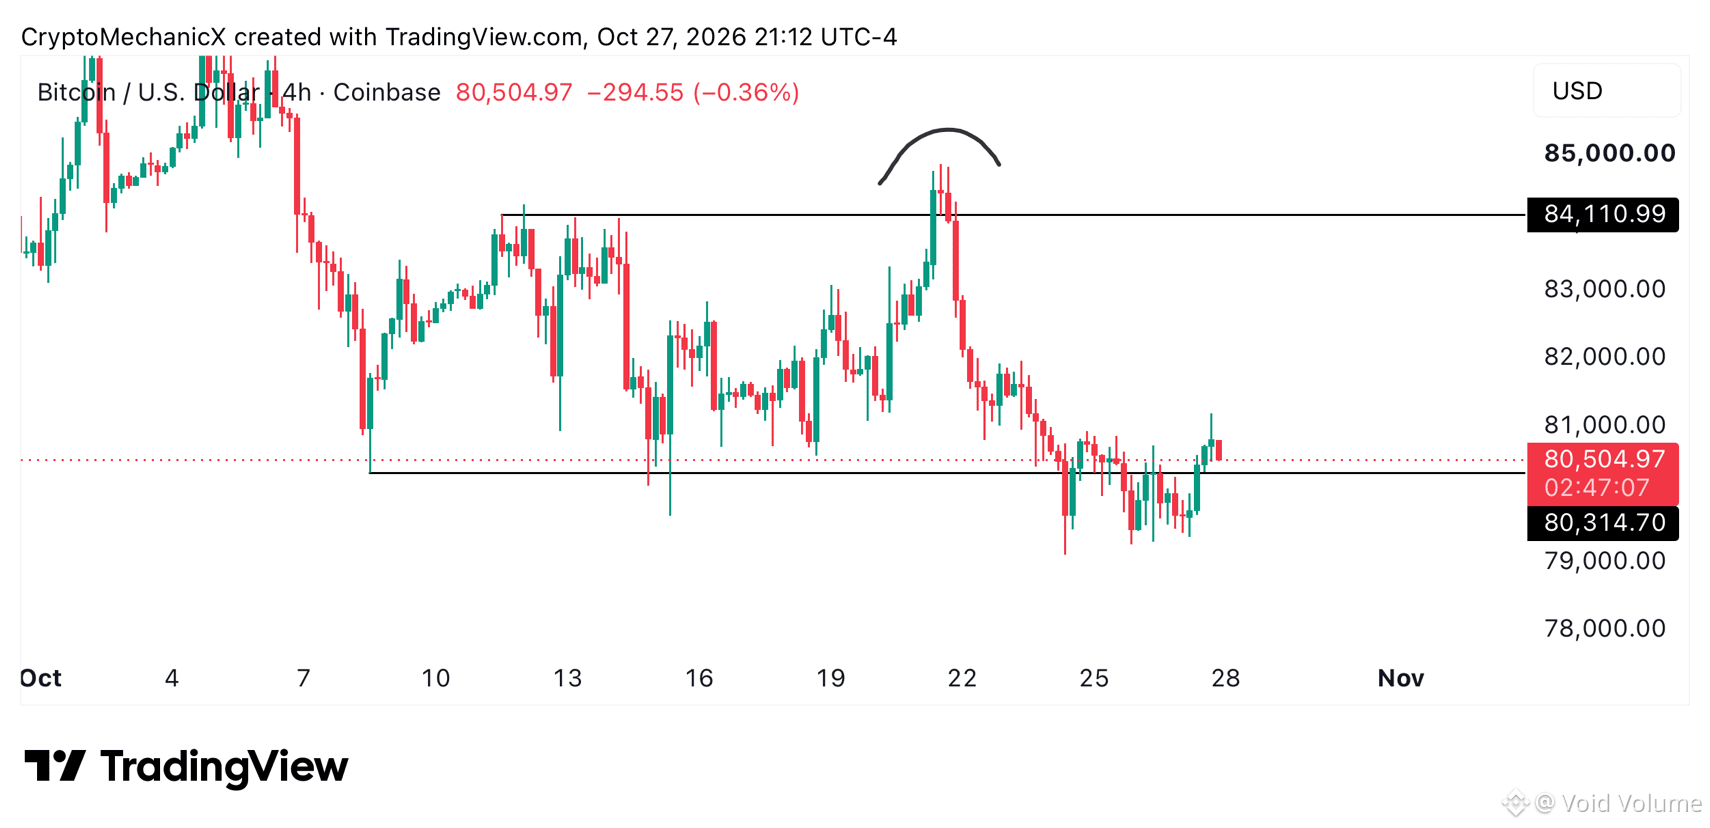
🚨 $BTC FAKEOUT RECLAIM TRAPS BEARS AT $84K 💥
Entry: 84,000 ⚡
📊 The recent $84K breach mirrors classic institutional liquidity hunts – sellers flooded in, pushing the market below a key low, only for smart money to snap the supply and force a 15% rebound. 🦈 This reclamation flips the order block, turning the low into a bullish trap. 📌 Volume surged on the reclaim, confirming the squeeze is not a blip but a deliberate counter‑move.
💡 With the bears now on the back foot, the next leg could test the next resistance zone, but the key is respecting the reclaimed low as a new demand anchor. 🤔 How are you positioning for the post‑squeeze rally? 👇
⚠️ Not financial advice. Always manage your risk. 🛡️
🏷️ #BTC #Fakeout #LiquiditySweep #Crypto
🦈 💎
4

·
--
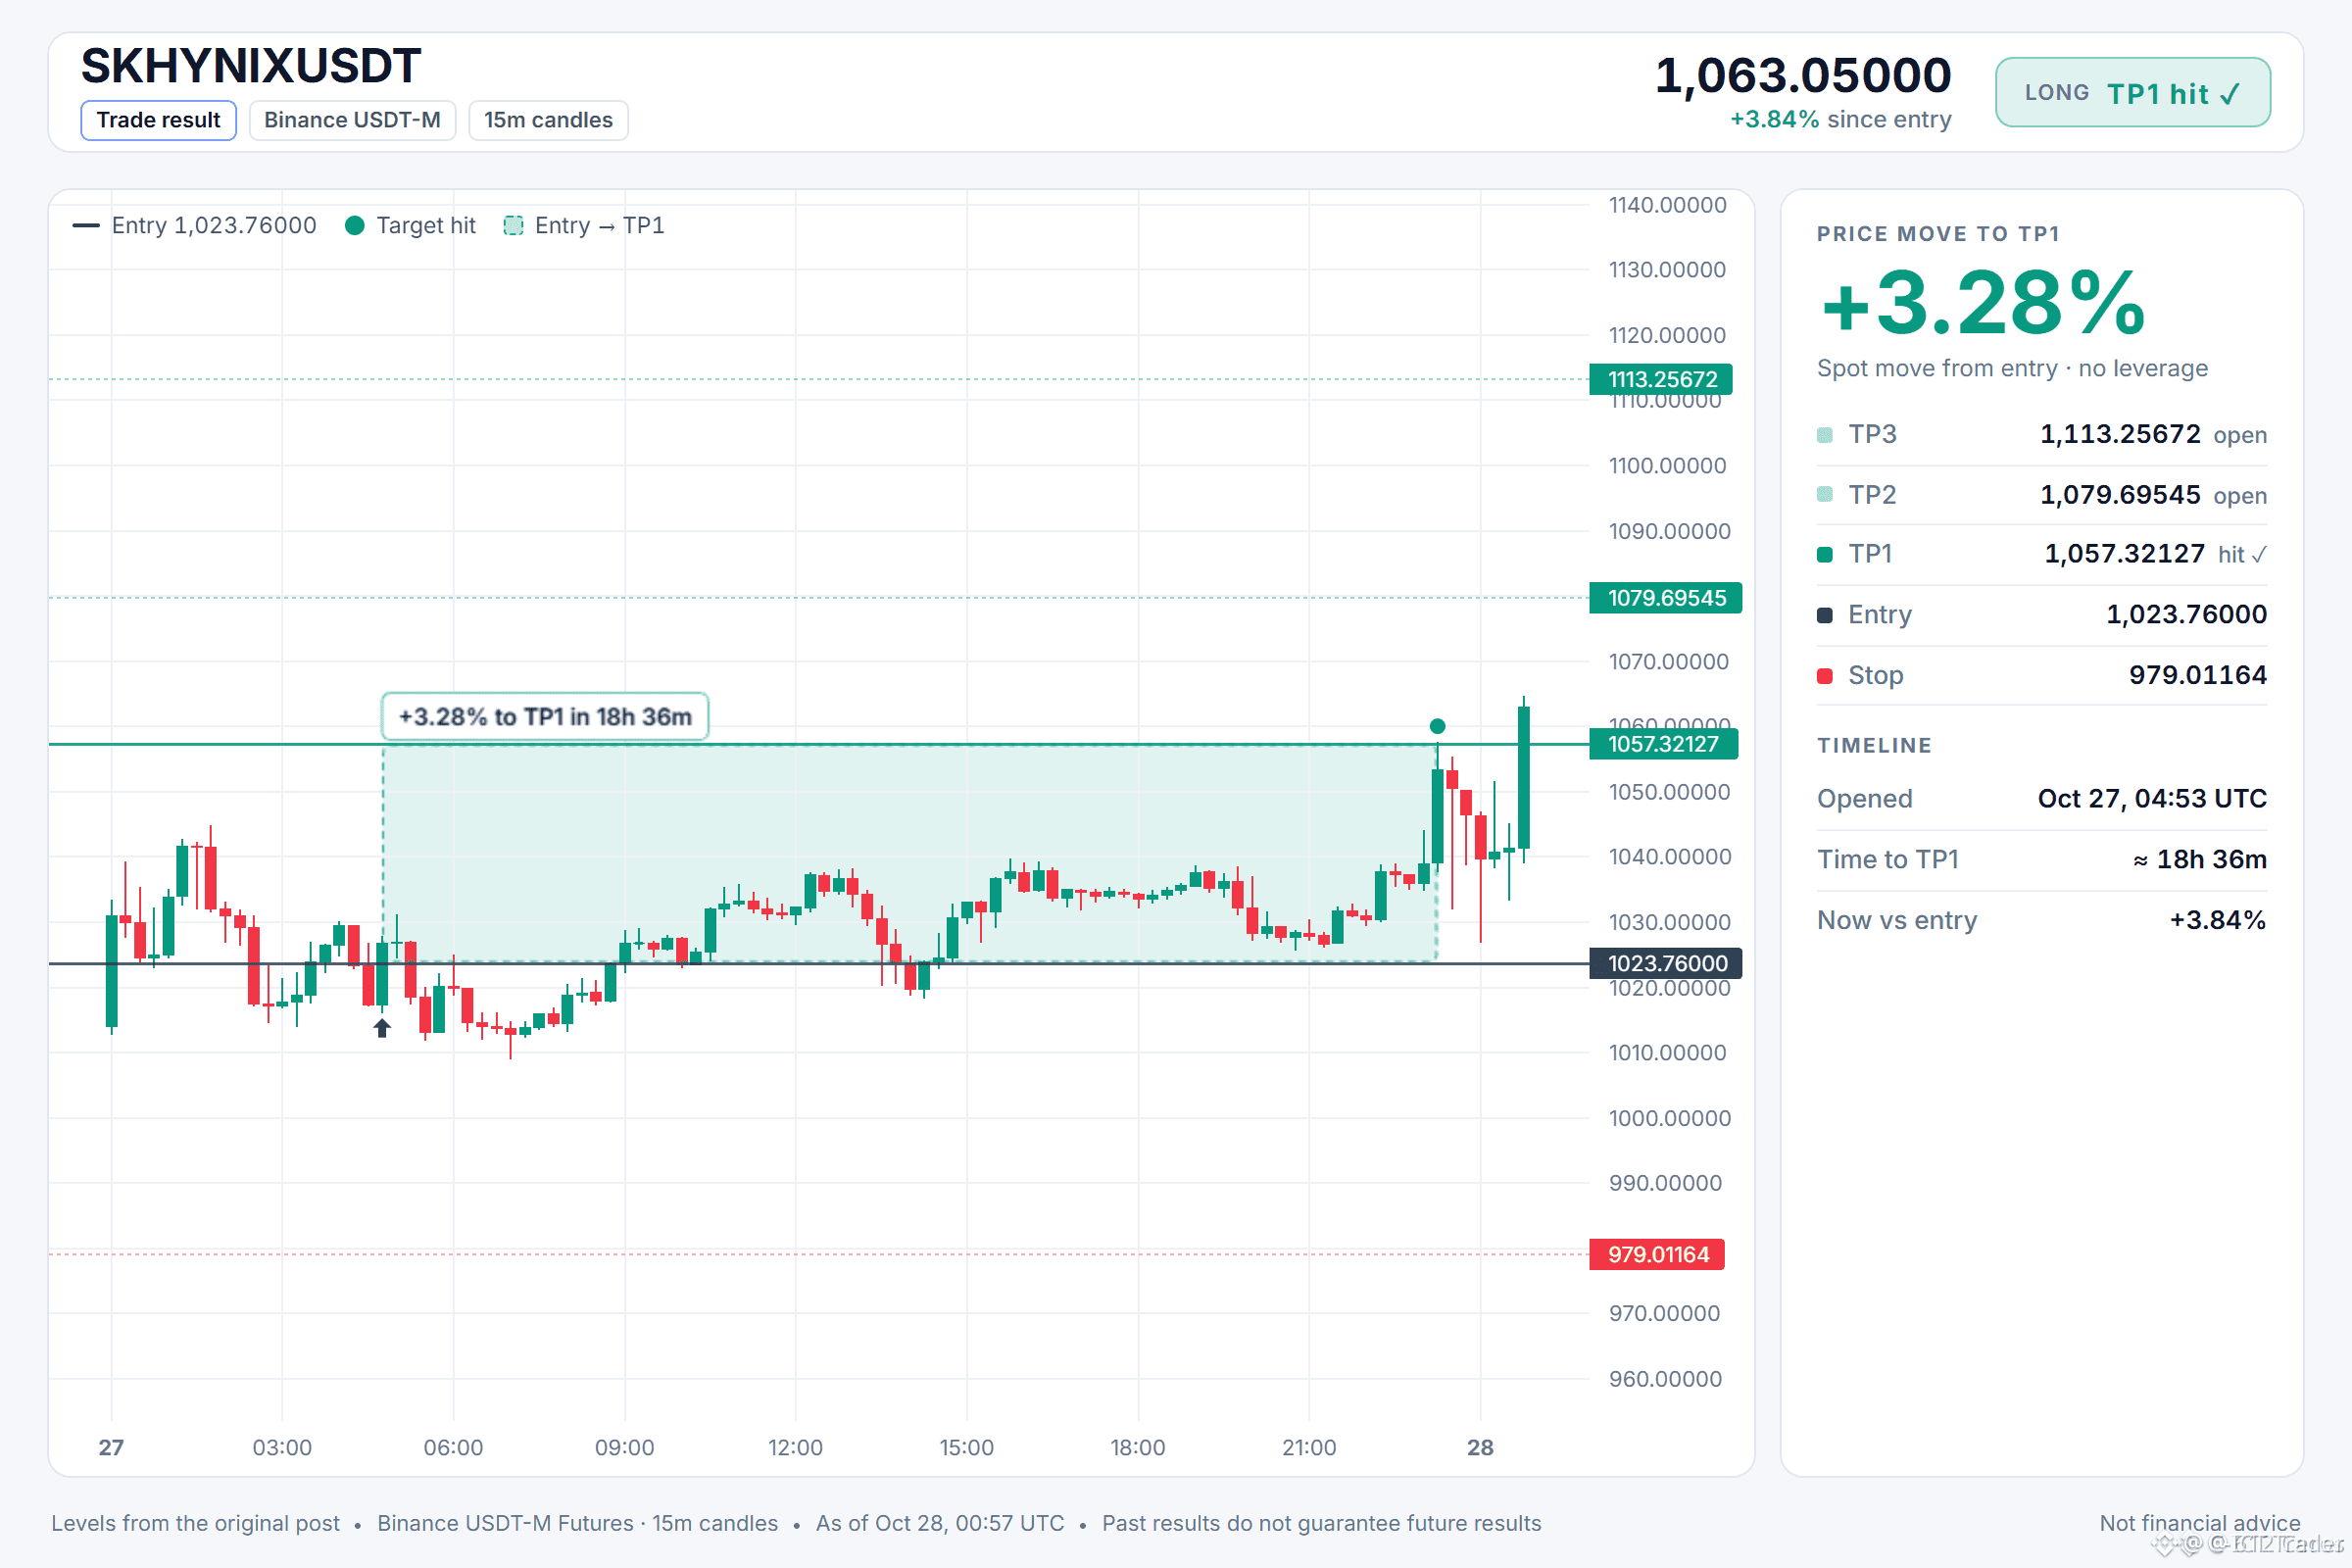
🚀 $BTC LONG HITS TP1 WITH QUICK 3.28% POP! 📈
📊 The TP1 capture unfolded in 18h 36m, a textbook smart‑money profit‑take that cleared the immediate liquidity pool. 🦈 Volume surged on the 4H chart, confirming that institutional buyers were willing to lock in gains without destabilizing the market.
🔍 With price now perched above the executed level, a fresh order block may be forming. Keep an eye on the next pull‑back zone for a disciplined re‑entry, and let the risk‑reward math guide your sizing. 💡
💬 Do you see a new buying opportunity forming on the next retracement? 👇
⚠️ Not financial advice. Always manage your risk. 🛡️
🏷️ #BTC #LongSetup #LiquiditySweep #Crypto
🔥 💎
6

If you had $1000 to invest RIGHT NOW, what would you buy? 💰👇
A) BTC - The King
B) ETH - The Smart Contract King
C) BNB - Binance Power Coin
D) SOL - The Fastest
I'm going 50% BNB + 50% BTC. Low risk, high reward for this bull run.
Your pick? Comment below and let's see what the community is buying tonight!
#BTC #ETH #BNB #sol #CryptoPol
A) BTC - The King
B) ETH - The Smart Contract King
C) BNB - Binance Power Coin
D) SOL - The Fastest
I'm going 50% BNB + 50% BTC. Low risk, high reward for this bull run.
Your pick? Comment below and let's see what the community is buying tonight!
#BTC #ETH #BNB #sol #CryptoPol
14
·
--
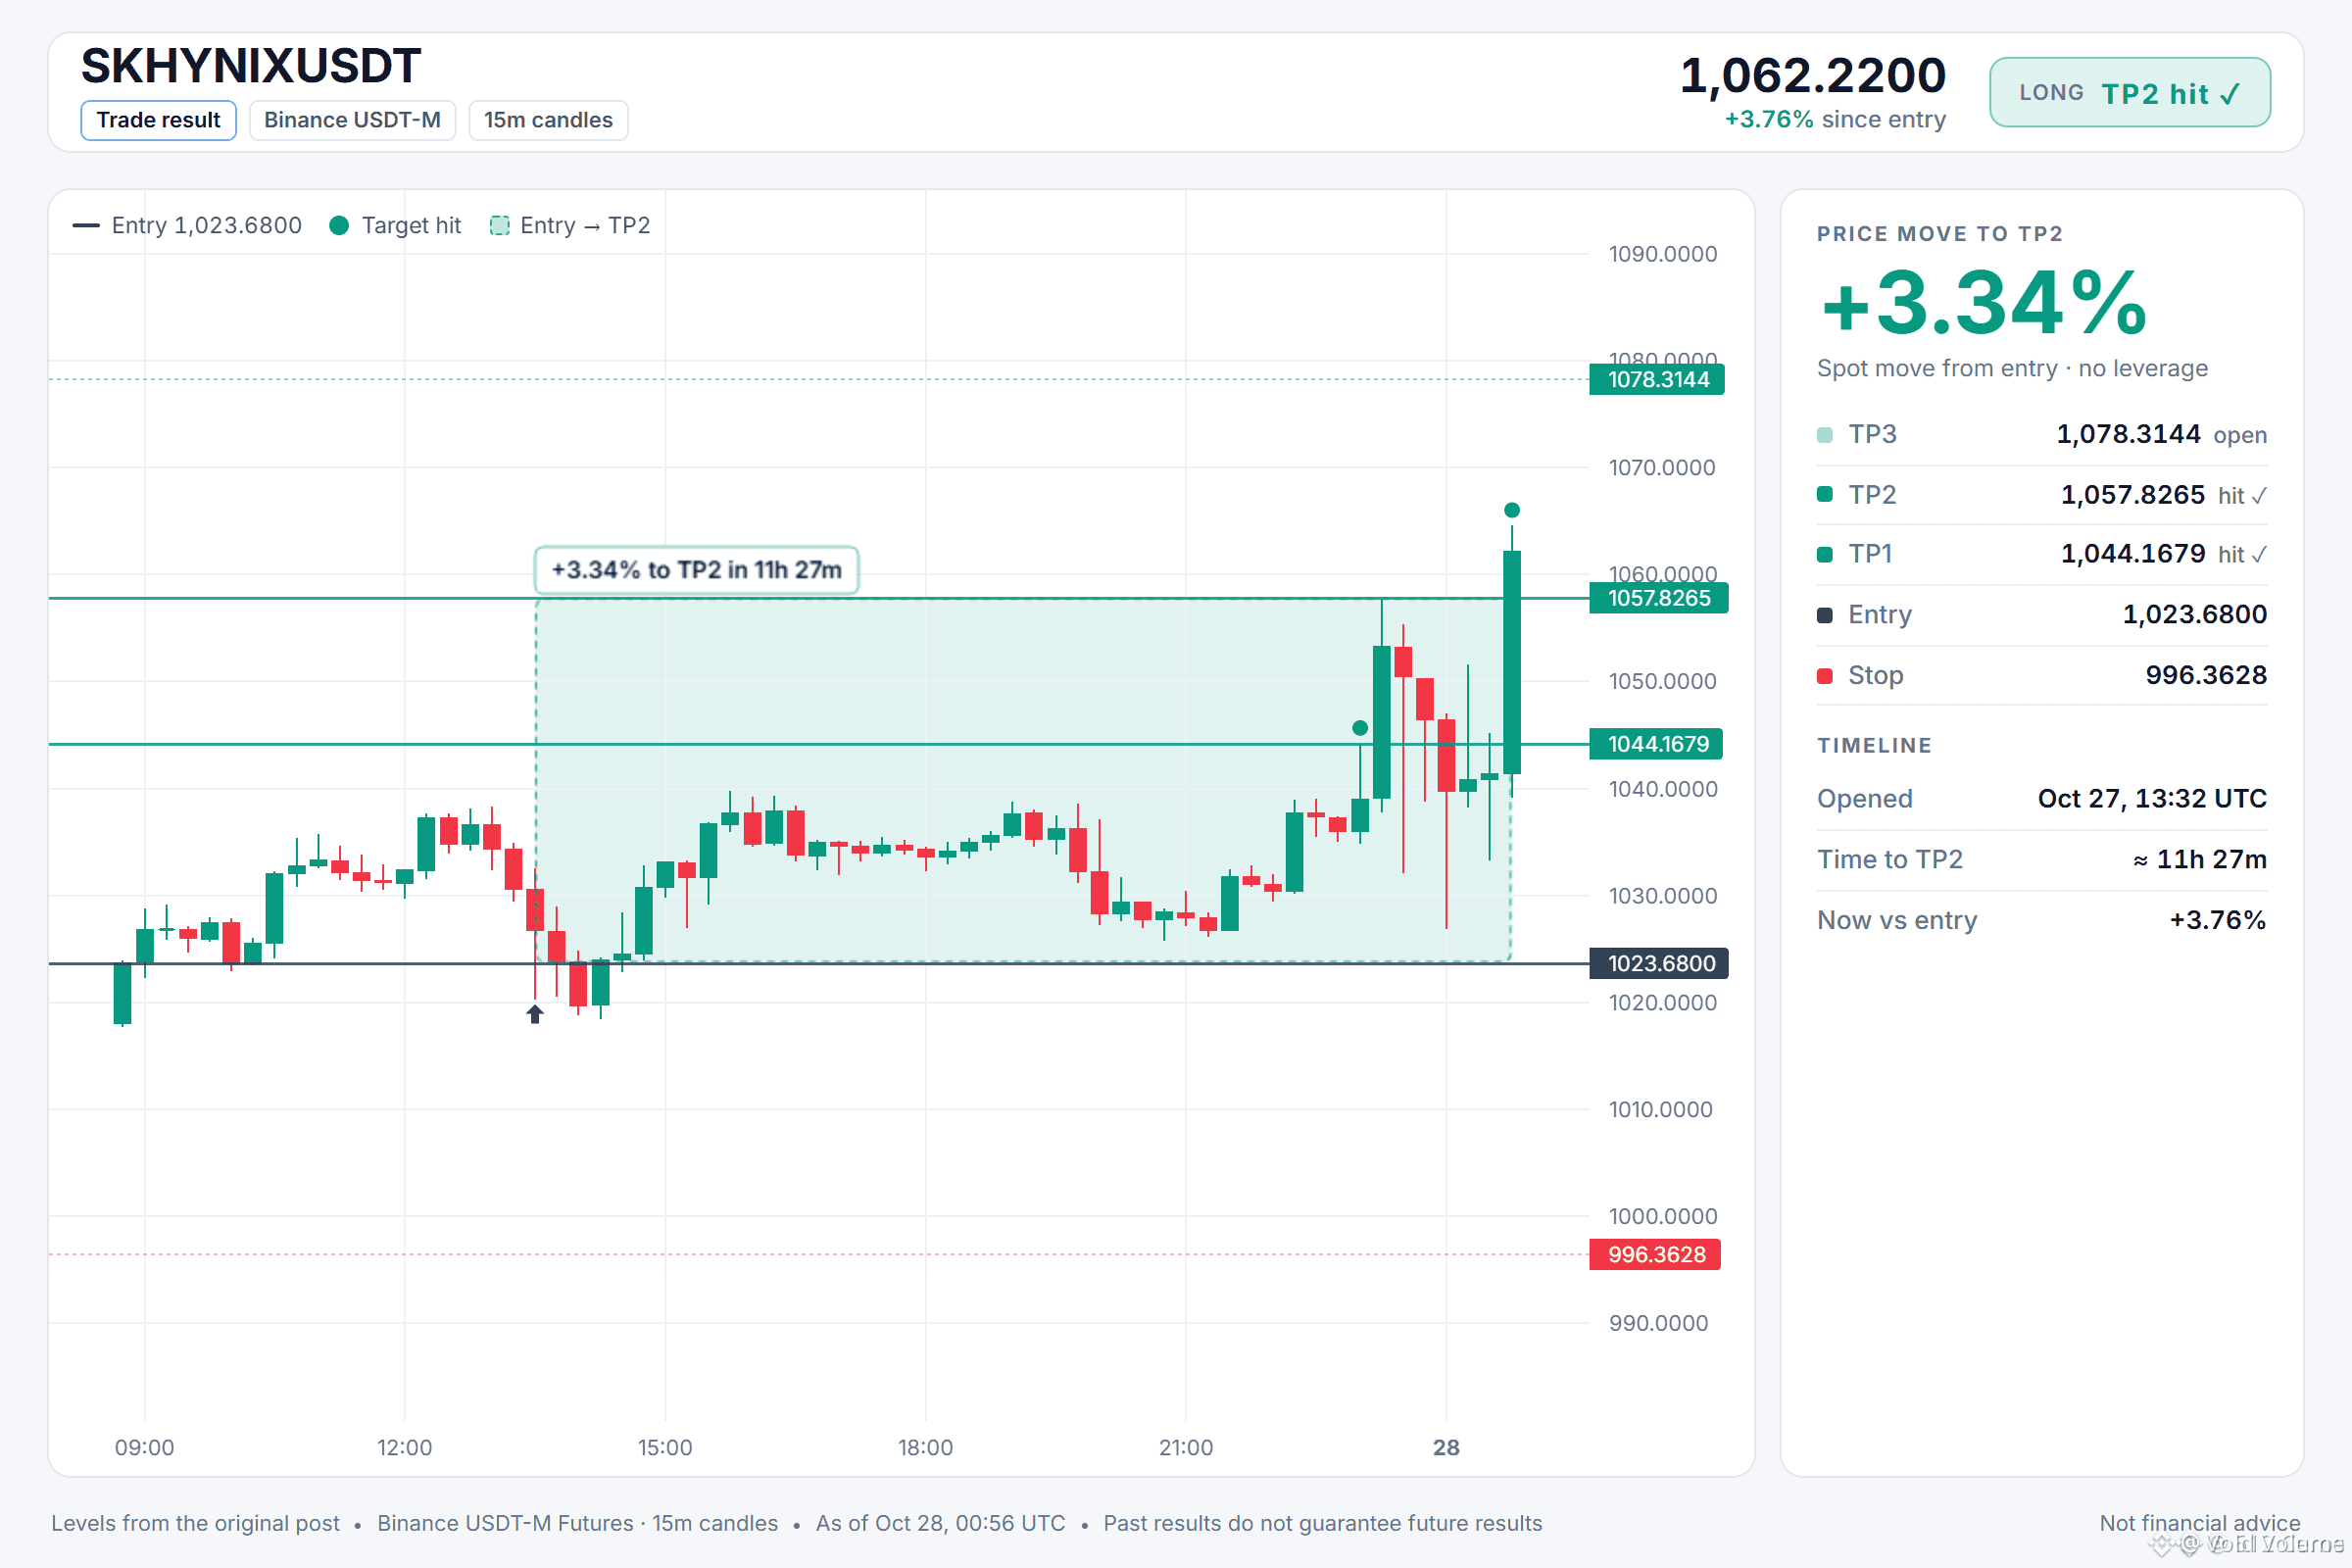
🚀 $BTC LONG SETUP CRUSHES TP2 WITH 3.34% SURGE! 📈
📊 The order block that anchored entry held firm, swallowing liquidity on the 4H as smart money re‑asserted dominance. 🦈 Volume surged in tandem, confirming the institutional push that propelled price 3.34% higher within just 11h 27m. 💡 A clean swing to TP2 underscores the potency of disciplined sizing and risk management.
💬 How are you calibrating your next entry to capture similar institutional sweeps? 👇
⚠️ Not financial advice. Always manage your risk. 🛡️
🏷️ #BTC #LongSetup #TP2 #Crypto
🔥 💎
4

·
--
SECOND TARGET SMASHED ON $BTC SHORT AS BEARISH LIQUIDITY SWEEP EXECUTES! 🔻 📉
That short execution played out cleanly as downside order flow sliced straight through fragile support. 🔻 Aggressive sell-side volume dominated the tape, pushing price right into our secondary target zone.
Locking in gains while the market rebalances is how capital is protected in these rapid moves. 📊 The downside momentum did the heavy lifting while institutional liquidity sweeps cleared the board.
With price now probing fresh demand, the market is setting up its next directional bias. 💬 Are you locking in profits here or expecting another leg lower into support? 👇
⚠️ Not financial advice. Always manage your risk. 🛡️
🏷️ #BTC #ShortSetup #ProfitSecured #Crypto
🎯 🐻
3
·
--
🚨 THE 2016 TO 2026 $BTC MACRO FRACTAL IS PLAYING OUT WITH UNCANNY PRECISION! ⚡
📌 Zoom out on the decade chart and the structural blueprint becomes crystal clear. The expansion phase unfolding now mirrors the exact 2016 accumulation breakdown before institutional capital accelerated the parabolic run. 📊 Market mechanics shift across multi-year cycles, but human psychology and liquidity accumulation remain identical.
💡 Smart money is positioning for the final decade expansion wave while retail gets chopped up in local noise. 🔍 Are you tracking this decade-long structural expansion or focusing on daily candle noise? 👇
⚠️ Not financial advice. Always manage your risk. 🛡️
🏷️ #BTC #MacroCycle #Bitcoin #Crypto #TechnicalAnalysis
🔥 💎
8
Log in to explore more content
Join global crypto users on Binance Square
⚡️ Get latest and useful information about crypto.
💬 Trusted by the world’s largest crypto exchange.
👍 Discover real insights from verified creators.
Email / Phone number
Trending Topics
1
#CanMicrosoftDeliverOnAI
120,809 views
918 Discussing
2
#CanGoogleDefindItsCore
58,690 views
650 Discussing
3
#FOMCWatch
9.1M views
28,174 Discussing
4
#OSMOPlansToBurn100MTokensFromCommunityPool
139 views
17 Discussing
5
#EthereumDropsBelow$2300
12,107 views
163 Discussing
6
#BitcoinSlipsBelow$80KAgain
33,989 views
131 Discussing
7
#ThailandLaunchesWORPTStablecoinToQRPaymentApp
71,706 views
860 Discussing
8
#StrategySkipsBitcoinPurchasesSpends$205MOnSTRCBuybacks
13,314 views
99 Discussing
9
#BitmineAdds10452ETH
121,621 views
1,275 Discussing
10
#SouthKoreaConsidersEducationTaxOnCryptoExchanges
77,466 views
887 Discussing