
#60
60
3,925 views
55 Discussing
Hot
Latest

·
--
A 60% surge, but the most noteworthy detail is this—
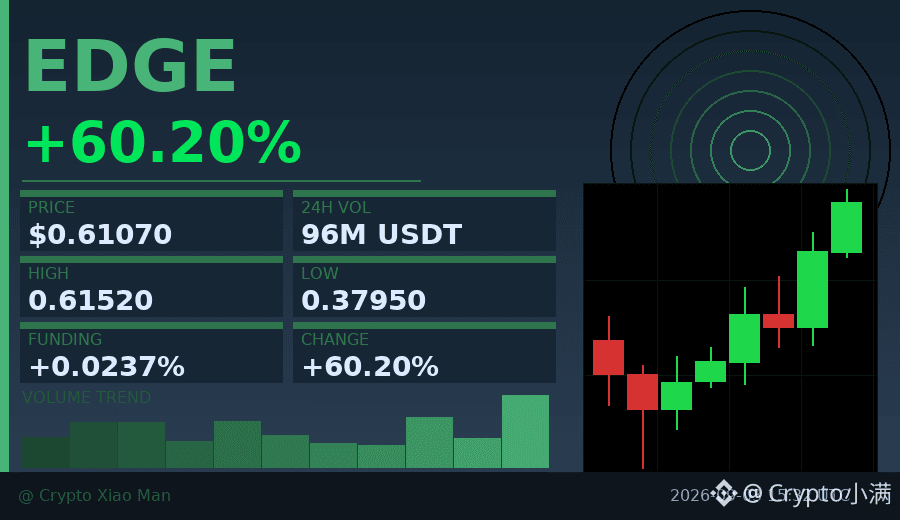
Today EDGE jumped from 0.38 all the way to 0.61, with volume surging to 96.50 million USDT. The key point is that the hourly chart has printed three consecutive bullish candles. Every pullback has buyers stepping in, which suggests this isn’t just a simple wick.
The funding rate of 0.0237% is still fairly mild. The long-to-short ratio is 57% vs 43%—longs are slightly ahead, but not crowded. The biggest fear with this kind of move is everyone charging in at once; the good news is there’s still room.
I just checked the recent posts—this coin hasn’t really been discussed yet. After breaking the 0.55 resistance, the next thing to watch is whether it can hold above the 0.60 psychological, round-number level.
$EDGE #强势突破 #60%涨幅
Click the small card below to quickly view the chart👇
A 60% surge, but the most noteworthy detail is this—
Today EDGE jumped from 0.38 all the way to 0.61, with volume surging to 96.50 million USDT. The key point is that the hourly chart has printed three consecutive bullish candles. Every pullback has buyers stepping in, which suggests this isn’t just a simple wick.
The funding rate of 0.0237% is still fairly mild. The long-to-short ratio is 57% vs 43%—longs are slightly ahead, but not crowded. The biggest fear with this kind of move is everyone charging in at once; the good news is there’s still room.
I just checked the recent posts—this coin hasn’t really been discussed yet. After breaking the 0.55 resistance, the next thing to watch is whether it can hold above the 0.60 psychological, round-number level.
$EDGE #强势突破 #60%涨幅
Click the small card below to quickly view the chart👇
Today EDGE jumped from 0.38 all the way to 0.61, with volume surging to 96.50 million USDT. The key point is that the hourly chart has printed three consecutive bullish candles. Every pullback has buyers stepping in, which suggests this isn’t just a simple wick.
The funding rate of 0.0237% is still fairly mild. The long-to-short ratio is 57% vs 43%—longs are slightly ahead, but not crowded. The biggest fear with this kind of move is everyone charging in at once; the good news is there’s still room.
I just checked the recent posts—this coin hasn’t really been discussed yet. After breaking the 0.55 resistance, the next thing to watch is whether it can hold above the 0.60 psychological, round-number level.
$EDGE #强势突破 #60%涨幅
Click the small card below to quickly view the chart👇
184

·
--
$ARB is down 23.61% on the week and 8.9% just today, sitting at $0.1533 while arbitrum spends that same stretch posting about tokenized UK government bonds.
here's what the team is claiming about itself: a "programmable economy" for businesses, with a compliance engine, configurable confidentiality, priority gas auctions, and faster settlement. that's arbitrum's own pitch, not a customer saying it works yet.
the concrete piece is xLiquida. their co-founder showed up at arbitrum's Open House in London working on tokenized UK Treasury bonds, and the team is also pointing at USDai and a programmable compute market it says is growing fast. this is founder-house early, but it's a real direction, not vaporware.
my read: the roadmap is aimed at institutions, but the discount is aimed at you. the token trades like those businesses never show up, and i don't buy that a chain doing this much groundwork sits at #60 forever.
follow me for more calls like this.
$ARB is down 23.61% on the week and 8.9% just today, sitting at $0.1533 while arbitrum spends that same stretch posting about tokenized UK government bonds.
here's what the team is claiming about itself: a "programmable economy" for businesses, with a compliance engine, configurable confidentiality, priority gas auctions, and faster settlement. that's arbitrum's own pitch, not a customer saying it works yet.
the concrete piece is xLiquida. their co-founder showed up at arbitrum's Open House in London working on tokenized UK Treasury bonds, and the team is also pointing at USDai and a programmable compute market it says is growing fast. this is founder-house early, but it's a real direction, not vaporware.
my read: the roadmap is aimed at institutions, but the discount is aimed at you. the token trades like those businesses never show up, and i don't buy that a chain doing this much groundwork sits at #60 forever.
follow me for more calls like this.
here's what the team is claiming about itself: a "programmable economy" for businesses, with a compliance engine, configurable confidentiality, priority gas auctions, and faster settlement. that's arbitrum's own pitch, not a customer saying it works yet.
the concrete piece is xLiquida. their co-founder showed up at arbitrum's Open House in London working on tokenized UK Treasury bonds, and the team is also pointing at USDai and a programmable compute market it says is growing fast. this is founder-house early, but it's a real direction, not vaporware.
my read: the roadmap is aimed at institutions, but the discount is aimed at you. the token trades like those businesses never show up, and i don't buy that a chain doing this much groundwork sits at #60 forever.
follow me for more calls like this.

75
·
--
33% gain, but the funding rate is only 0.0223%—what does that mean?
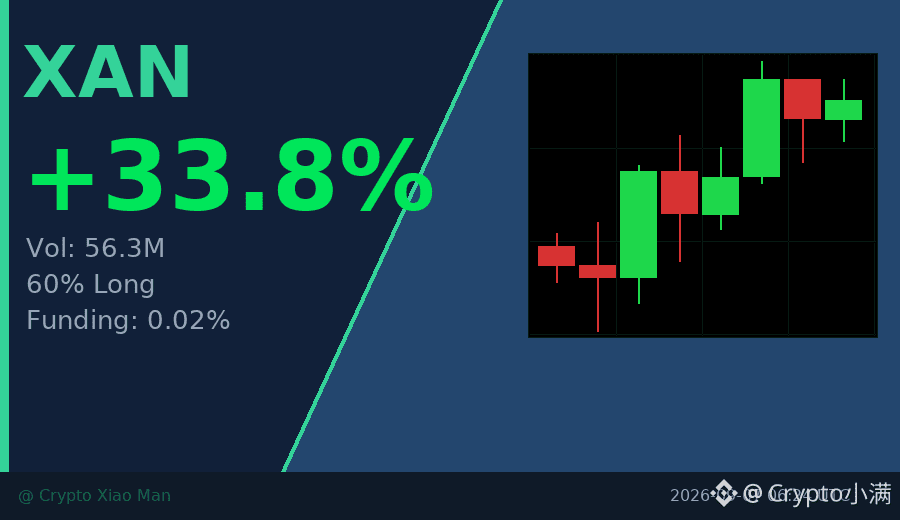
XAN traded $56M in volume today, with price moving from 0.0159 to 0.0219.
It was broadly stronger over the past 8 hours, but the long/short ratio of 60/40 is not extremely crowded.
The key is the last candlestick: after spiking to 0.02198, it pulled back,
while volume kept increasing but price started to move sideways—classic profit-taking digestion.
If it can hold above 0.0207 in the next 1-2 hours,
bulls may still get one more attempt at the previous high; if it breaks below,
short-term price may need to retest the 0.0195-0.0200 range for support.
$XAN #资金费率偏低 #60% bulls
Click the card below to quickly check the market👇
33% gain, but the funding rate is only 0.0223%—what does that mean?
XAN traded $56M in volume today, with price moving from 0.0159 to 0.0219.
It was broadly stronger over the past 8 hours, but the long/short ratio of 60/40 is not extremely crowded.
The key is the last candlestick: after spiking to 0.02198, it pulled back,
while volume kept increasing but price started to move sideways—classic profit-taking digestion.
If it can hold above 0.0207 in the next 1-2 hours,
bulls may still get one more attempt at the previous high; if it breaks below,
short-term price may need to retest the 0.0195-0.0200 range for support.
$XAN #资金费率偏低 #60% bulls
Click the card below to quickly check the market👇
XAN traded $56M in volume today, with price moving from 0.0159 to 0.0219.
It was broadly stronger over the past 8 hours, but the long/short ratio of 60/40 is not extremely crowded.
The key is the last candlestick: after spiking to 0.02198, it pulled back,
while volume kept increasing but price started to move sideways—classic profit-taking digestion.
If it can hold above 0.0207 in the next 1-2 hours,
bulls may still get one more attempt at the previous high; if it breaks below,
short-term price may need to retest the 0.0195-0.0200 range for support.
$XAN #资金费率偏低 #60% bulls
Click the card below to quickly check the market👇
17
·
--
Behind the 60% surge, there’s an unusual signal: the funding rate is actually negative.
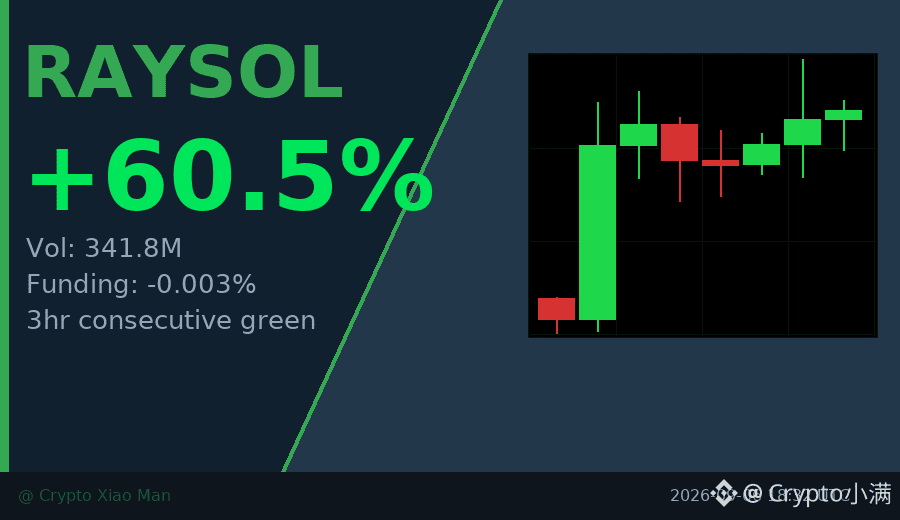
RAYSOL hit 1.38 today, with trading volume reaching $340 million, but a rate of -0.003% means shorts are still paying longs. Usually, such a sharp rally is driven by leveraged longs piling in, which would make the funding rate insanely positive—but this time is different.
The hourly chart has closed green candles in a row, and the buying pressure is coming from real spot capital, not pure leveraged speculation. The long/short ratio is 49/51, almost perfectly balanced, showing that no one is blindly chasing the top; if anything, that’s a healthy sign.
This kind of divergence often means the trend is more stable—the price is rising hard, but leverage isn’t overheated, so the room for a pullback is relatively limited.
$RAYSOL #资金费率背离 #60%
Tap the small card below to quickly check the market👇
Behind the 60% surge, there’s an unusual signal: the funding rate is actually negative.
RAYSOL hit 1.38 today, with trading volume reaching $340 million, but a rate of -0.003% means shorts are still paying longs. Usually, such a sharp rally is driven by leveraged longs piling in, which would make the funding rate insanely positive—but this time is different.
The hourly chart has closed green candles in a row, and the buying pressure is coming from real spot capital, not pure leveraged speculation. The long/short ratio is 49/51, almost perfectly balanced, showing that no one is blindly chasing the top; if anything, that’s a healthy sign.
This kind of divergence often means the trend is more stable—the price is rising hard, but leverage isn’t overheated, so the room for a pullback is relatively limited.
$RAYSOL #资金费率背离 #60%
Tap the small card below to quickly check the market👇
RAYSOL hit 1.38 today, with trading volume reaching $340 million, but a rate of -0.003% means shorts are still paying longs. Usually, such a sharp rally is driven by leveraged longs piling in, which would make the funding rate insanely positive—but this time is different.
The hourly chart has closed green candles in a row, and the buying pressure is coming from real spot capital, not pure leveraged speculation. The long/short ratio is 49/51, almost perfectly balanced, showing that no one is blindly chasing the top; if anything, that’s a healthy sign.
This kind of divergence often means the trend is more stable—the price is rising hard, but leverage isn’t overheated, so the room for a pullback is relatively limited.
$RAYSOL #资金费率背离 #60%
Tap the small card below to quickly check the market👇
19
·
--
60% increase, but the funding rate is negative—what does that mean?
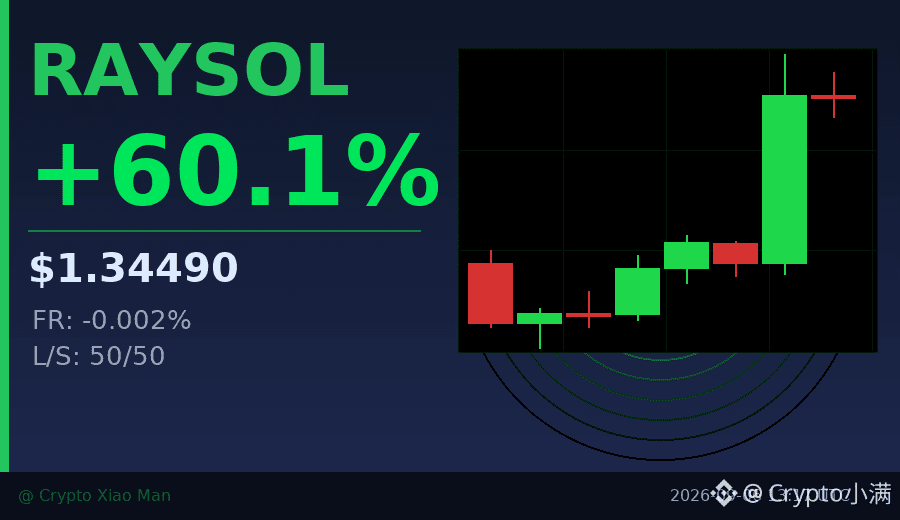
RAYSOL went from 0.83 to 1.39 today, with a trading volume of 180 million USDT.
Looks strong, right? But take a closer look: funding rate -0.00247%, long/short ratio 50/50.
Big players are using the rebound to distribute, while retail traders are chasing.
The overall trend strengthened within 8 hours, but the last candlestick started to see declining volume.
I’ve seen this kind of divergence too many times—
there may still be some short-term momentum, but don’t chase it; wait for a pullback.
$RAYSOL #资金费率背离 #60%
Click the small card below to quickly view the market👇
60% increase, but the funding rate is negative—what does that mean?
RAYSOL went from 0.83 to 1.39 today, with a trading volume of 180 million USDT.
Looks strong, right? But take a closer look: funding rate -0.00247%, long/short ratio 50/50.
Big players are using the rebound to distribute, while retail traders are chasing.
The overall trend strengthened within 8 hours, but the last candlestick started to see declining volume.
I’ve seen this kind of divergence too many times—
there may still be some short-term momentum, but don’t chase it; wait for a pullback.
$RAYSOL #资金费率背离 #60%
Click the small card below to quickly view the market👇
RAYSOL went from 0.83 to 1.39 today, with a trading volume of 180 million USDT.
Looks strong, right? But take a closer look: funding rate -0.00247%, long/short ratio 50/50.
Big players are using the rebound to distribute, while retail traders are chasing.
The overall trend strengthened within 8 hours, but the last candlestick started to see declining volume.
I’ve seen this kind of divergence too many times—
there may still be some short-term momentum, but don’t chase it; wait for a pullback.
$RAYSOL #资金费率背离 #60%
Click the small card below to quickly view the market👇
114
·
--
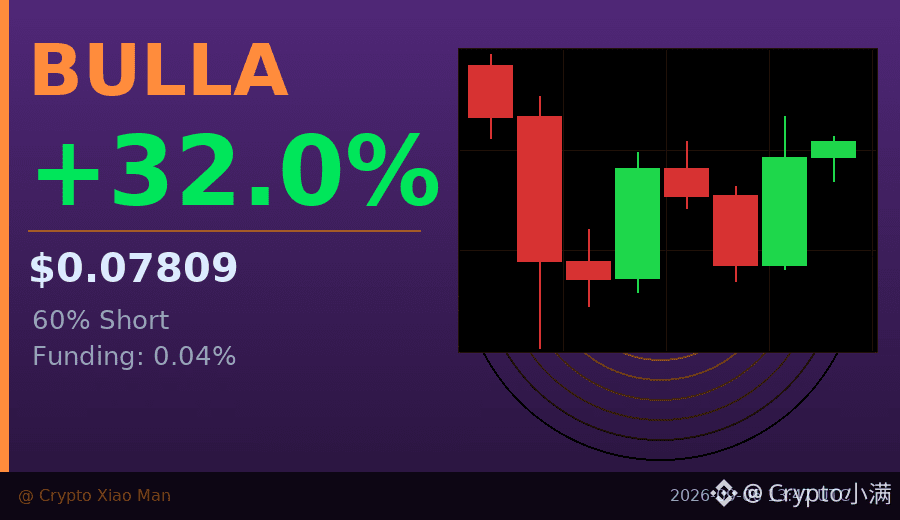
32% gains, but 60% of positions are still short — this is a classic short squeeze setup.
BULLA has posted three consecutive hourly green candles, rallying from 0.058 to 0.078, with trading volume of 456 million U.
The funding rate of 0.04% is not extreme, which means leverage hasn’t gone wild yet.
The key is the long/short ratio: 40% long vs 60% short. As the price moves up, the shorts still haven’t closed.
If it keeps breaking above 0.08, these shorts will be forced to stop out, accelerating the rally.
But if it falls back below 0.07, long-side profit taking could come quickly as well.
$BULLA #轧空预警 #60% short
Click the card below to quickly check the market👇
32% gains, but 60% of positions are still short — this is a classic short squeeze setup.
BULLA has posted three consecutive hourly green candles, rallying from 0.058 to 0.078, with trading volume of 456 million U.
The funding rate of 0.04% is not extreme, which means leverage hasn’t gone wild yet.
The key is the long/short ratio: 40% long vs 60% short. As the price moves up, the shorts still haven’t closed.
If it keeps breaking above 0.08, these shorts will be forced to stop out, accelerating the rally.
But if it falls back below 0.07, long-side profit taking could come quickly as well.
$BULLA #轧空预警 #60% short
Click the card below to quickly check the market👇
BULLA has posted three consecutive hourly green candles, rallying from 0.058 to 0.078, with trading volume of 456 million U.
The funding rate of 0.04% is not extreme, which means leverage hasn’t gone wild yet.
The key is the long/short ratio: 40% long vs 60% short. As the price moves up, the shorts still haven’t closed.
If it keeps breaking above 0.08, these shorts will be forced to stop out, accelerating the rally.
But if it falls back below 0.07, long-side profit taking could come quickly as well.
$BULLA #轧空预警 #60% short
Click the card below to quickly check the market👇
35
·
--
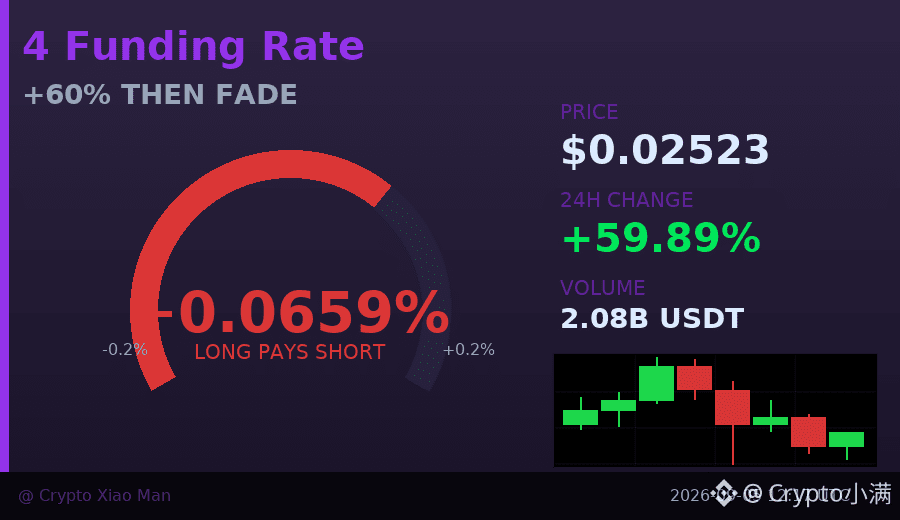
Behind the 60% rise, buying momentum is starting to run out of breath.
$4 climbed to 2.87 cents today before pulling back, and is now sitting at 2.52 cents. Trading volume piled up to $208 million, but over the past 8 hours the price has been weakening the whole way — a classic sign of a rally losing steam.
The funding rate is 0.066%, so longs are still paying shorts, but the long/short ratio of 54/46 is not extremely crowded. In times like this, chasing the move higher carries notable risk; waiting for it to stabilize is the safer play.
$4 #Meme异动 #60% gain
Click the small card below to quickly check the market👇
Behind the 60% rise, buying momentum is starting to run out of breath.
$4 climbed to 2.87 cents today before pulling back, and is now sitting at 2.52 cents. Trading volume piled up to $208 million, but over the past 8 hours the price has been weakening the whole way — a classic sign of a rally losing steam.
The funding rate is 0.066%, so longs are still paying shorts, but the long/short ratio of 54/46 is not extremely crowded. In times like this, chasing the move higher carries notable risk; waiting for it to stabilize is the safer play.
$4 #Meme异动 #60% gain
Click the small card below to quickly check the market👇
$4 climbed to 2.87 cents today before pulling back, and is now sitting at 2.52 cents. Trading volume piled up to $208 million, but over the past 8 hours the price has been weakening the whole way — a classic sign of a rally losing steam.
The funding rate is 0.066%, so longs are still paying shorts, but the long/short ratio of 54/46 is not extremely crowded. In times like this, chasing the move higher carries notable risk; waiting for it to stabilize is the safer play.
$4 #Meme异动 #60% gain
Click the small card below to quickly check the market👇
42
·
--
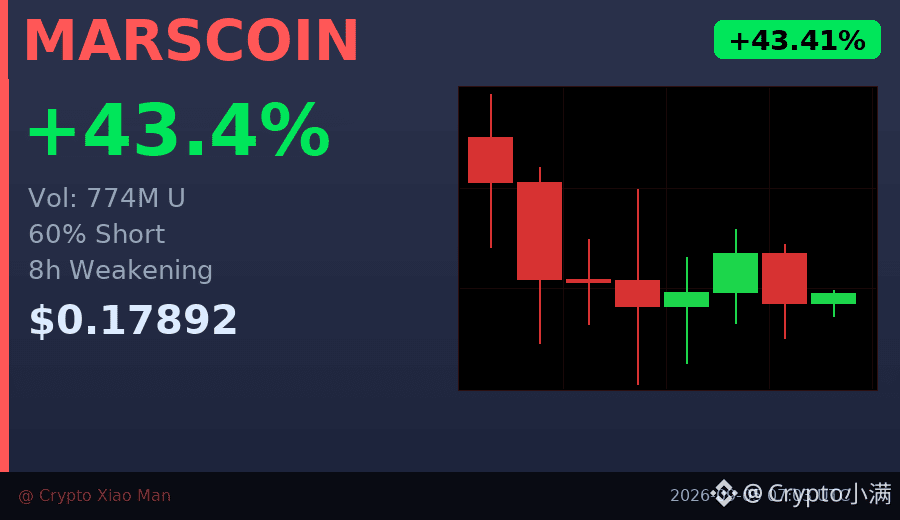
Behind the 43% surge, the bears actually had the upper hand.
MARSCOIN surged to around $0.18 today, with trading volume hitting 774 million U, but position data shows that 60% are short positions. What does this mean? Many people are shorting into the rally, thinking this move won’t go far.
The 8-hour chart does show some gradual weakening, with a pullback from the high. The bulls pushed hard for a while, and now they seem a bit out of breath. If the price keeps moving sideways, those short positions could get squeezed; but if it keeps pulling back, the bears will have called it right.
In situations like this, I usually wait until the direction is clearer before making a move.
$MARSCOIN #多空分歧 #60% short positions
Tap the card below to quickly check the market👇
Behind the 43% surge, the bears actually had the upper hand.
MARSCOIN surged to around $0.18 today, with trading volume hitting 774 million U, but position data shows that 60% are short positions. What does this mean? Many people are shorting into the rally, thinking this move won’t go far.
The 8-hour chart does show some gradual weakening, with a pullback from the high. The bulls pushed hard for a while, and now they seem a bit out of breath. If the price keeps moving sideways, those short positions could get squeezed; but if it keeps pulling back, the bears will have called it right.
In situations like this, I usually wait until the direction is clearer before making a move.
$MARSCOIN #多空分歧 #60% short positions
Tap the card below to quickly check the market👇
MARSCOIN surged to around $0.18 today, with trading volume hitting 774 million U, but position data shows that 60% are short positions. What does this mean? Many people are shorting into the rally, thinking this move won’t go far.
The 8-hour chart does show some gradual weakening, with a pullback from the high. The bulls pushed hard for a while, and now they seem a bit out of breath. If the price keeps moving sideways, those short positions could get squeezed; but if it keeps pulling back, the bears will have called it right.
In situations like this, I usually wait until the direction is clearer before making a move.
$MARSCOIN #多空分歧 #60% short positions
Tap the card below to quickly check the market👇
66
·
--
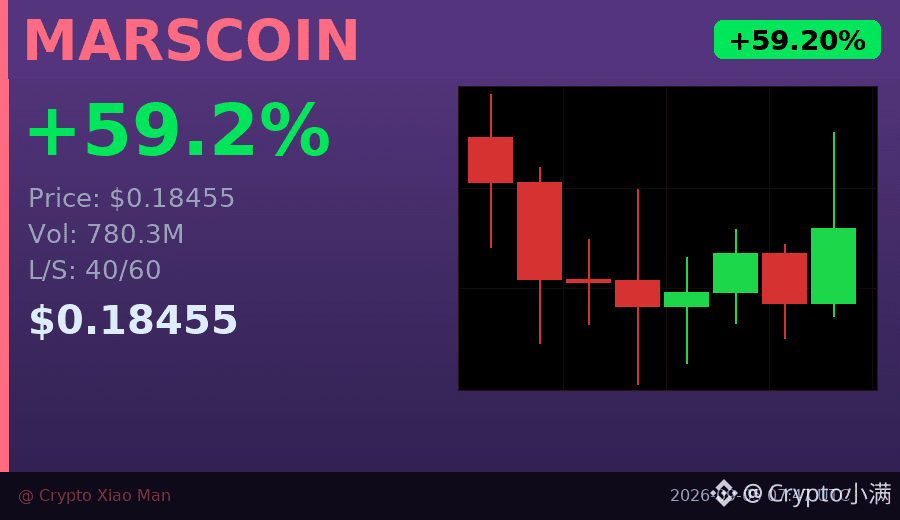
60% of people are still shorting, yet the coin price has risen 59%.
MARSCOIN reached 0.18455 today, with trading volume surging to $780 million. The funding rate of 0.05278% is not too extreme, but the long/short ratio shows that 60% of positions are short — which means a large number of bears are now caught off guard.
The latest candlestick showed a clear spike in volume, and price has been fluctuating in the 0.17-0.19 range. If it keeps moving higher, forced short covering could accelerate the rally; if it turns downward, those short positions may instead become support.
I'm watching the 0.194 level closely. If it breaks through, there may be another short-term leg up.
$MARSCOIN #逼空行情 #60% short positions
Click the card below to quickly check the market👇
60% of people are still shorting, yet the coin price has risen 59%.
MARSCOIN reached 0.18455 today, with trading volume surging to $780 million. The funding rate of 0.05278% is not too extreme, but the long/short ratio shows that 60% of positions are short — which means a large number of bears are now caught off guard.
The latest candlestick showed a clear spike in volume, and price has been fluctuating in the 0.17-0.19 range. If it keeps moving higher, forced short covering could accelerate the rally; if it turns downward, those short positions may instead become support.
I'm watching the 0.194 level closely. If it breaks through, there may be another short-term leg up.
$MARSCOIN #逼空行情 #60% short positions
Click the card below to quickly check the market👇
MARSCOIN reached 0.18455 today, with trading volume surging to $780 million. The funding rate of 0.05278% is not too extreme, but the long/short ratio shows that 60% of positions are short — which means a large number of bears are now caught off guard.
The latest candlestick showed a clear spike in volume, and price has been fluctuating in the 0.17-0.19 range. If it keeps moving higher, forced short covering could accelerate the rally; if it turns downward, those short positions may instead become support.
I'm watching the 0.194 level closely. If it breaks through, there may be another short-term leg up.
$MARSCOIN #逼空行情 #60% short positions
Click the card below to quickly check the market👇
27
·
--
A 68% gain, but 60% of positions are still short?
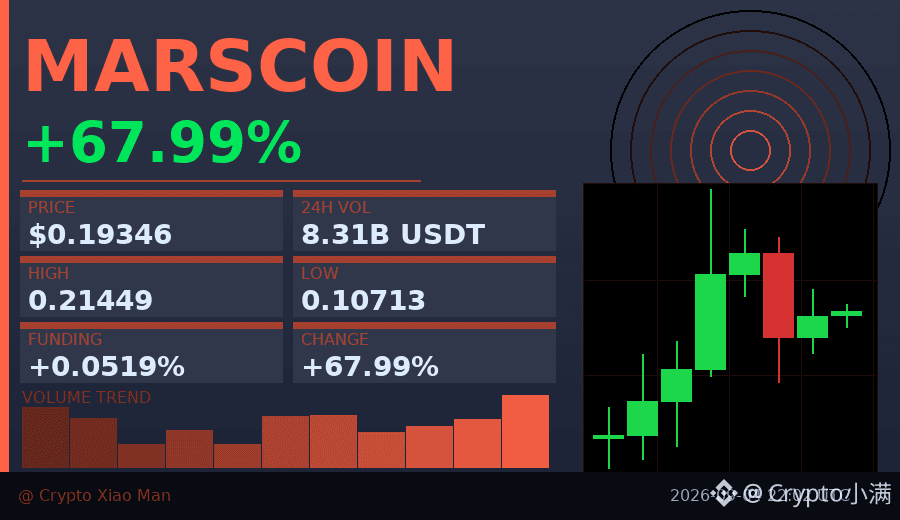
MARSCOIN rose to 0.193 today, with trading volume surging to $830 million. More interestingly, although the price has closed higher for three straight hourly candles, the long/short ratio shows that 60% of traders are still short.
This situation usually means two things: either the bears are waiting for a pullback to add to their positions, or they haven’t realized the trend has already changed. From the low of 0.107 to now, a group of traders has already missed the move. If it continues to break above the previous high of 0.21, it may force shorts to cover.
What I’m watching is whether trading volume can hold at this level. If the pullback comes on lower volume, it could mean the bulls are waiting for a better entry opportunity.
$MARSCOIN #空头挤压 #60% short
Click the small card below to quickly view the market👇
A 68% gain, but 60% of positions are still short?
MARSCOIN rose to 0.193 today, with trading volume surging to $830 million. More interestingly, although the price has closed higher for three straight hourly candles, the long/short ratio shows that 60% of traders are still short.
This situation usually means two things: either the bears are waiting for a pullback to add to their positions, or they haven’t realized the trend has already changed. From the low of 0.107 to now, a group of traders has already missed the move. If it continues to break above the previous high of 0.21, it may force shorts to cover.
What I’m watching is whether trading volume can hold at this level. If the pullback comes on lower volume, it could mean the bulls are waiting for a better entry opportunity.
$MARSCOIN #空头挤压 #60% short
Click the small card below to quickly view the market👇
MARSCOIN rose to 0.193 today, with trading volume surging to $830 million. More interestingly, although the price has closed higher for three straight hourly candles, the long/short ratio shows that 60% of traders are still short.
This situation usually means two things: either the bears are waiting for a pullback to add to their positions, or they haven’t realized the trend has already changed. From the low of 0.107 to now, a group of traders has already missed the move. If it continues to break above the previous high of 0.21, it may force shorts to cover.
What I’m watching is whether trading volume can hold at this level. If the pullback comes on lower volume, it could mean the bulls are waiting for a better entry opportunity.
$MARSCOIN #空头挤压 #60% short
Click the small card below to quickly view the market👇
36
·
--
Behind the 42% surge, 60% of people are still betting on it falling.
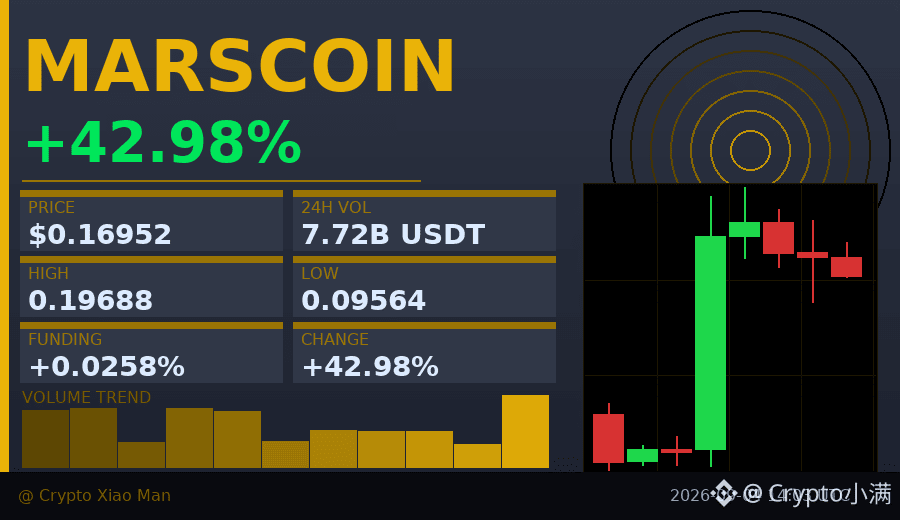
MARSCOIN’s trading volume surged to $772 million today, with the price climbing from 0.095 to 0.196 before pulling back to 0.169. Looks strong? But the funding rate is only 0.0258%, and the long/short ratio shows 60% of positions are short.
What does that mean? Most people think this rally is over and are lining up to short it. The hourly chart has already closed three consecutive bearish candles, and it’s down 14% from the high.
I’ve seen too many situations like this: the price is still at a high level, but smart money has already started positioning the other way. I’m not saying it can’t keep running, but the risk-reward ratio for chasing longs is getting worse and worse.
$MARSCOIN #多空分歧 #60% short positions
Click the card below to quickly view the market👇
Behind the 42% surge, 60% of people are still betting on it falling.
MARSCOIN’s trading volume surged to $772 million today, with the price climbing from 0.095 to 0.196 before pulling back to 0.169. Looks strong? But the funding rate is only 0.0258%, and the long/short ratio shows 60% of positions are short.
What does that mean? Most people think this rally is over and are lining up to short it. The hourly chart has already closed three consecutive bearish candles, and it’s down 14% from the high.
I’ve seen too many situations like this: the price is still at a high level, but smart money has already started positioning the other way. I’m not saying it can’t keep running, but the risk-reward ratio for chasing longs is getting worse and worse.
$MARSCOIN #多空分歧 #60% short positions
Click the card below to quickly view the market👇
MARSCOIN’s trading volume surged to $772 million today, with the price climbing from 0.095 to 0.196 before pulling back to 0.169. Looks strong? But the funding rate is only 0.0258%, and the long/short ratio shows 60% of positions are short.
What does that mean? Most people think this rally is over and are lining up to short it. The hourly chart has already closed three consecutive bearish candles, and it’s down 14% from the high.
I’ve seen too many situations like this: the price is still at a high level, but smart money has already started positioning the other way. I’m not saying it can’t keep running, but the risk-reward ratio for chasing longs is getting worse and worse.
$MARSCOIN #多空分歧 #60% short positions
Click the card below to quickly view the market👇
115
·
--
A 64% increase, but 60% of positions are still short — something feels off.
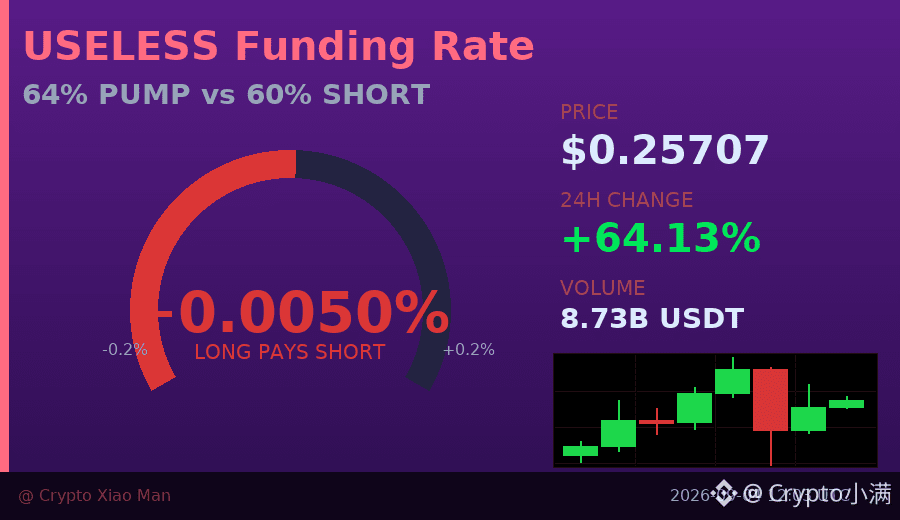
USELESS trading volume today surged to 873 million USDT, with the price moving from 0.15 up to 0.28 before pulling back to 0.257.
The hourly chart has already closed three consecutive green candles, indicating that buying pressure is continuing to enter.
But the long/short ratio shows that 60% of people are still holding short positions, while the funding rate is only 0.005%, meaning almost no one is paying.
This kind of divergence usually means two things: either shorts are waiting for a pullback to add positions,
or they still haven’t realized the trend has already changed.
I lean toward the latter — when most people are still bearish, the market often won’t reverse immediately.
$USELESS #空头陷阱 #60% short positions
Click the small card below to quickly view the market👇
A 64% increase, but 60% of positions are still short — something feels off.
USELESS trading volume today surged to 873 million USDT, with the price moving from 0.15 up to 0.28 before pulling back to 0.257.
The hourly chart has already closed three consecutive green candles, indicating that buying pressure is continuing to enter.
But the long/short ratio shows that 60% of people are still holding short positions, while the funding rate is only 0.005%, meaning almost no one is paying.
This kind of divergence usually means two things: either shorts are waiting for a pullback to add positions,
or they still haven’t realized the trend has already changed.
I lean toward the latter — when most people are still bearish, the market often won’t reverse immediately.
$USELESS #空头陷阱 #60% short positions
Click the small card below to quickly view the market👇
USELESS trading volume today surged to 873 million USDT, with the price moving from 0.15 up to 0.28 before pulling back to 0.257.
The hourly chart has already closed three consecutive green candles, indicating that buying pressure is continuing to enter.
But the long/short ratio shows that 60% of people are still holding short positions, while the funding rate is only 0.005%, meaning almost no one is paying.
This kind of divergence usually means two things: either shorts are waiting for a pullback to add positions,
or they still haven’t realized the trend has already changed.
I lean toward the latter — when most people are still bearish, the market often won’t reverse immediately.
$USELESS #空头陷阱 #60% short positions
Click the small card below to quickly view the market👇
18
·
--
58% increase, but 60% of positions are short — this divergence is interesting.
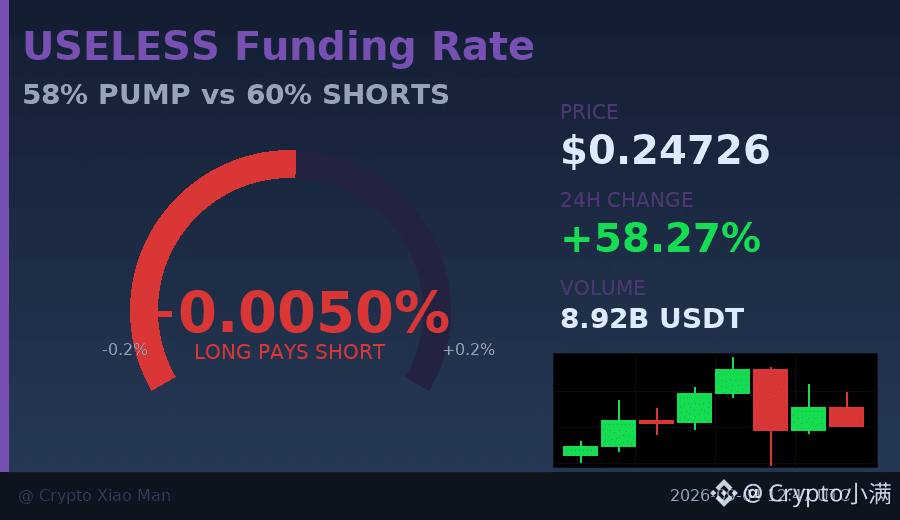
USELESS has surged from 0.15 to 0.2879 over the past 8 hours, with trading volume hitting $890 million.
Normally, in a move this strong, longs should be in control.
But the long/short ratio shows 60% short positions and only 40% long positions.
What does this mean? Either smart money is positioning for a pullback at higher levels,
or shorts still haven’t realized how strong this momentum is.
The price has now pulled back to 0.247, down 14% from the high.
If bulls can hold the 0.23-0.24 range,
those 60% shorts may be forced to cover, which could push the price higher.
$USELESS #多空分歧 #60% short positions
Click the card below to quickly check the market👇
58% increase, but 60% of positions are short — this divergence is interesting.
USELESS has surged from 0.15 to 0.2879 over the past 8 hours, with trading volume hitting $890 million.
Normally, in a move this strong, longs should be in control.
But the long/short ratio shows 60% short positions and only 40% long positions.
What does this mean? Either smart money is positioning for a pullback at higher levels,
or shorts still haven’t realized how strong this momentum is.
The price has now pulled back to 0.247, down 14% from the high.
If bulls can hold the 0.23-0.24 range,
those 60% shorts may be forced to cover, which could push the price higher.
$USELESS #多空分歧 #60% short positions
Click the card below to quickly check the market👇
USELESS has surged from 0.15 to 0.2879 over the past 8 hours, with trading volume hitting $890 million.
Normally, in a move this strong, longs should be in control.
But the long/short ratio shows 60% short positions and only 40% long positions.
What does this mean? Either smart money is positioning for a pullback at higher levels,
or shorts still haven’t realized how strong this momentum is.
The price has now pulled back to 0.247, down 14% from the high.
If bulls can hold the 0.23-0.24 range,
those 60% shorts may be forced to cover, which could push the price higher.
$USELESS #多空分歧 #60% short positions
Click the card below to quickly check the market👇
81
·
--
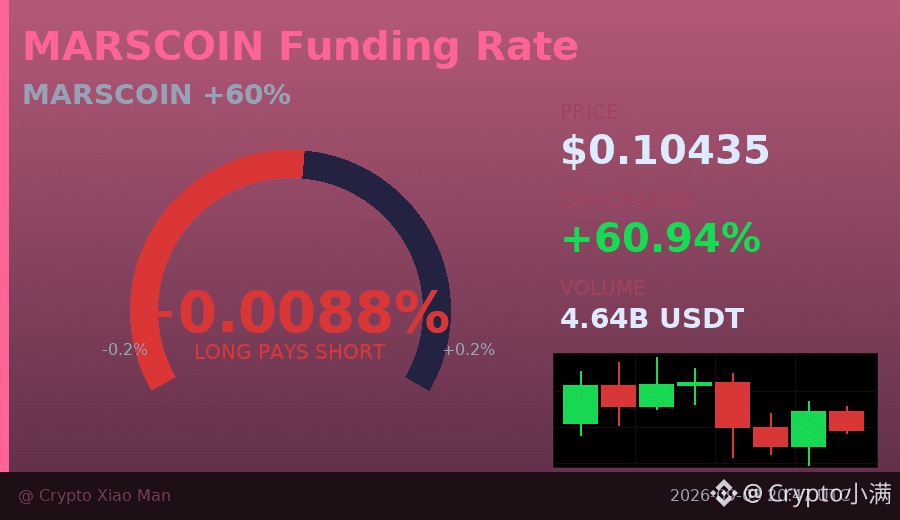
A 60% surge, but more than half the people are shorting—kind of interesting.
Today, MARSCOIN’s trading volume hit 464 million U. The price moved from 0.059 up to 0.123, and it has now pulled back to 0.104. On the surface it looks like a strong breakout, but the short position ratio is 56%, higher than the longs.
More importantly, over the past 8 hours the price has actually been weakening. This kind of “it’s pumping hard, but nobody believes it” situation is either the main players luring longs, or the final shakeout right before a real breakout.
I’ll wait until the direction is clear before I take action—chasing it now is too risky.
$MARSCOIN #多空分歧 #60%涨幅
Click the small card below to quickly check the market trend👇
A 60% surge, but more than half the people are shorting—kind of interesting.
Today, MARSCOIN’s trading volume hit 464 million U. The price moved from 0.059 up to 0.123, and it has now pulled back to 0.104. On the surface it looks like a strong breakout, but the short position ratio is 56%, higher than the longs.
More importantly, over the past 8 hours the price has actually been weakening. This kind of “it’s pumping hard, but nobody believes it” situation is either the main players luring longs, or the final shakeout right before a real breakout.
I’ll wait until the direction is clear before I take action—chasing it now is too risky.
$MARSCOIN #多空分歧 #60%涨幅
Click the small card below to quickly check the market trend👇
Today, MARSCOIN’s trading volume hit 464 million U. The price moved from 0.059 up to 0.123, and it has now pulled back to 0.104. On the surface it looks like a strong breakout, but the short position ratio is 56%, higher than the longs.
More importantly, over the past 8 hours the price has actually been weakening. This kind of “it’s pumping hard, but nobody believes it” situation is either the main players luring longs, or the final shakeout right before a real breakout.
I’ll wait until the direction is clear before I take action—chasing it now is too risky.
$MARSCOIN #多空分歧 #60%涨幅
Click the small card below to quickly check the market trend👇
95
·
--
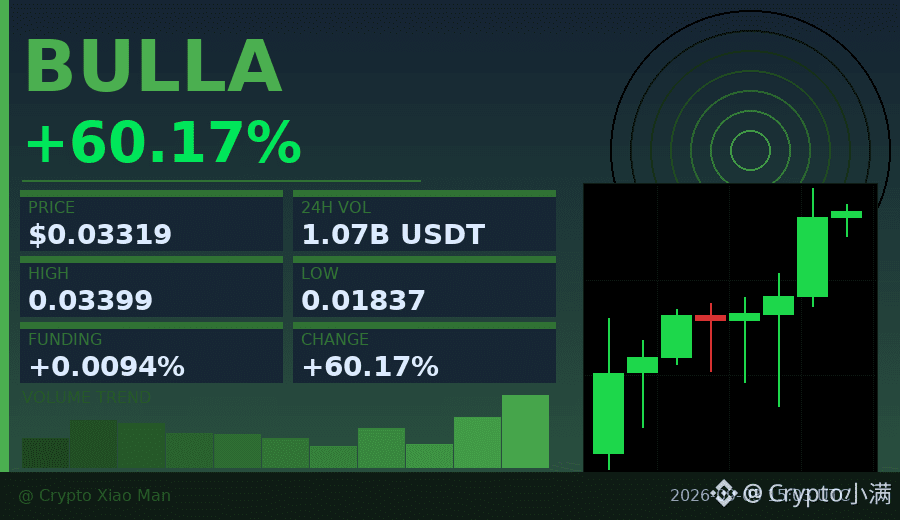
60% price increase, but the funding rate is only 0.009%—what does that mean?
When most people see BULLA rally, their first reaction is to chase longs,
but compared short-term and long-term signals, it’s 52% vs 48%, and almost nobody is extremely crowded.
Three consecutive hourly candles close green, and volume pushes to 107 million U. The price rises from 0.018 to 0.033, but the funding rate doesn’t keep up.
This kind of divergence usually indicates that the main players are quietly accumulating,
rather than a false breakout driven by FOMO from retail traders.
I’m watching the 0.030 level—if it holds, then we’ll look at 0.036.
$BULLA #低费率爆发 #60%
Click the small card below to quickly view the market行情👇
60% price increase, but the funding rate is only 0.009%—what does that mean?
When most people see BULLA rally, their first reaction is to chase longs,
but compared short-term and long-term signals, it’s 52% vs 48%, and almost nobody is extremely crowded.
Three consecutive hourly candles close green, and volume pushes to 107 million U. The price rises from 0.018 to 0.033, but the funding rate doesn’t keep up.
This kind of divergence usually indicates that the main players are quietly accumulating,
rather than a false breakout driven by FOMO from retail traders.
I’m watching the 0.030 level—if it holds, then we’ll look at 0.036.
$BULLA #低费率爆发 #60%
Click the small card below to quickly view the market行情👇
When most people see BULLA rally, their first reaction is to chase longs,
but compared short-term and long-term signals, it’s 52% vs 48%, and almost nobody is extremely crowded.
Three consecutive hourly candles close green, and volume pushes to 107 million U. The price rises from 0.018 to 0.033, but the funding rate doesn’t keep up.
This kind of divergence usually indicates that the main players are quietly accumulating,
rather than a false breakout driven by FOMO from retail traders.
I’m watching the 0.030 level—if it holds, then we’ll look at 0.036.
$BULLA #低费率爆发 #60%
Click the small card below to quickly view the market行情👇
19
·
--
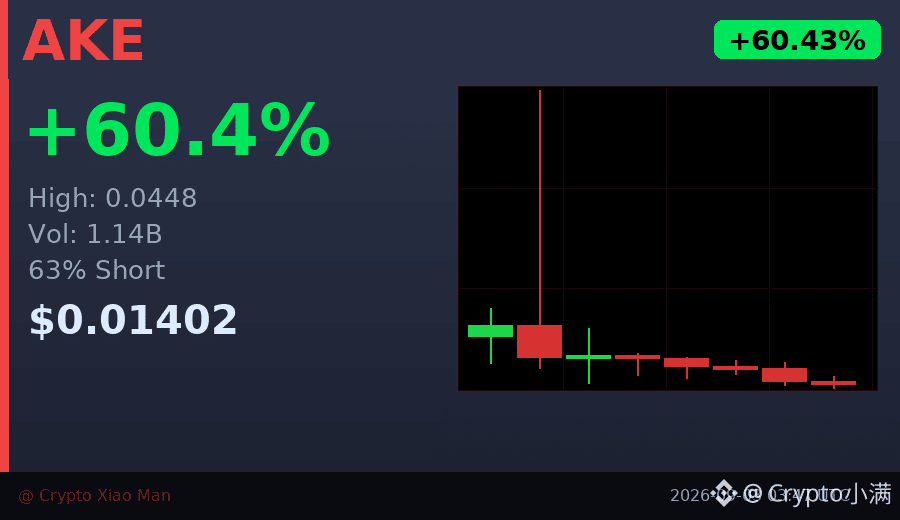
60% increase, but the hourly candlesticks have already been falling for three straight sessions—AKE is this just a shakeout, or a real pullback?
Price has dropped from a high of 0.0448 to around 0.014, yet the trading volume is still 1.14 billion USDT,
which suggests a major disagreement between bulls and bears. The funding rate is only 0.005%,
so it isn’t extremely extreme, but the long-vs-short ratio is 37% to 63%, with bears clearly in control.
A high-level pullback on heavy volume usually indicates that early profit-takers are exiting.
If it can’t quickly reclaim the 0.016–0.017 range next,
then in the short term it may continue to test support near 0.013.
$AKE #洗盘还是回调 #60%涨幅
Click the small card below to quickly check the行情👇
60% increase, but the hourly candlesticks have already been falling for three straight sessions—AKE is this just a shakeout, or a real pullback?
Price has dropped from a high of 0.0448 to around 0.014, yet the trading volume is still 1.14 billion USDT,
which suggests a major disagreement between bulls and bears. The funding rate is only 0.005%,
so it isn’t extremely extreme, but the long-vs-short ratio is 37% to 63%, with bears clearly in control.
A high-level pullback on heavy volume usually indicates that early profit-takers are exiting.
If it can’t quickly reclaim the 0.016–0.017 range next,
then in the short term it may continue to test support near 0.013.
$AKE #洗盘还是回调 #60%涨幅
Click the small card below to quickly check the行情👇
Price has dropped from a high of 0.0448 to around 0.014, yet the trading volume is still 1.14 billion USDT,
which suggests a major disagreement between bulls and bears. The funding rate is only 0.005%,
so it isn’t extremely extreme, but the long-vs-short ratio is 37% to 63%, with bears clearly in control.
A high-level pullback on heavy volume usually indicates that early profit-takers are exiting.
If it can’t quickly reclaim the 0.016–0.017 range next,
then in the short term it may continue to test support near 0.013.
$AKE #洗盘还是回调 #60%涨幅
Click the small card below to quickly check the行情👇
42

·
--
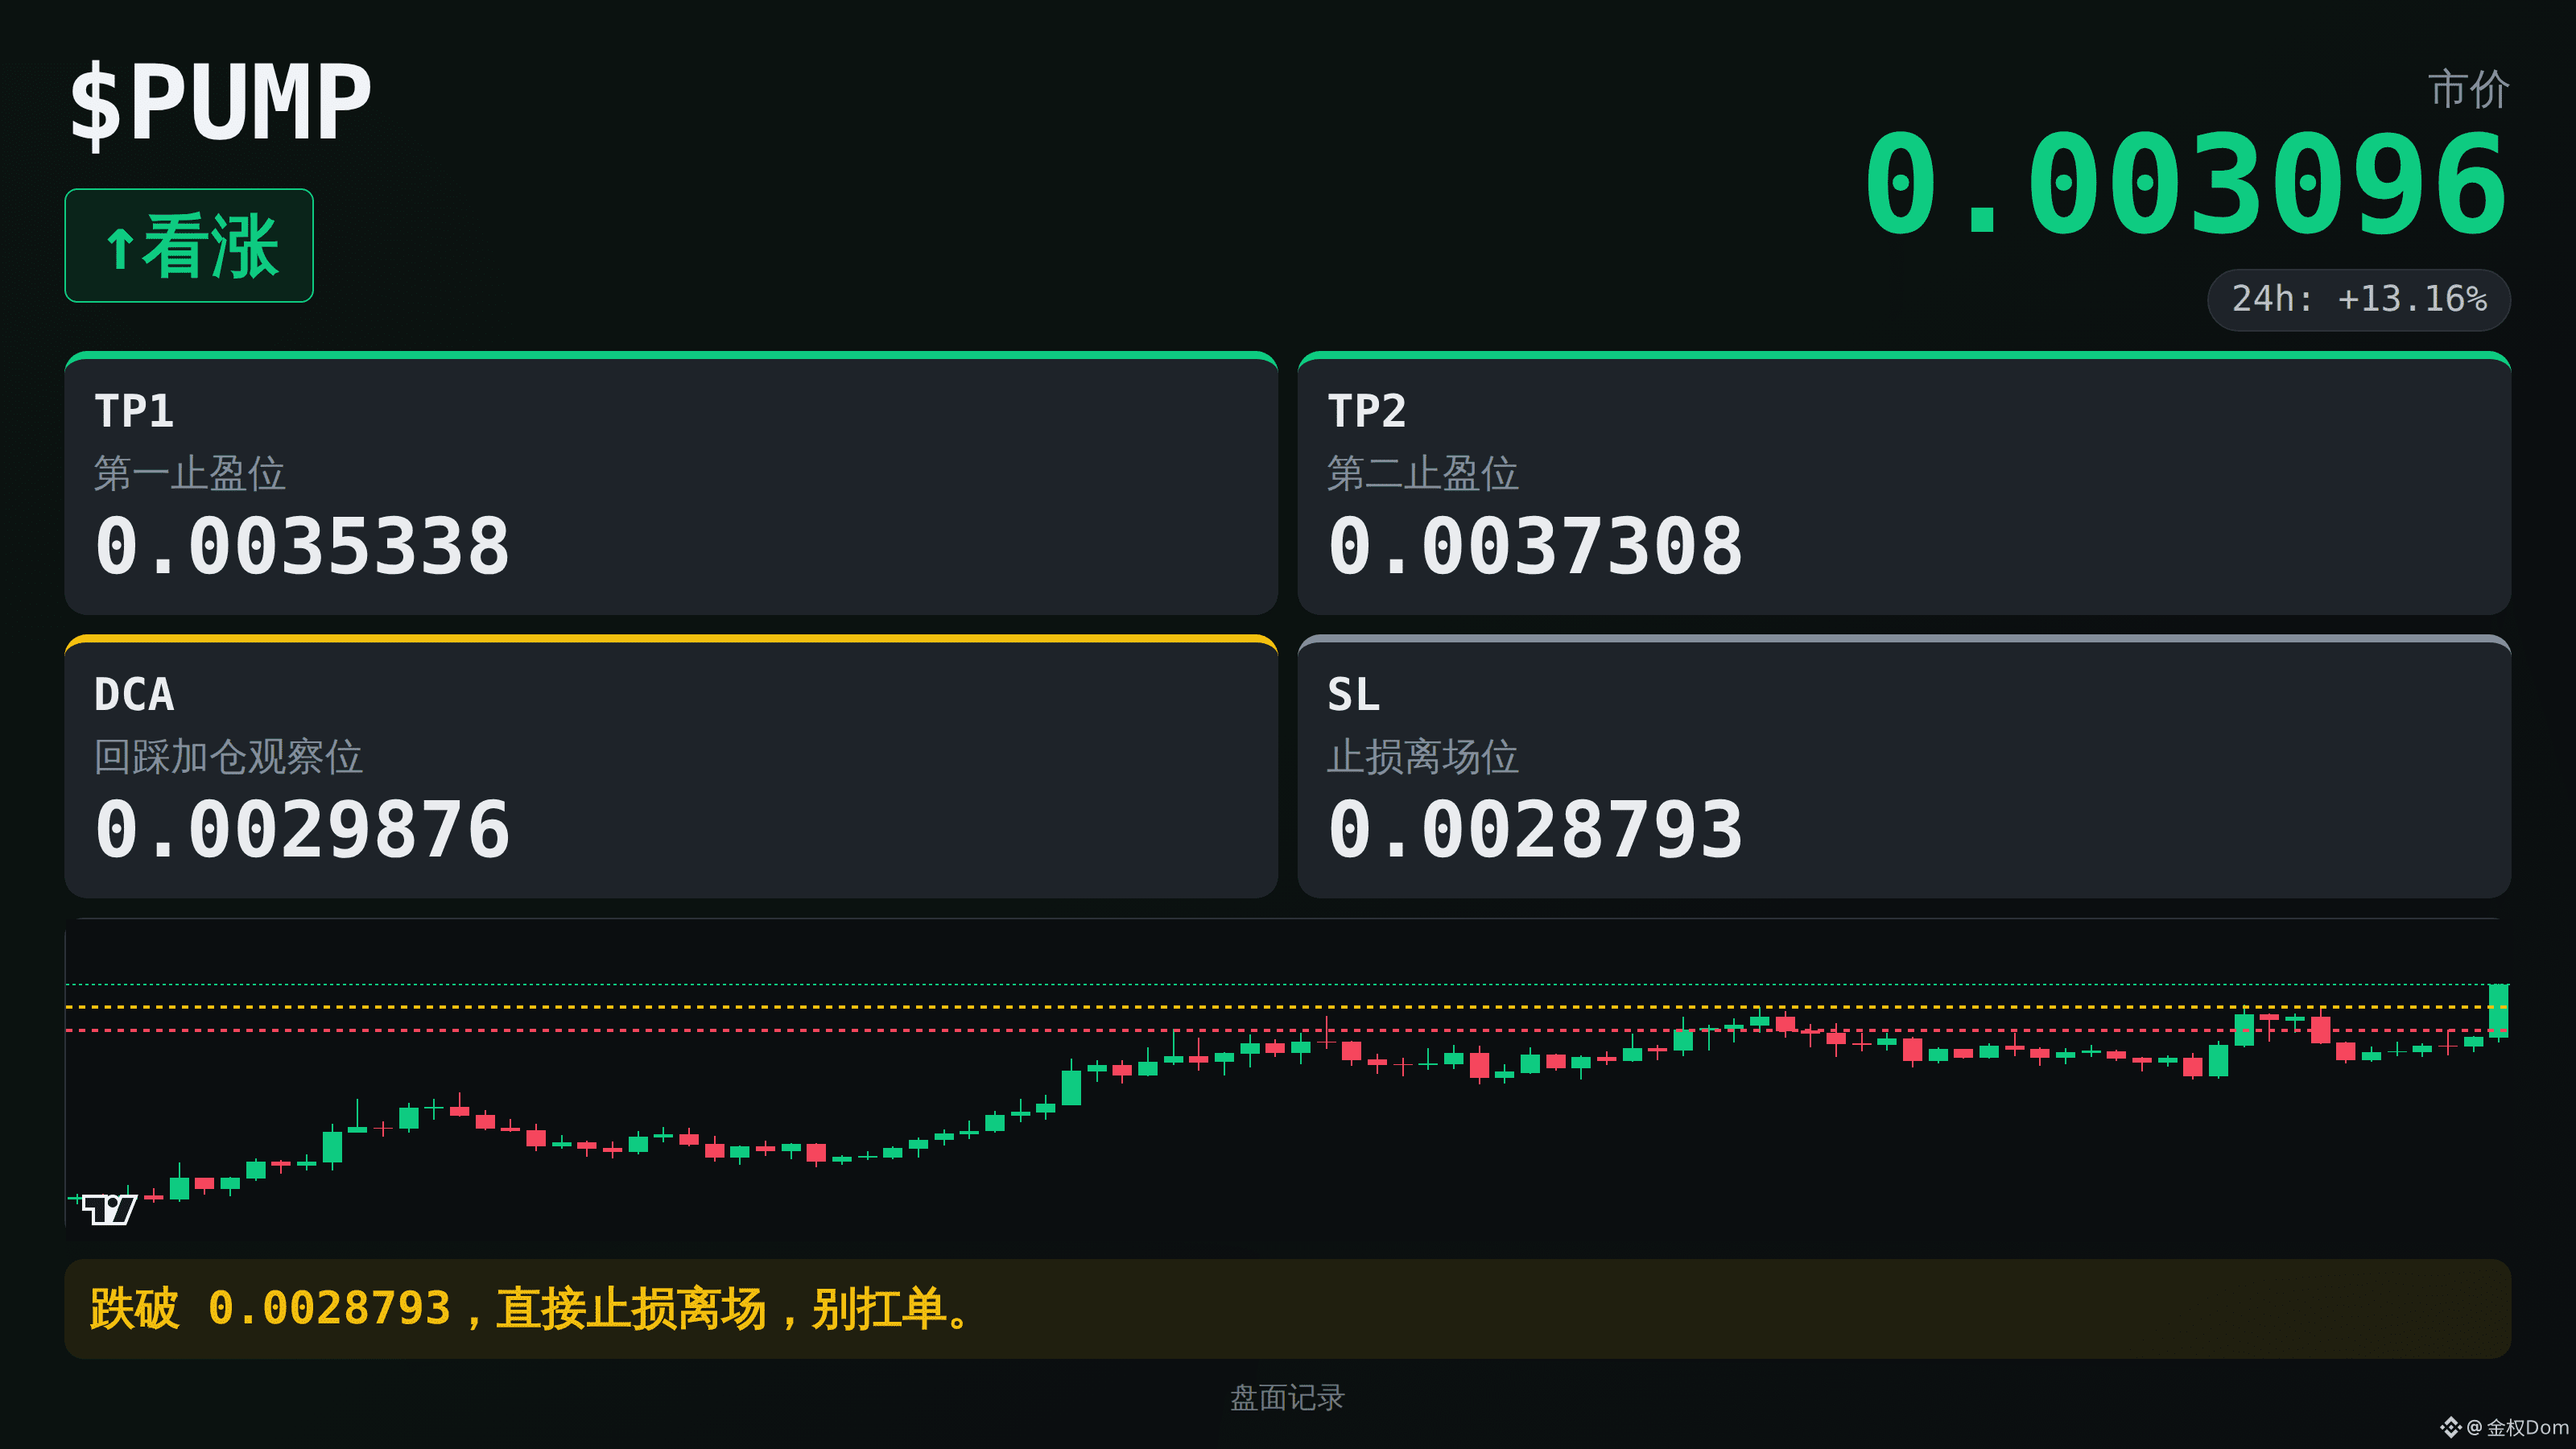
$PUMP Bullish, enter at market price directly: 0.003096
Above TP1: 0.0035338 (first take-profit level)
Above TP2: 0.0037308 (second take-profit level)
DCA: 0.0029876 (pullback/additional-buy observation level)
SL: 0.0028793 (stop-loss exit level)
The hype has picked up—yes, the market cap is now ranked #60, and sentiment has improved. In the past 24h it has risen 13%, broke above the 4H previous high. There are clearly more long accounts. The fee rate of 0.0007% isn’t high either; it looks like the hype may be turning into buying pressure. But positions have actually decreased slightly—so pay attention in case it’s just emotion-driven trading. Add a little at the current price, but don’t go heavy.
If it breaks below 0.0028793, stop out immediately and exit—don’t hold and hope.
$PUMP Bullish, enter at market price directly: 0.003096
Above TP1: 0.0035338 (first take-profit level)
Above TP2: 0.0037308 (second take-profit level)
DCA: 0.0029876 (pullback/additional-buy observation level)
SL: 0.0028793 (stop-loss exit level)
The hype has picked up—yes, the market cap is now ranked #60, and sentiment has improved. In the past 24h it has risen 13%, broke above the 4H previous high. There are clearly more long accounts. The fee rate of 0.0007% isn’t high either; it looks like the hype may be turning into buying pressure. But positions have actually decreased slightly—so pay attention in case it’s just emotion-driven trading. Add a little at the current price, but don’t go heavy.
If it breaks below 0.0028793, stop out immediately and exit—don’t hold and hope.
Above TP1: 0.0035338 (first take-profit level)
Above TP2: 0.0037308 (second take-profit level)
DCA: 0.0029876 (pullback/additional-buy observation level)
SL: 0.0028793 (stop-loss exit level)
The hype has picked up—yes, the market cap is now ranked #60, and sentiment has improved. In the past 24h it has risen 13%, broke above the 4H previous high. There are clearly more long accounts. The fee rate of 0.0007% isn’t high either; it looks like the hype may be turning into buying pressure. But positions have actually decreased slightly—so pay attention in case it’s just emotion-driven trading. Add a little at the current price, but don’t go heavy.
If it breaks below 0.0028793, stop out immediately and exit—don’t hold and hope.
270

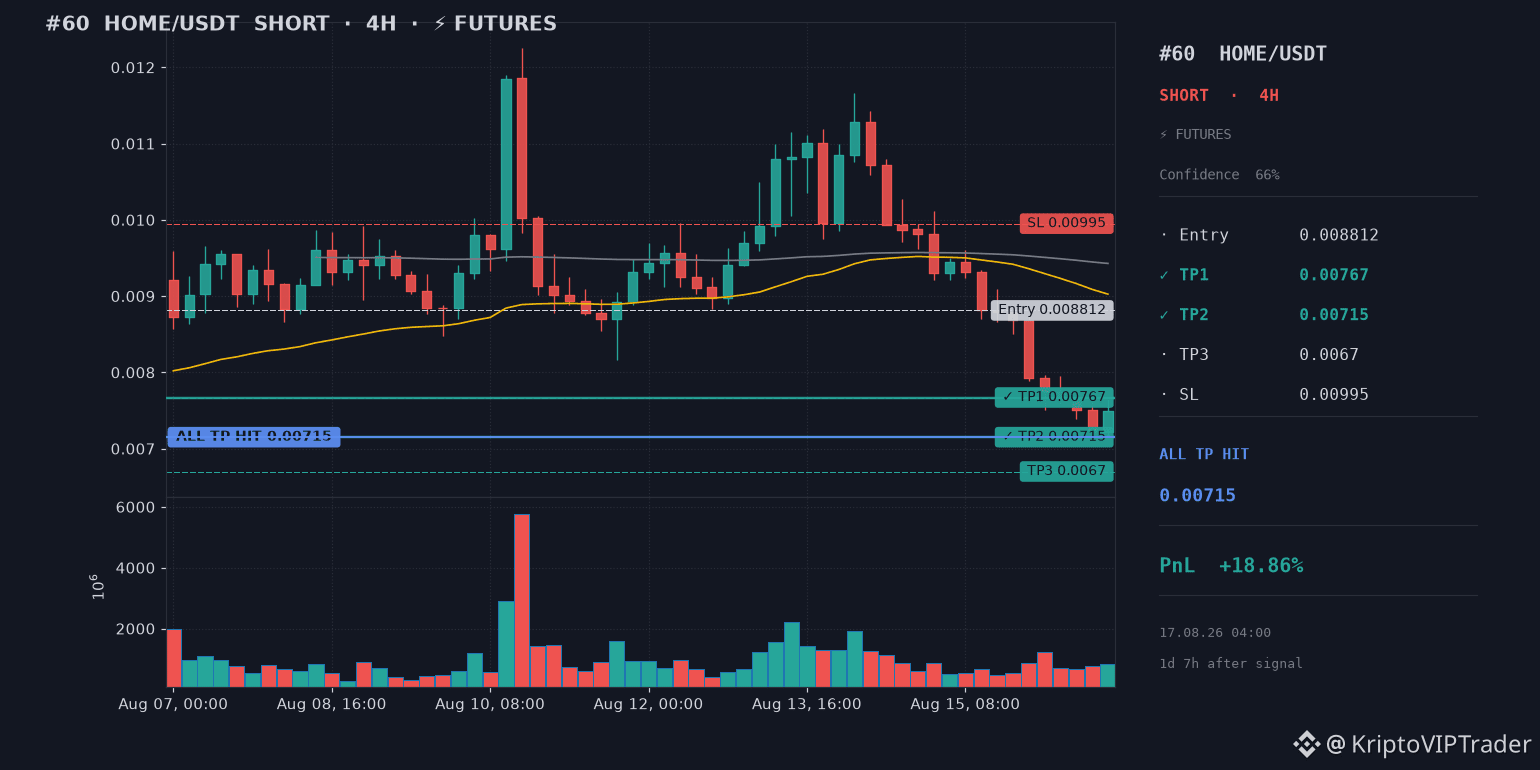
✅ TP2 HIT — TARGET SECURED — $HOME
↩️ #60 · 15.08.26 20:03
🔴 SHORT 🐻 · 4H
📊 Entry: 0.008812 → Exit: 0.007150
📈 Profit: +18.86%
⏱ 17.08.26 04:00 · 1d 7h after signal
↩️ Original post: https://app.binance.com/uni-qr/cpos/356019452495217?r=OSVK1NAK&l=ru
✅ TP2 HIT — TARGET SECURED — $HOME
↩️ #60 · 15.08.26 20:03
🔴 SHORT 🐻 · 4H
📊 Entry: 0.008812 → Exit: 0.007150
📈 Profit: +18.86%
⏱ 17.08.26 04:00 · 1d 7h after signal
↩️ Original post: https://app.binance.com/uni-qr/cpos/356019452495217?r=OSVK1NAK&l=ru
↩️ #60 · 15.08.26 20:03
🔴 SHORT 🐻 · 4H
📊 Entry: 0.008812 → Exit: 0.007150
📈 Profit: +18.86%
⏱ 17.08.26 04:00 · 1d 7h after signal
↩️ Original post: https://app.binance.com/uni-qr/cpos/356019452495217?r=OSVK1NAK&l=ru
115

·
--
🎭 1 hour ago, Nine-Nine said "Leverage flip-flop script", 1 hour later, BTC shorts suddenly capitulated.
Just checked my phone, the entire market played a joke on me in 1 hour.
1 hour ago (14:41), I just finished writing about Nine-Nine, the theme was "Leverage funds flip-flopping within 2 hours" — BTC shorts ran scared 2 hours ago, then doubled down 2 hours later, SOL funding reversed deepening 1.48x, the most dramatic expression of "I don't believe it".
As a result, 1 hour later (15:44), the script flipped 180 degrees again:
❶ BTC funding flipped from -0.00001224% to +0.00000425% in 1 hour, turning from negative to positive. Translation: Leverage shorts actively closed their positions in 1 hour, "I don't believe it" turned into "I'm out first".
❷ However, ETH funding deepened by 15% (-0.00010253%, one of the deepest 4 levels), SOL funding deepened by 24% (-0.00023273%, the deepest in history!) — ETH and SOL shorts not only didn't close, but also crazily added more shorts.
❸ Price barely moved in 1 hour: BTC $62,154.90 (-0.01%) / ETH $1,610.51 (-0.23%) / BNB $588.89 (+0.02%) / SOL $64.82 (-0.09%). But the funding differentiation in 1 hour is the most dramatic since the weekend: BTC flat + ETH/SOL up, leverage funds are operating on a "BTC retreat + ETH/SOL surge" three-line strategy.
❹ BNB funding at 0% for the 8th consecutive day. The story I told a week ago about "being abandoned = being protected" continues to stabilize.
❺ FNG 12 EXTREME FEAR for the 8th consecutive day. Prices flat in 1 hour, sentiment also unchanged, "the market is immune to rebounds" = "the market is also immune to sideways movement".
I got slapped in the face 2 hours ago, slapped again 1 hour ago, now I've learned my lesson — the weekend funding script must be re-read on an hourly basis, any judgment made 30 minutes ago could be counter-trend, leverage funds themselves don’t even know the direction, why should I decide for them?
DCA 60th buy at 15:57, deducted 13 minutes later, BTC $62,154.90 = I don't care how you leverage plays out, I just follow the rhythm for deductions. The logic of 30 years of dollar-cost averaging has never been about "betting on the right script", but rather "not betting on the script".
5 controversial questions:
❶ BTC funding flipped from negative to positive in 1 hour = Leverage shorts capitulated OR just a technical closure (to avoid weekend volatility at midnight)?
❷ ETH funding deepened by 15% + SOL funding deepened by 24% = Is the showdown for mainstream coin shorts happening in ETH and SOL where they are also trapped and can only add more?
❸ SOL funding at -0.00023273% = the 4th deepest historical negative = Are SOL shorts the most stubborn OR is SOL the most shorted asset?
❹ BNB funding at 0% for 8 consecutive days = "being abandoned = being protected" OR is BNB being structurally marginalized?
❺ DCA #60 15:57 13 minutes later deducted, BTC $62,154.90 = Rebound top OR rebound continuation?
🎭 1 hour ago, Nine-Nine said "Leverage flip-flop script", 1 hour later, BTC shorts suddenly capitulated.
Just checked my phone, the entire market played a joke on me in 1 hour.
1 hour ago (14:41), I just finished writing about Nine-Nine, the theme was "Leverage funds flip-flopping within 2 hours" — BTC shorts ran scared 2 hours ago, then doubled down 2 hours later, SOL funding reversed deepening 1.48x, the most dramatic expression of "I don't believe it".
As a result, 1 hour later (15:44), the script flipped 180 degrees again:
❶ BTC funding flipped from -0.00001224% to +0.00000425% in 1 hour, turning from negative to positive. Translation: Leverage shorts actively closed their positions in 1 hour, "I don't believe it" turned into "I'm out first".
❷ However, ETH funding deepened by 15% (-0.00010253%, one of the deepest 4 levels), SOL funding deepened by 24% (-0.00023273%, the deepest in history!) — ETH and SOL shorts not only didn't close, but also crazily added more shorts.
❸ Price barely moved in 1 hour: BTC $62,154.90 (-0.01%) / ETH $1,610.51 (-0.23%) / BNB $588.89 (+0.02%) / SOL $64.82 (-0.09%). But the funding differentiation in 1 hour is the most dramatic since the weekend: BTC flat + ETH/SOL up, leverage funds are operating on a "BTC retreat + ETH/SOL surge" three-line strategy.
❹ BNB funding at 0% for the 8th consecutive day. The story I told a week ago about "being abandoned = being protected" continues to stabilize.
❺ FNG 12 EXTREME FEAR for the 8th consecutive day. Prices flat in 1 hour, sentiment also unchanged, "the market is immune to rebounds" = "the market is also immune to sideways movement".
I got slapped in the face 2 hours ago, slapped again 1 hour ago, now I've learned my lesson — the weekend funding script must be re-read on an hourly basis, any judgment made 30 minutes ago could be counter-trend, leverage funds themselves don’t even know the direction, why should I decide for them?
DCA 60th buy at 15:57, deducted 13 minutes later, BTC $62,154.90 = I don't care how you leverage plays out, I just follow the rhythm for deductions. The logic of 30 years of dollar-cost averaging has never been about "betting on the right script", but rather "not betting on the script".
5 controversial questions:
❶ BTC funding flipped from negative to positive in 1 hour = Leverage shorts capitulated OR just a technical closure (to avoid weekend volatility at midnight)?
❷ ETH funding deepened by 15% + SOL funding deepened by 24% = Is the showdown for mainstream coin shorts happening in ETH and SOL where they are also trapped and can only add more?
❸ SOL funding at -0.00023273% = the 4th deepest historical negative = Are SOL shorts the most stubborn OR is SOL the most shorted asset?
❹ BNB funding at 0% for 8 consecutive days = "being abandoned = being protected" OR is BNB being structurally marginalized?
❺ DCA #60 15:57 13 minutes later deducted, BTC $62,154.90 = Rebound top OR rebound continuation?
Just checked my phone, the entire market played a joke on me in 1 hour.
1 hour ago (14:41), I just finished writing about Nine-Nine, the theme was "Leverage funds flip-flopping within 2 hours" — BTC shorts ran scared 2 hours ago, then doubled down 2 hours later, SOL funding reversed deepening 1.48x, the most dramatic expression of "I don't believe it".
As a result, 1 hour later (15:44), the script flipped 180 degrees again:
❶ BTC funding flipped from -0.00001224% to +0.00000425% in 1 hour, turning from negative to positive. Translation: Leverage shorts actively closed their positions in 1 hour, "I don't believe it" turned into "I'm out first".
❷ However, ETH funding deepened by 15% (-0.00010253%, one of the deepest 4 levels), SOL funding deepened by 24% (-0.00023273%, the deepest in history!) — ETH and SOL shorts not only didn't close, but also crazily added more shorts.
❸ Price barely moved in 1 hour: BTC $62,154.90 (-0.01%) / ETH $1,610.51 (-0.23%) / BNB $588.89 (+0.02%) / SOL $64.82 (-0.09%). But the funding differentiation in 1 hour is the most dramatic since the weekend: BTC flat + ETH/SOL up, leverage funds are operating on a "BTC retreat + ETH/SOL surge" three-line strategy.
❹ BNB funding at 0% for the 8th consecutive day. The story I told a week ago about "being abandoned = being protected" continues to stabilize.
❺ FNG 12 EXTREME FEAR for the 8th consecutive day. Prices flat in 1 hour, sentiment also unchanged, "the market is immune to rebounds" = "the market is also immune to sideways movement".
I got slapped in the face 2 hours ago, slapped again 1 hour ago, now I've learned my lesson — the weekend funding script must be re-read on an hourly basis, any judgment made 30 minutes ago could be counter-trend, leverage funds themselves don’t even know the direction, why should I decide for them?
DCA 60th buy at 15:57, deducted 13 minutes later, BTC $62,154.90 = I don't care how you leverage plays out, I just follow the rhythm for deductions. The logic of 30 years of dollar-cost averaging has never been about "betting on the right script", but rather "not betting on the script".
5 controversial questions:
❶ BTC funding flipped from negative to positive in 1 hour = Leverage shorts capitulated OR just a technical closure (to avoid weekend volatility at midnight)?
❷ ETH funding deepened by 15% + SOL funding deepened by 24% = Is the showdown for mainstream coin shorts happening in ETH and SOL where they are also trapped and can only add more?
❸ SOL funding at -0.00023273% = the 4th deepest historical negative = Are SOL shorts the most stubborn OR is SOL the most shorted asset?
❹ BNB funding at 0% for 8 consecutive days = "being abandoned = being protected" OR is BNB being structurally marginalized?
❺ DCA #60 15:57 13 minutes later deducted, BTC $62,154.90 = Rebound top OR rebound continuation?
489

$BASED $VELVET $LINK
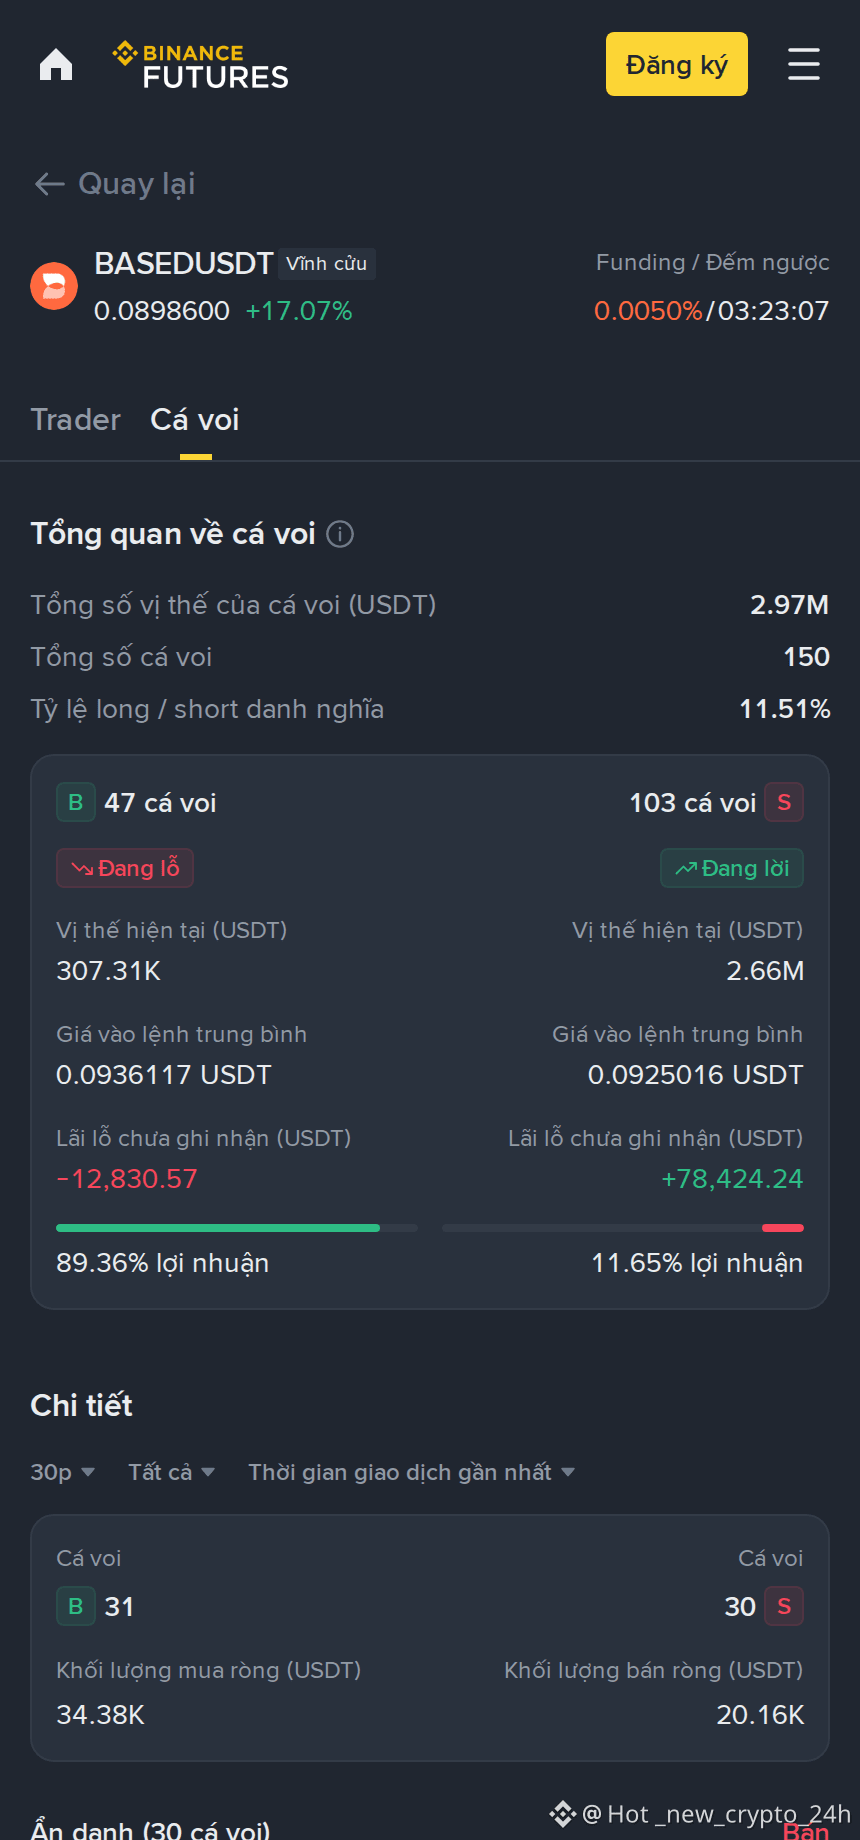
Whale Radar #60
$BASED just entered the watch zone.
The +17.01% figure is making the watchlist shine brighter than usual.
Whales may be quiet, but this segment is anything but sleepy.
Tomorrow we’ll dive back into some market segments to see what's unfolding.
$BASED $VELVET $LINK
Whale Radar #60
$BASED just entered the watch zone.
The +17.01% figure is making the watchlist shine brighter than usual.
Whales may be quiet, but this segment is anything but sleepy.
Tomorrow we’ll dive back into some market segments to see what's unfolding.
Whale Radar #60
$BASED just entered the watch zone.
The +17.01% figure is making the watchlist shine brighter than usual.
Whales may be quiet, but this segment is anything but sleepy.
Tomorrow we’ll dive back into some market segments to see what's unfolding.
352
Log in to explore more content
Join global crypto users on Binance Square
⚡️ Get latest and useful information about crypto.
💬 Trusted by the world’s largest crypto exchange.
👍 Discover real insights from verified creators.
Email / Phone number
Trending Topics
1
#AppleDebutsFoldablePhone
47,115 views
926 Discussing
2
#TSMCAugustRevenueUp53.3%YoY
10,827 views
308 Discussing
3
#IranSaysReadyToEscalateWarWithUS
13,625 views
327 Discussing
4
#EUExtendsCentralContactPointToCASPs
13,732 views
362 Discussing
5
#US10YTreasuryYieldHitsHighestSinceNov2023
36,869 views
575 Discussing
6
#USTreasuryToBuyBackUpTo$6BLongDatedDebt
21,427 views
181 Discussing
7
#BitcoinSurpasses$79K
74,801 views
295 Discussing
8
#BrentCrudeTops$100
134,075 views
422 Discussing
9
#USADPWeeklyEmploymentRises12000
125,565 views
1,497 Discussing
10
#BankOfAmericaGroupPilotsUSBDCStablecoin
93,124 views
1,181 Discussing