
#55
55
13,245 views
53 Discussing
Hot
Latest

·
--
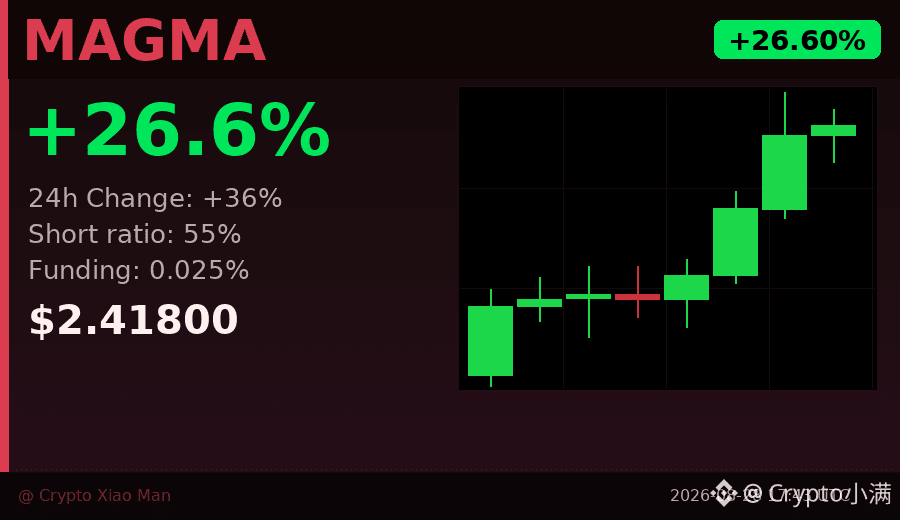
36%, a day.
MAGMA’s increase today isn’t outrageous, but there’s one number that made me take a second look: the short position ratio is 55%, while the long position is only 45%.
It’s up by a third, yet most people are still shorting.
This divergence is interesting—usually when a coin surges hard, retail investors rush to chase longs, forcing shorts to close, which triggers a stampede. But with MAGMA, shorts are still in the dominant position, suggesting there are still a large number of people in the market who don’t believe in this move, or who are betting on a pullback.
From the K-line, the most recent 1-hour candle’s volume suddenly jumped to 37 million, more than double the average volume. It closed near the highs with no obvious long upper wick, and the buy pressure looks solid.
The funding rate is 0.025%, slightly positive. This indicates longs are paying, but not at an expensive level—there are no signs of overheating.
If the shorts start to get squeezed, forced liquidations can turn into additional buy orders—this is one of the structural reasons the short-term trend might continue for a bit.
However, keep in mind: today’s peak touched 0.505, and it has since pulled back to around 0.49, where there is overhead resistance. Whether it can hold steady at this level is the most important point to watch next.
$MAGMA #空头被套 #55% shorts
Click the small card below to quickly check the行情👇
36%, a day.
MAGMA’s increase today isn’t outrageous, but there’s one number that made me take a second look: the short position ratio is 55%, while the long position is only 45%.
It’s up by a third, yet most people are still shorting.
This divergence is interesting—usually when a coin surges hard, retail investors rush to chase longs, forcing shorts to close, which triggers a stampede. But with MAGMA, shorts are still in the dominant position, suggesting there are still a large number of people in the market who don’t believe in this move, or who are betting on a pullback.
From the K-line, the most recent 1-hour candle’s volume suddenly jumped to 37 million, more than double the average volume. It closed near the highs with no obvious long upper wick, and the buy pressure looks solid.
The funding rate is 0.025%, slightly positive. This indicates longs are paying, but not at an expensive level—there are no signs of overheating.
If the shorts start to get squeezed, forced liquidations can turn into additional buy orders—this is one of the structural reasons the short-term trend might continue for a bit.
However, keep in mind: today’s peak touched 0.505, and it has since pulled back to around 0.49, where there is overhead resistance. Whether it can hold steady at this level is the most important point to watch next.
$MAGMA #空头被套 #55% shorts
Click the small card below to quickly check the行情👇
MAGMA’s increase today isn’t outrageous, but there’s one number that made me take a second look: the short position ratio is 55%, while the long position is only 45%.
It’s up by a third, yet most people are still shorting.
This divergence is interesting—usually when a coin surges hard, retail investors rush to chase longs, forcing shorts to close, which triggers a stampede. But with MAGMA, shorts are still in the dominant position, suggesting there are still a large number of people in the market who don’t believe in this move, or who are betting on a pullback.
From the K-line, the most recent 1-hour candle’s volume suddenly jumped to 37 million, more than double the average volume. It closed near the highs with no obvious long upper wick, and the buy pressure looks solid.
The funding rate is 0.025%, slightly positive. This indicates longs are paying, but not at an expensive level—there are no signs of overheating.
If the shorts start to get squeezed, forced liquidations can turn into additional buy orders—this is one of the structural reasons the short-term trend might continue for a bit.
However, keep in mind: today’s peak touched 0.505, and it has since pulled back to around 0.49, where there is overhead resistance. Whether it can hold steady at this level is the most important point to watch next.
$MAGMA #空头被套 #55% shorts
Click the small card below to quickly check the行情👇
68

·
--
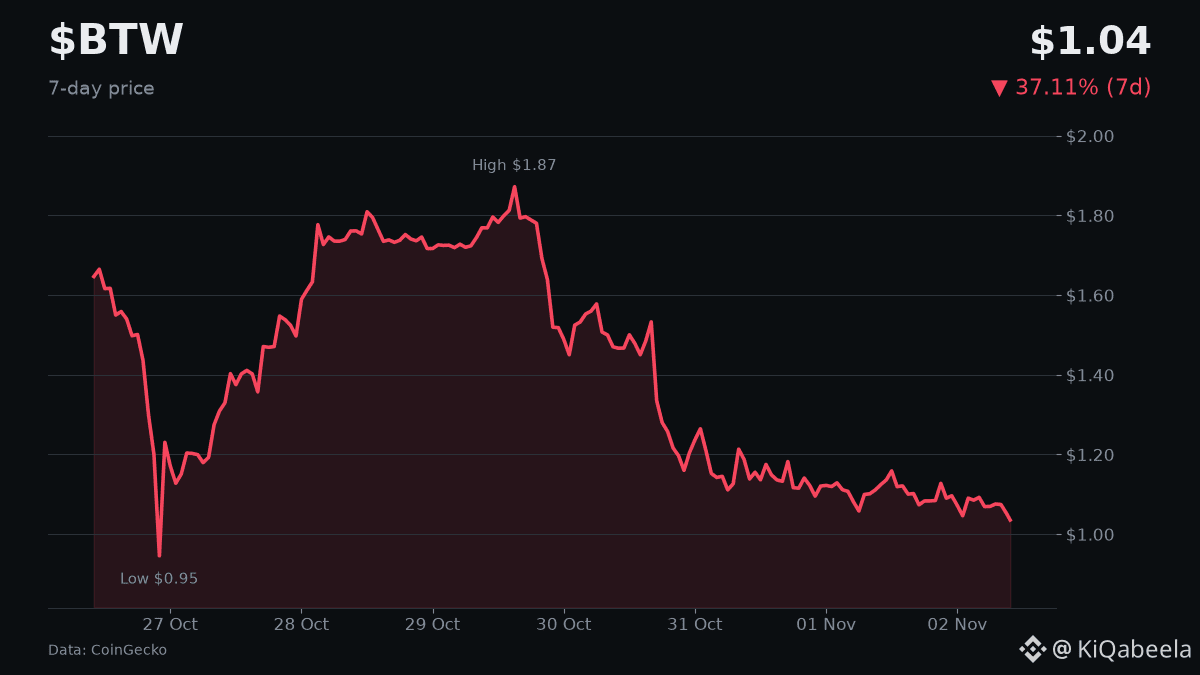
Facing a 9.1% dip, $BTW tests resilience
The token slid to $1.12, touching a low of $1.085 after peaking at $1.31. Volume hit about $7.3 M, indicating traders are active despite the fear‑driven market sentiment (Fear & Greed index 30).
With a market‑cap rank of #55, the move suggests a short‑term correction rather than a structural shift. Holders should watch volume trends and sentiment for the next swing.
💬 What’s your outlook in one word?
#BTW
Facing a 9.1% dip, $BTW tests resilience
The token slid to $1.12, touching a low of $1.085 after peaking at $1.31. Volume hit about $7.3 M, indicating traders are active despite the fear‑driven market sentiment (Fear & Greed index 30).
With a market‑cap rank of #55, the move suggests a short‑term correction rather than a structural shift. Holders should watch volume trends and sentiment for the next swing.
💬 What’s your outlook in one word?
#BTW
The token slid to $1.12, touching a low of $1.085 after peaking at $1.31. Volume hit about $7.3 M, indicating traders are active despite the fear‑driven market sentiment (Fear & Greed index 30).
With a market‑cap rank of #55, the move suggests a short‑term correction rather than a structural shift. Holders should watch volume trends and sentiment for the next swing.
💬 What’s your outlook in one word?
#BTW
30

·
--
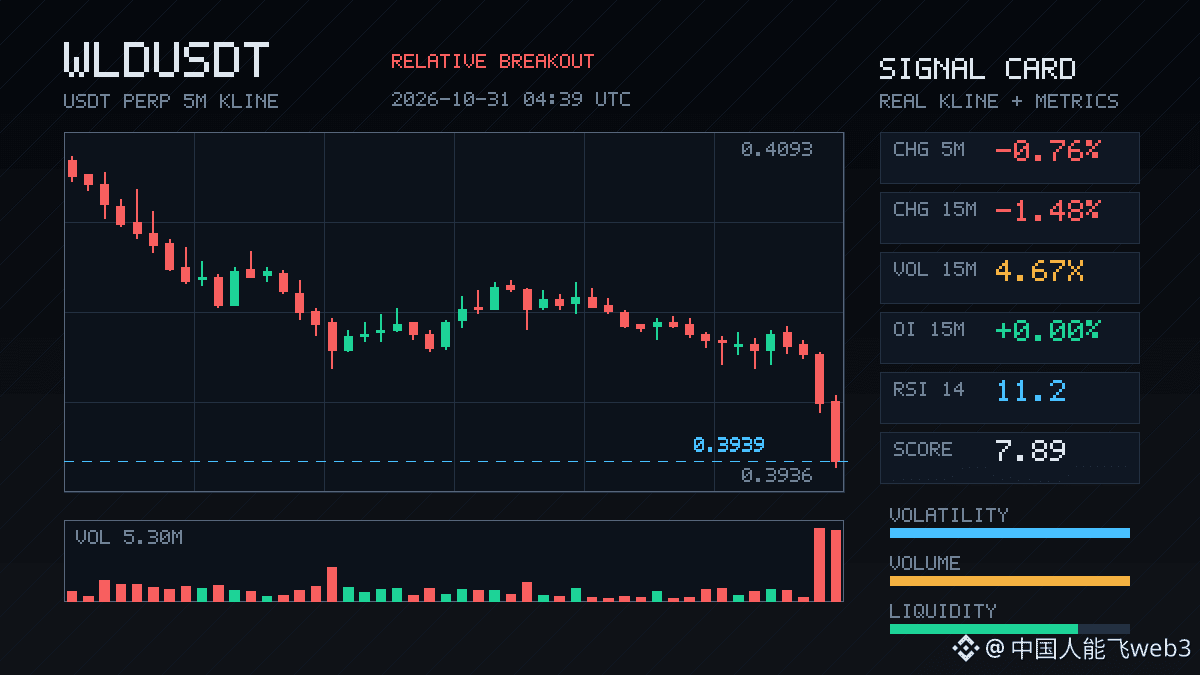
WLD took a pretty decisive hit over the past 15 minutes, dropping 1.48%. Volume expanded straight to 4.67x, the buy/sell ratio was 0.57, and the taker flow delta was -27.8%—the bears are definitely taking action.
What’s interesting, though, is OI: the nominal change was -0.84% on both the 15m and 1h timeframes. Contract volume hasn’t risen much, so with price down and OI flat, this looks more like existing leveraged positions being closed out than new shorts entering. It’s not quite the same as the “price down + OI surging” pattern of fresh shorting, so this signal deserves a bit less weight.
Still, price has clearly broken below the lower end of the range from the last 20 5m candles, and the funding rate remains in a high percentile relative to recent levels, suggesting longs are paying a hefty cost. With 24h trading volume at 217 million and sufficient market depth, this isn’t just a random little dip.
At the 67.5th percentile for anomalies and ranked #55 across the whole pool, with nominal change ranked #17, it’s near the top of the pool. If you’re looking to short, I’d lean toward waiting for a retest to confirm rather than jumping in on the first high-volume candle.
WLD took a pretty decisive hit over the past 15 minutes, dropping 1.48%. Volume expanded straight to 4.67x, the buy/sell ratio was 0.57, and the taker flow delta was -27.8%—the bears are definitely taking action.
What’s interesting, though, is OI: the nominal change was -0.84% on both the 15m and 1h timeframes. Contract volume hasn’t risen much, so with price down and OI flat, this looks more like existing leveraged positions being closed out than new shorts entering. It’s not quite the same as the “price down + OI surging” pattern of fresh shorting, so this signal deserves a bit less weight.
Still, price has clearly broken below the lower end of the range from the last 20 5m candles, and the funding rate remains in a high percentile relative to recent levels, suggesting longs are paying a hefty cost. With 24h trading volume at 217 million and sufficient market depth, this isn’t just a random little dip.
At the 67.5th percentile for anomalies and ranked #55 across the whole pool, with nominal change ranked #17, it’s near the top of the pool. If you’re looking to short, I’d lean toward waiting for a retest to confirm rather than jumping in on the first high-volume candle.
What’s interesting, though, is OI: the nominal change was -0.84% on both the 15m and 1h timeframes. Contract volume hasn’t risen much, so with price down and OI flat, this looks more like existing leveraged positions being closed out than new shorts entering. It’s not quite the same as the “price down + OI surging” pattern of fresh shorting, so this signal deserves a bit less weight.
Still, price has clearly broken below the lower end of the range from the last 20 5m candles, and the funding rate remains in a high percentile relative to recent levels, suggesting longs are paying a hefty cost. With 24h trading volume at 217 million and sufficient market depth, this isn’t just a random little dip.
At the 67.5th percentile for anomalies and ranked #55 across the whole pool, with nominal change ranked #17, it’s near the top of the pool. If you’re looking to short, I’d lean toward waiting for a retest to confirm rather than jumping in on the first high-volume candle.
1

·
--
💣 Don’t let the rebound fool you—$ASTER I’m currently firmly 【bearish】
$ASTER (Aster) | Daily chart
I. Trend
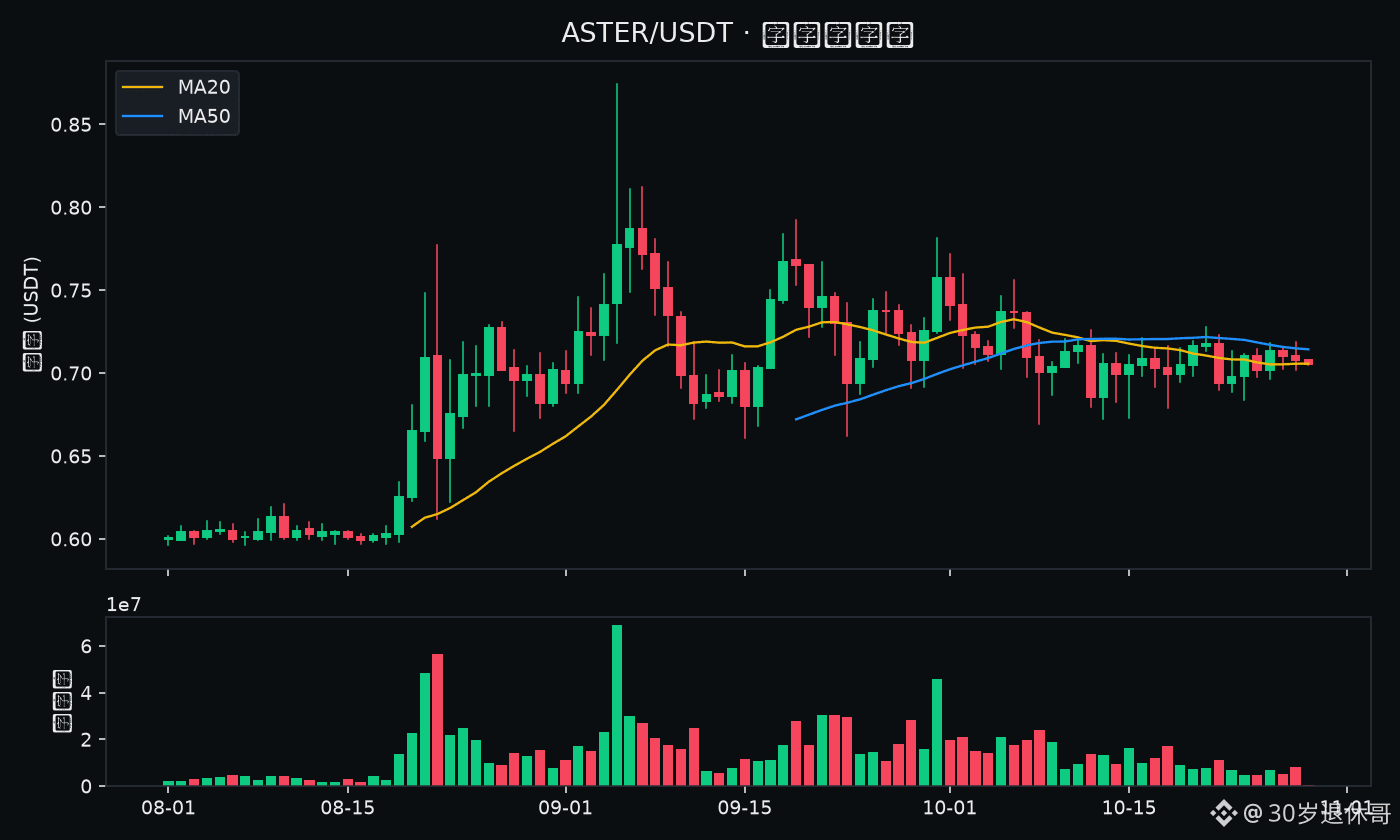
Market cap rank around #55; current price around 0.705500 USDT. MA20 ≈ 0.705675 and MA50 ≈ 0.714290. Price is below both moving averages, and each rebound looks more like an exit window for holders who are underwater. In a bearish trend, “buying the dip” can easily turn into “catching a falling knife.”
II. Key levels and invalidation
Resistance ≈ 0.727800; support ≈ 0.672100. If price can’t break through resistance and then breaks below support on heavy volume, that’s the bearish scenario. The invalidation level is 0.727800; if price convincingly gets back above it, I’ll admit I’m wrong and turn neutral.
III. Volume
Yesterday’s volume was about 0.8 times the 20-day average. Structure matters more than noise—volume is needed to confirm whether a breakout is real.
【My view】$ASTER: Bearish.
I’ll be watching closely to see whether a rebound near 0.727800 gets rejected, and whether 0.672100 holds.
In a bear market, “just hold on a little longer” is often the most expensive move. The chart has shown its hand. I’m putting my view out there; price action will provide the answer.
⚠️ The above is solely my personal public-market technical observation and expression of sentiment, and does not constitute investment advice. Crypto is extremely volatile; make your own decisions, manage risk strictly, and accept responsibility for your own gains and losses.
$BTC $ETH $ASTER #看空 #技术分析 #币安广场 #30-year-old-retirement-bro
💣 Don’t let the rebound fool you—$ASTER I’m currently firmly 【bearish】
$ASTER (Aster) | Daily chart
I. Trend
Market cap rank around #55; current price around 0.705500 USDT. MA20 ≈ 0.705675 and MA50 ≈ 0.714290. Price is below both moving averages, and each rebound looks more like an exit window for holders who are underwater. In a bearish trend, “buying the dip” can easily turn into “catching a falling knife.”
II. Key levels and invalidation
Resistance ≈ 0.727800; support ≈ 0.672100. If price can’t break through resistance and then breaks below support on heavy volume, that’s the bearish scenario. The invalidation level is 0.727800; if price convincingly gets back above it, I’ll admit I’m wrong and turn neutral.
III. Volume
Yesterday’s volume was about 0.8 times the 20-day average. Structure matters more than noise—volume is needed to confirm whether a breakout is real.
【My view】$ASTER : Bearish.
I’ll be watching closely to see whether a rebound near 0.727800 gets rejected, and whether 0.672100 holds.
In a bear market, “just hold on a little longer” is often the most expensive move. The chart has shown its hand. I’m putting my view out there; price action will provide the answer.
⚠️ The above is solely my personal public-market technical observation and expression of sentiment, and does not constitute investment advice. Crypto is extremely volatile; make your own decisions, manage risk strictly, and accept responsibility for your own gains and losses.
$BTC $ETH $ASTER #看空 #技术分析 #币安广场 #30-year-old-retirement-bro
$ASTER (Aster) | Daily chart
I. Trend
Market cap rank around #55; current price around 0.705500 USDT. MA20 ≈ 0.705675 and MA50 ≈ 0.714290. Price is below both moving averages, and each rebound looks more like an exit window for holders who are underwater. In a bearish trend, “buying the dip” can easily turn into “catching a falling knife.”
II. Key levels and invalidation
Resistance ≈ 0.727800; support ≈ 0.672100. If price can’t break through resistance and then breaks below support on heavy volume, that’s the bearish scenario. The invalidation level is 0.727800; if price convincingly gets back above it, I’ll admit I’m wrong and turn neutral.
III. Volume
Yesterday’s volume was about 0.8 times the 20-day average. Structure matters more than noise—volume is needed to confirm whether a breakout is real.
【My view】$ASTER : Bearish.
I’ll be watching closely to see whether a rebound near 0.727800 gets rejected, and whether 0.672100 holds.
In a bear market, “just hold on a little longer” is often the most expensive move. The chart has shown its hand. I’m putting my view out there; price action will provide the answer.
⚠️ The above is solely my personal public-market technical observation and expression of sentiment, and does not constitute investment advice. Crypto is extremely volatile; make your own decisions, manage risk strictly, and accept responsibility for your own gains and losses.
$BTC $ETH $ASTER #看空 #技术分析 #币安广场 #30-year-old-retirement-bro
281
·
--
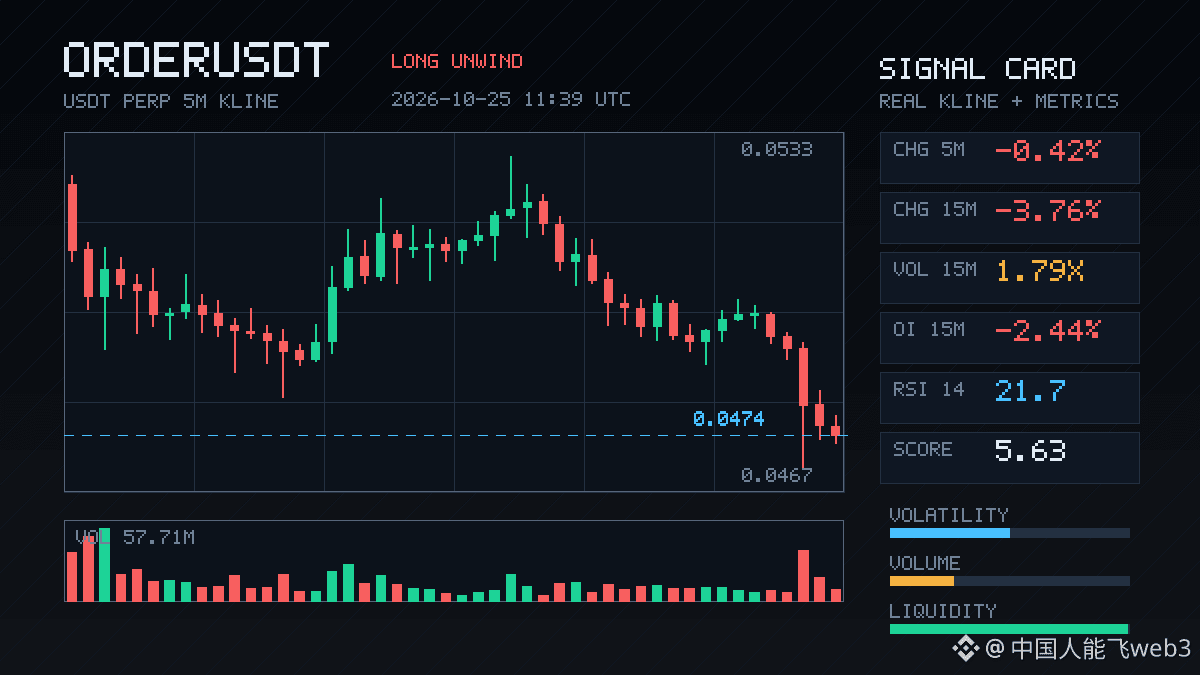
$ORDER made a pretty decisive drop here: down 3.76% in 15m, with volume picking up too. Volume at 1.79x alongside a volatility Z-score of 1.99—not the kind of slow, grinding decline that wears you down.
The key is OI: down 2.44% over 15m and 1.99% over 1h, with notional value shrinking by over 400,000 U. Price down + OI down is classic Definition long deleveraging: stop-losses got swept, rather than new shorts coming in to drive the price down. Aggressive trade delta was -16.1%, with a buy/sell ratio of 0.72. There’s selling pressure, but it looks more like a chain reaction of forced position closures.
The anomaly percentile is 80.6%, ranked #55 across the entire pool, and #15 for notional change—not the worst, but depth has confirmed it, with volume above normal and a directional bias. 24h turnover is still 930M, so liquidity hasn’t collapsed.
I generally wouldn’t chase shorts with this kind of structure. Once leverage has been flushed out, the price is actually more likely to stabilize. First, watch for volume to taper off after this deleveraging.
$ORDER made a pretty decisive drop here: down 3.76% in 15m, with volume picking up too. Volume at 1.79x alongside a volatility Z-score of 1.99—not the kind of slow, grinding decline that wears you down.
The key is OI: down 2.44% over 15m and 1.99% over 1h, with notional value shrinking by over 400,000 U. Price down + OI down is classic Definition long deleveraging: stop-losses got swept, rather than new shorts coming in to drive the price down. Aggressive trade delta was -16.1%, with a buy/sell ratio of 0.72. There’s selling pressure, but it looks more like a chain reaction of forced position closures.
The anomaly percentile is 80.6%, ranked #55 across the entire pool, and #15 for notional change—not the worst, but depth has confirmed it, with volume above normal and a directional bias. 24h turnover is still 930M, so liquidity hasn’t collapsed.
I generally wouldn’t chase shorts with this kind of structure. Once leverage has been flushed out, the price is actually more likely to stabilize. First, watch for volume to taper off after this deleveraging.
The key is OI: down 2.44% over 15m and 1.99% over 1h, with notional value shrinking by over 400,000 U. Price down + OI down is classic Definition long deleveraging: stop-losses got swept, rather than new shorts coming in to drive the price down. Aggressive trade delta was -16.1%, with a buy/sell ratio of 0.72. There’s selling pressure, but it looks more like a chain reaction of forced position closures.
The anomaly percentile is 80.6%, ranked #55 across the entire pool, and #15 for notional change—not the worst, but depth has confirmed it, with volume above normal and a directional bias. 24h turnover is still 930M, so liquidity hasn’t collapsed.
I generally wouldn’t chase shorts with this kind of structure. Once leverage has been flushed out, the price is actually more likely to stabilize. First, watch for volume to taper off after this deleveraging.
1

Article
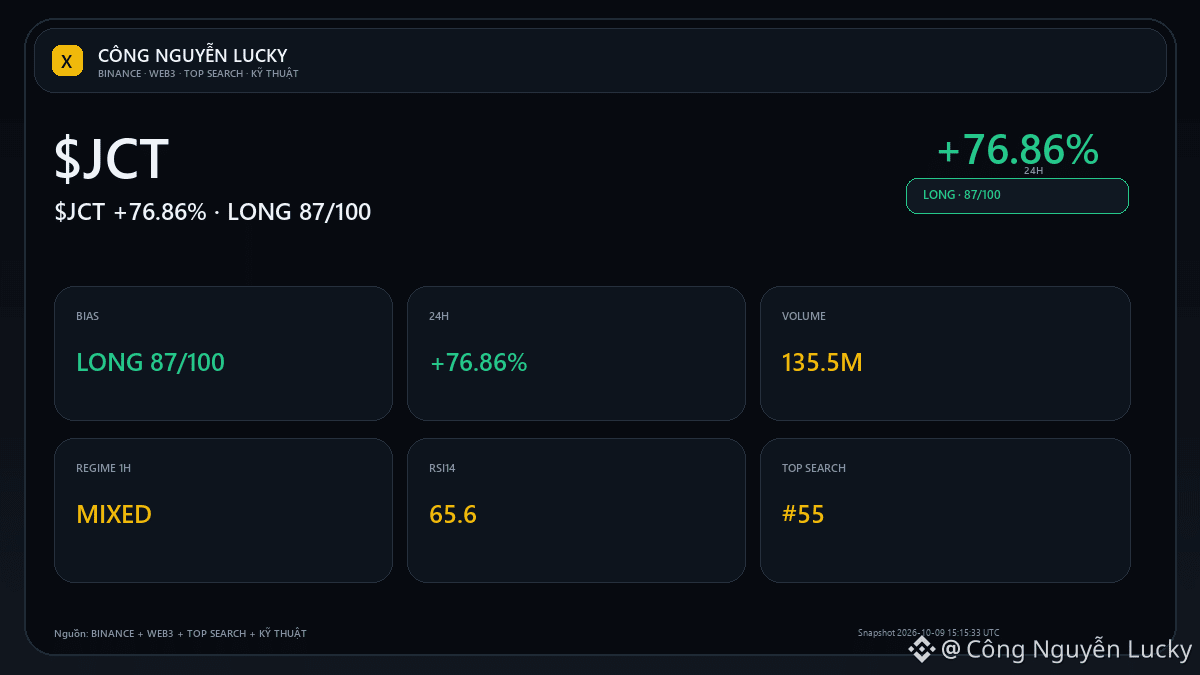
$JCT: double-bottom pattern awaiting confirmation🔥 $JCT up +76.86% — but the percentage gain/loss alone isn't enough to call this a good setup. Market: 0.002522 · 24h +76.86% · volume ~135.5M USDT · 1,992,394 trades.
Reference trigger level 0.002555 · status MIXED · technical bias LONG 95/100. Volume/ATR must expand on a pattern breakout; if price breaks through the level and then returns to the previous range, favor a false breakout rather than forcing continuation. Technical layers are being selected according to the regime:
$JCT: double-bottom pattern awaiting confirmation
🔥 $JCT up +76.86% — but the percentage gain/loss alone isn't enough to call this a good setup. Market: 0.002522 · 24h +76.86% · volume ~135.5M USDT · 1,992,394 trades.
Reference trigger level 0.002555 · status MIXED · technical bias LONG 95/100. Volume/ATR must expand on a pattern breakout; if price breaks through the level and then returns to the previous range, favor a false breakout rather than forcing continuation. Technical layers are being selected according to the regime:
Reference trigger level 0.002555 · status MIXED · technical bias LONG 95/100. Volume/ATR must expand on a pattern breakout; if price breaks through the level and then returns to the previous range, favor a false breakout rather than forcing continuation. Technical layers are being selected according to the regime:
202
Article
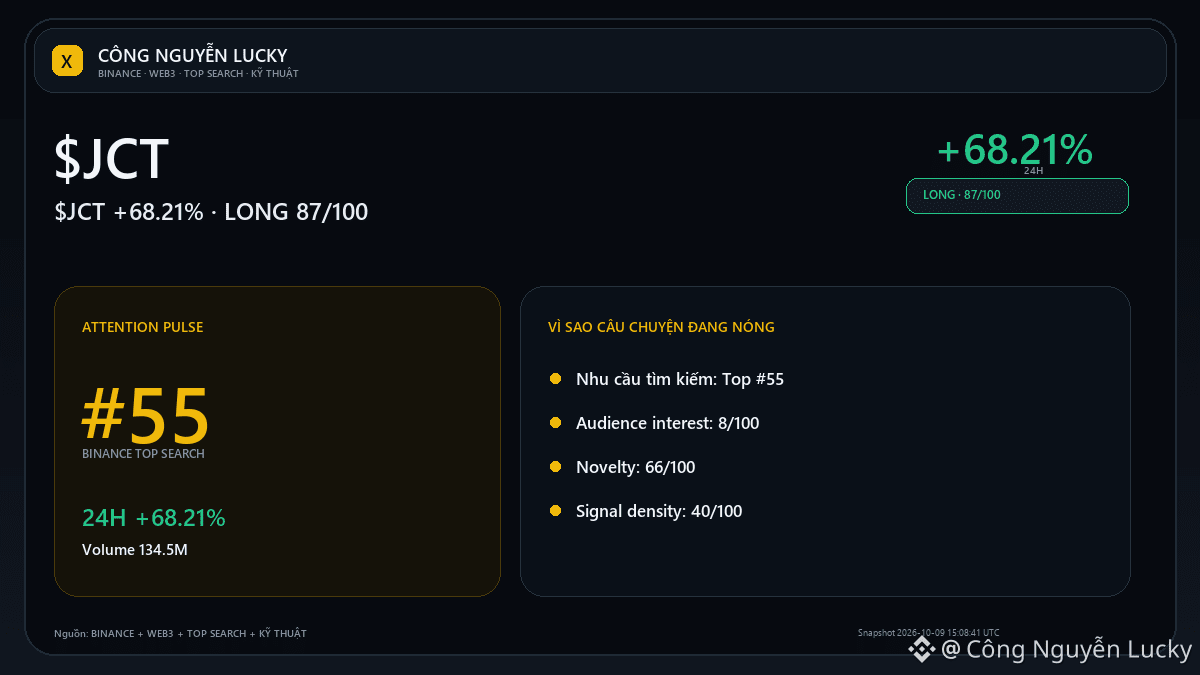
$JCT +68.21%: What data supports this strong rally?📝 Watchlist note — $JCT: No need for a big conclusion yet, but there’s enough data to keep a close eye on it. • 0.002619 · 24h +68.21% · volume ~134.5M USDT · 1,977,722 trades. Condition for increasing conviction: A break above 0.002864 on expanding volume would make the continuation scenario more credible.
What would make me pass: Failing to hold the highs and falling back below the midpoint at 0.002087 would make the cooldown scenario more likely. 🎯 Preferred trend: **LONG · STRONG · 87/100**.
$JCT +68.21%: What data supports this strong rally?
📝 Watchlist note — $JCT : No need for a big conclusion yet, but there’s enough data to keep a close eye on it. • 0.002619 · 24h +68.21% · volume ~134.5M USDT · 1,977,722 trades. Condition for increasing conviction: A break above 0.002864 on expanding volume would make the continuation scenario more credible.
What would make me pass: Failing to hold the highs and falling back below the midpoint at 0.002087 would make the cooldown scenario more likely. 🎯 Preferred trend: **LONG · STRONG · 87/100**.
What would make me pass: Failing to hold the highs and falling back below the midpoint at 0.002087 would make the cooldown scenario more likely. 🎯 Preferred trend: **LONG · STRONG · 87/100**.
33


A 54.9% 30-day rally isn’t enough to shake the market’s grip on fear.
$PUMP is sitting at $0.002287, with a low near $0.002278 and a high near $0.002542.
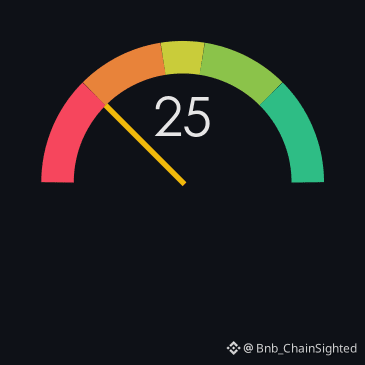
Volume has spiked to over 5.65 billion PUMP, but the fear index remains locked at 25/100 - extreme panic - with no movement in the past 7 days.
That’s a sharp move, but it’s not enough to push the fear index out of its extreme panic zone.
The 30-day gain of 54.9% tells a different story than the 24-hour price action.
It suggests something is moving beneath the surface - maybe accumulation, maybe a shift in sentiment.
But the fear index hasn’t budged. That’s a divergence worth noting.
—
Not financial advice. DYOR.
📌 Fear & Greed · #55 · #FearAndGreed #CryptoSighted $PUMP
A 54.9% 30-day rally isn’t enough to shake the market’s grip on fear.
$PUMP is sitting at $0.002287, with a low near $0.002278 and a high near $0.002542.
Volume has spiked to over 5.65 billion PUMP, but the fear index remains locked at 25/100 - extreme panic - with no movement in the past 7 days.
That’s a sharp move, but it’s not enough to push the fear index out of its extreme panic zone.
The 30-day gain of 54.9% tells a different story than the 24-hour price action.
It suggests something is moving beneath the surface - maybe accumulation, maybe a shift in sentiment.
But the fear index hasn’t budged. That’s a divergence worth noting.
—
Not financial advice. DYOR.
📌 Fear & Greed · #55 · #FearAndGreed #CryptoSighted $PUMP
$PUMP is sitting at $0.002287, with a low near $0.002278 and a high near $0.002542.
Volume has spiked to over 5.65 billion PUMP, but the fear index remains locked at 25/100 - extreme panic - with no movement in the past 7 days.
That’s a sharp move, but it’s not enough to push the fear index out of its extreme panic zone.
The 30-day gain of 54.9% tells a different story than the 24-hour price action.
It suggests something is moving beneath the surface - maybe accumulation, maybe a shift in sentiment.
But the fear index hasn’t budged. That’s a divergence worth noting.
—
Not financial advice. DYOR.
📌 Fear & Greed · #55 · #FearAndGreed #CryptoSighted $PUMP
139

·
--
** How to Detect and Trade Crypto Breakouts Using Volume and Price Action?Ethena (ENAUSDT) is trending right now!
Rank: #55
** 🚀 **First of all, why this topic?** Breakouts occur when the price breaks an important support/resistance level and a strong directional move begins. When analyzed together with volume, fakeouts decrease and the probability of profit increases. 📊 **Data Display (Feb 02, 2026 – CoinMarketCap)** - ****: 77 331,08 USD (‑0,07 % 24s), volume ≈ 27,24 B USD - ****: 2 392,37 USD (‑1,09 % 24s), volume ≈ 14,76 B USD With this data, we’ll make practical examples using two assets that show a slight decline during the day but still have high liquidity. --- ### 📚 Step-by-Step Breakout Strategy | Step | What to do? | Why it matters? | Practical Example (BTC/ETH) | |------|-------------|----------------|------------------------| | **1️⃣ Identify Trend and Resistance/Support** | On the daily or 4-hour chart, mark the most recent high–low points. If there is a higher timeframe trend (uptrend or downtrend), determine resistance (in an uptrend) or support (in a downtrend) levels accordingly. | Trading in line with the trend reduces false signals. | **BTC**: On the 4-hour chart, the 76 800 – 77 500 range has been tested repeatedly over a long period, forming a **resistance**. **ETH**: On the daily chart, the 2 350 – 2 420 band works as support. | | **2️⃣ Add a Volume Filter** | Before a potential breakout level is actually broken, check the volume of the candles approaching that level. **High volume** (over 150% of the average) indicates strong interest. | Low-volume breakouts are often pulled back (fakeout). | **BTC**:
** How to Detect and Trade Crypto Breakouts Using Volume and Price Action?
Ethena (ENAUSDT) is trending right now!
Rank: #55
** 🚀 **First of all, why this topic?** Breakouts occur when the price breaks an important support/resistance level and a strong directional move begins. When analyzed together with volume, fakeouts decrease and the probability of profit increases. 📊 **Data Display (Feb 02, 2026 – CoinMarketCap)** - ****: 77 331,08 USD (‑0,07 % 24s), volume ≈ 27,24 B USD - ****: 2 392,37 USD (‑1,09 % 24s), volume ≈ 14,76 B USD With this data, we’ll make practical examples using two assets that show a slight decline during the day but still have high liquidity. --- ### 📚 Step-by-Step Breakout Strategy | Step | What to do? | Why it matters? | Practical Example (BTC/ETH) | |------|-------------|----------------|------------------------| | **1️⃣ Identify Trend and Resistance/Support** | On the daily or 4-hour chart, mark the most recent high–low points. If there is a higher timeframe trend (uptrend or downtrend), determine resistance (in an uptrend) or support (in a downtrend) levels accordingly. | Trading in line with the trend reduces false signals. | **BTC**: On the 4-hour chart, the 76 800 – 77 500 range has been tested repeatedly over a long period, forming a **resistance**. **ETH**: On the daily chart, the 2 350 – 2 420 band works as support. | | **2️⃣ Add a Volume Filter** | Before a potential breakout level is actually broken, check the volume of the candles approaching that level. **High volume** (over 150% of the average) indicates strong interest. | Low-volume breakouts are often pulled back (fakeout). | **BTC**:
Rank: #55
** 🚀 **First of all, why this topic?** Breakouts occur when the price breaks an important support/resistance level and a strong directional move begins. When analyzed together with volume, fakeouts decrease and the probability of profit increases. 📊 **Data Display (Feb 02, 2026 – CoinMarketCap)** - ****: 77 331,08 USD (‑0,07 % 24s), volume ≈ 27,24 B USD - ****: 2 392,37 USD (‑1,09 % 24s), volume ≈ 14,76 B USD With this data, we’ll make practical examples using two assets that show a slight decline during the day but still have high liquidity. --- ### 📚 Step-by-Step Breakout Strategy | Step | What to do? | Why it matters? | Practical Example (BTC/ETH) | |------|-------------|----------------|------------------------| | **1️⃣ Identify Trend and Resistance/Support** | On the daily or 4-hour chart, mark the most recent high–low points. If there is a higher timeframe trend (uptrend or downtrend), determine resistance (in an uptrend) or support (in a downtrend) levels accordingly. | Trading in line with the trend reduces false signals. | **BTC**: On the 4-hour chart, the 76 800 – 77 500 range has been tested repeatedly over a long period, forming a **resistance**. **ETH**: On the daily chart, the 2 350 – 2 420 band works as support. | | **2️⃣ Add a Volume Filter** | Before a potential breakout level is actually broken, check the volume of the candles approaching that level. **High volume** (over 150% of the average) indicates strong interest. | Low-volume breakouts are often pulled back (fakeout). | **BTC**:
78

·
--
Bitcoin is gearing up for failed breakout attempt #55. $BTC
Bitcoin is gearing up for failed breakout attempt #55. $BTC
11
·
--
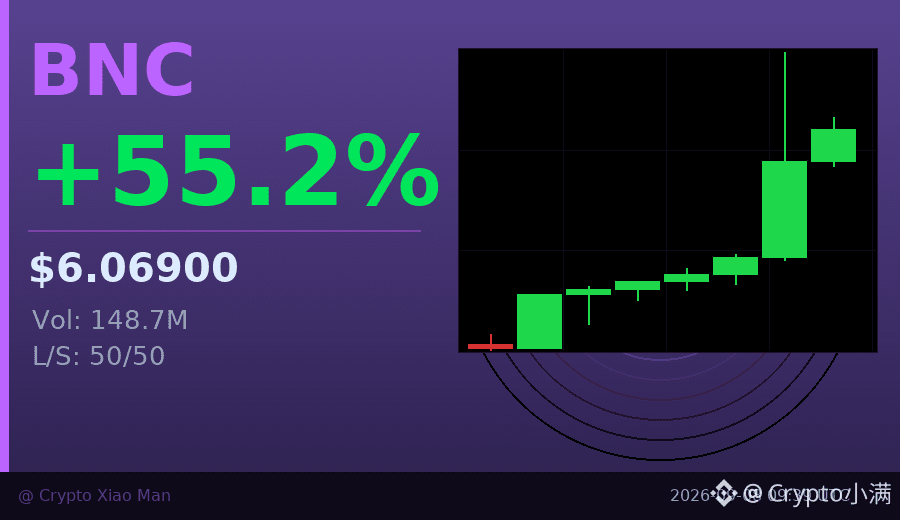
2% funding rate, 55% price increase, but the long/short ratio is still 50/50.
BNC is acting unusually today. Normally, such a sudden surge comes with one-sided long crowding, but this rally looks more like spot capital is driving it rather than leveraged chasing. Three consecutive hourly candles closed green—buyers are genuinely strong.
However, a 2% funding rate is a warning sign—holding costs are rising quickly, and in the short term there may be profit-taking pullbacks. If the price consolidates sideways, the high funding rate may force some leveraged traders to step away.
I’ll watch for acceptance in the 5.7–5.9 range; if it breaks below 5.5, the outlook will weaken in the near term.
$BNC #资金费率警示 #55%
Click the small card below to quickly view the quote👇
2% funding rate, 55% price increase, but the long/short ratio is still 50/50.
BNC is acting unusually today. Normally, such a sudden surge comes with one-sided long crowding, but this rally looks more like spot capital is driving it rather than leveraged chasing. Three consecutive hourly candles closed green—buyers are genuinely strong.
However, a 2% funding rate is a warning sign—holding costs are rising quickly, and in the short term there may be profit-taking pullbacks. If the price consolidates sideways, the high funding rate may force some leveraged traders to step away.
I’ll watch for acceptance in the 5.7–5.9 range; if it breaks below 5.5, the outlook will weaken in the near term.
$BNC #资金费率警示 #55%
Click the small card below to quickly view the quote👇
BNC is acting unusually today. Normally, such a sudden surge comes with one-sided long crowding, but this rally looks more like spot capital is driving it rather than leveraged chasing. Three consecutive hourly candles closed green—buyers are genuinely strong.
However, a 2% funding rate is a warning sign—holding costs are rising quickly, and in the short term there may be profit-taking pullbacks. If the price consolidates sideways, the high funding rate may force some leveraged traders to step away.
I’ll watch for acceptance in the 5.7–5.9 range; if it breaks below 5.5, the outlook will weaken in the near term.
$BNC #资金费率警示 #55%
Click the small card below to quickly view the quote👇
163

·
--
We're always on the lookout for the latest trends in the crypto space, and our community is eager to stay ahead of the curve. According to CoinGecko, some of the trending tokens right now include Pudgy Penguins (PENGU), Biconomy (BICO), and Bitcoin (BTC). We're seeing a mix of established players and newer tokens making waves in the market.
We're taking a closer look at the market cap rankings, and notable tokens like Axie Infinity (AXS), Jupiter (JUP), and Bittensor (TAO) are standing out. Pi Network (PI) is also gaining attention, with its market cap rank at #55. Our community is watching these tokens closely, analyzing their price movements and % changes.
As we continue to monitor the market, we're excited to see which tokens will emerge as leaders 🚀. With the crypto landscape constantly evolving, our community is always looking for the next big opportunity 💡. We're committed to staying informed and up-to-date on the latest trends, and we're looking forward to seeing what the future holds 📈💰.
$BICO, $ALICE, $BTR
We're always on the lookout for the latest trends in the crypto space, and our community is eager to stay ahead of the curve. According to CoinGecko, some of the trending tokens right now include Pudgy Penguins (PENGU), Biconomy (BICO), and Bitcoin (BTC). We're seeing a mix of established players and newer tokens making waves in the market.
We're taking a closer look at the market cap rankings, and notable tokens like Axie Infinity (AXS), Jupiter (JUP), and Bittensor (TAO) are standing out. Pi Network (PI) is also gaining attention, with its market cap rank at #55. Our community is watching these tokens closely, analyzing their price movements and % changes.
As we continue to monitor the market, we're excited to see which tokens will emerge as leaders 🚀. With the crypto landscape constantly evolving, our community is always looking for the next big opportunity 💡. We're committed to staying informed and up-to-date on the latest trends, and we're looking forward to seeing what the future holds 📈💰.
$BICO , $ALICE , $BTR
We're taking a closer look at the market cap rankings, and notable tokens like Axie Infinity (AXS), Jupiter (JUP), and Bittensor (TAO) are standing out. Pi Network (PI) is also gaining attention, with its market cap rank at #55. Our community is watching these tokens closely, analyzing their price movements and % changes.
As we continue to monitor the market, we're excited to see which tokens will emerge as leaders 🚀. With the crypto landscape constantly evolving, our community is always looking for the next big opportunity 💡. We're committed to staying informed and up-to-date on the latest trends, and we're looking forward to seeing what the future holds 📈💰.
$BICO , $ALICE , $BTR
62

·
--

Article
⚡ GPT‑5.5 and $CHIP: An Intelligence Hoarding Under the SnowAt first glance — night and day. OpenAI drops GPT‑5.5 — an AI that writes its own code, searches for proofs, and manages the entire operating system. $CHIP — a token that’s tanked 90%, but is slowly sliding down like a weary fighter who hasn’t thrown in the towel.
But down in the depths, there are a few tough parallels.
⚡ GPT‑5.5 and $CHIP: An Intelligence Hoarding Under the Snow
At first glance — night and day. OpenAI drops GPT‑5.5 — an AI that writes its own code, searches for proofs, and manages the entire operating system. $CHIP — a token that’s tanked 90%, but is slowly sliding down like a weary fighter who hasn’t thrown in the towel.
But down in the depths, there are a few tough parallels.
But down in the depths, there are a few tough parallels.
1
1.5k
What if a coin defies the trend when everyone else is falling?
$ZEC is up ↑3.1% in the last 24 hours, even as the broader market slips ↓0.3%.
That’s not just a beat - it’s a divergence.
The market’s still bleeding, but ZEC is holding its ground.
Its price is trading between $523.72 and $556.53, with a 24-hour gain of ↑2.84%.
Volume is solid - 165,306 ZEC changed hands, and that’s not noise. Something’s keeping it afloat.
—
Not financial advice. DYOR.
📌 Gainers Radar · #55 · #Gainers #CryptoSighted $ZEC
What if a coin defies the trend when everyone else is falling?
$ZEC is up ↑3.1% in the last 24 hours, even as the broader market slips ↓0.3%.
That’s not just a beat - it’s a divergence.
The market’s still bleeding, but ZEC is holding its ground.
Its price is trading between $523.72 and $556.53, with a 24-hour gain of ↑2.84%.
Volume is solid - 165,306 ZEC changed hands, and that’s not noise. Something’s keeping it afloat.
—
Not financial advice. DYOR.
📌 Gainers Radar · #55 · #Gainers #CryptoSighted $ZEC
$ZEC is up ↑3.1% in the last 24 hours, even as the broader market slips ↓0.3%.
That’s not just a beat - it’s a divergence.
The market’s still bleeding, but ZEC is holding its ground.
Its price is trading between $523.72 and $556.53, with a 24-hour gain of ↑2.84%.
Volume is solid - 165,306 ZEC changed hands, and that’s not noise. Something’s keeping it afloat.
—
Not financial advice. DYOR.
📌 Gainers Radar · #55 · #Gainers #CryptoSighted $ZEC
404

·
--
Bullish
60-SECOND ALPHA #55 | $API3
$API3 is a good example of why blockchain applications need reliable data. Its infrastructure is designed to connect smart contracts with real-world APIs while allowing data providers to operate their own oracle infrastructure.
Without reliable external data, many smart contracts simply cannot make meaningful decisions.
The lesson: Sometimes the most important crypto infrastructure is the part users never see.
{future}(API3USDT)
60-SECOND ALPHA #55 | $API3
$API3 is a good example of why blockchain applications need reliable data. Its infrastructure is designed to connect smart contracts with real-world APIs while allowing data providers to operate their own oracle infrastructure.
Without reliable external data, many smart contracts simply cannot make meaningful decisions.
The lesson: Sometimes the most important crypto infrastructure is the part users never see.
$API3 is a good example of why blockchain applications need reliable data. Its infrastructure is designed to connect smart contracts with real-world APIs while allowing data providers to operate their own oracle infrastructure.
Without reliable external data, many smart contracts simply cannot make meaningful decisions.
The lesson: Sometimes the most important crypto infrastructure is the part users never see.

101

·
--
🏆 FLIPPENING
💰 Ethereum just flipped Procter & Gamble!
$ETH $334.49B · now #55 of all assets
Passed Procter & Gamble ($334.22B)
🍳 Crypto vs the whole world. Not financial advice.
#CookingBNB #Crypto #Bitcoin #BTC
🏆 FLIPPENING
💰 Ethereum just flipped Procter & Gamble!
$ETH $334.49B · now #55 of all assets
Passed Procter & Gamble ($334.22B)
🍳 Crypto vs the whole world. Not financial advice.
#CookingBNB #Crypto #Bitcoin #BTC
💰 Ethereum just flipped Procter & Gamble!
$ETH $334.49B · now #55 of all assets
Passed Procter & Gamble ($334.22B)
🍳 Crypto vs the whole world. Not financial advice.
#CookingBNB #Crypto #Bitcoin #BTC

7

·
--
We're excited to share the latest trending tokens with our community. According to CoinGecko, top tokens include Taiko (TAIKO) and Venice Token (VVV) 🚀.
We're seeing significant market cap rankings, with Morpho (MORPHO) at #55 and Aave (AAVE) at #58, while Pudgy Penguins (PENGU) and Jupiter (JUP) rank #118 and #79 respectively. The Black Bull (ANSEM) is also trending at #427.
We're monitoring these tokens closely, as they show potential for growth. With their current market cap rankings, we're expecting to see some interesting developments 📈. Our community is eager to see how these tokens will perform in the coming days 🔜. We're looking forward to sharing more updates and insights on these trending tokens 💡.
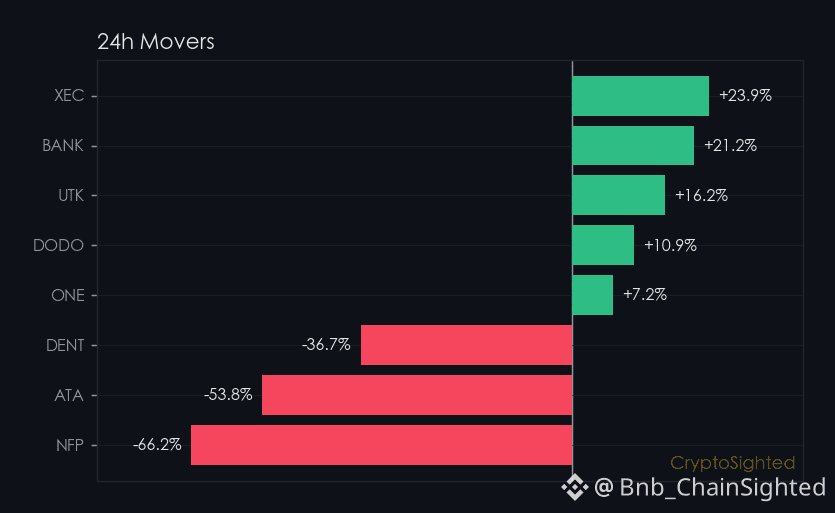
$NFP, $ZBT, $NFP
We're excited to share the latest trending tokens with our community. According to CoinGecko, top tokens include Taiko (TAIKO) and Venice Token (VVV) 🚀.
We're seeing significant market cap rankings, with Morpho (MORPHO) at #55 and Aave (AAVE) at #58, while Pudgy Penguins (PENGU) and Jupiter (JUP) rank #118 and #79 respectively. The Black Bull (ANSEM) is also trending at #427.
We're monitoring these tokens closely, as they show potential for growth. With their current market cap rankings, we're expecting to see some interesting developments 📈. Our community is eager to see how these tokens will perform in the coming days 🔜. We're looking forward to sharing more updates and insights on these trending tokens 💡.
$NFP, $ZBT , $NFP
We're seeing significant market cap rankings, with Morpho (MORPHO) at #55 and Aave (AAVE) at #58, while Pudgy Penguins (PENGU) and Jupiter (JUP) rank #118 and #79 respectively. The Black Bull (ANSEM) is also trending at #427.
We're monitoring these tokens closely, as they show potential for growth. With their current market cap rankings, we're expecting to see some interesting developments 📈. Our community is eager to see how these tokens will perform in the coming days 🔜. We're looking forward to sharing more updates and insights on these trending tokens 💡.
$NFP, $ZBT , $NFP
85
The biggest gainer in the past 24 hours isn’t $BTC — it’s $ADA.
ADA surged by ↑7.00% in a single day, outpacing BTC’s ↑2.68% and $ETH’s ↑2.79%. That’s not just a number — it’s a signal.
Think of it like a stock in a sector that’s been ignored for months, only to suddenly outperform the S&P 500. ADA is behaving like that — quietly gaining traction while the broader crypto market moves at a slower pace.
This kind of divergence doesn’t happen by accident. It suggests something is shifting underneath the surface.
Where do you see this kind of strength coming from?
—
Not financial advice. Crypto assets are high-risk; do your own research.
📌 Hotspot Watch · #55
#CryptoTrends $BTC $ADA
The biggest gainer in the past 24 hours isn’t $BTC — it’s $ADA .
ADA surged by ↑7.00% in a single day, outpacing BTC’s ↑2.68% and $ETH ’s ↑2.79%. That’s not just a number — it’s a signal.
Think of it like a stock in a sector that’s been ignored for months, only to suddenly outperform the S&P 500. ADA is behaving like that — quietly gaining traction while the broader crypto market moves at a slower pace.
This kind of divergence doesn’t happen by accident. It suggests something is shifting underneath the surface.
Where do you see this kind of strength coming from?
—
Not financial advice. Crypto assets are high-risk; do your own research.
📌 Hotspot Watch · #55
#CryptoTrends $BTC $ADA
ADA surged by ↑7.00% in a single day, outpacing BTC’s ↑2.68% and $ETH ’s ↑2.79%. That’s not just a number — it’s a signal.
Think of it like a stock in a sector that’s been ignored for months, only to suddenly outperform the S&P 500. ADA is behaving like that — quietly gaining traction while the broader crypto market moves at a slower pace.
This kind of divergence doesn’t happen by accident. It suggests something is shifting underneath the surface.
Where do you see this kind of strength coming from?
—
Not financial advice. Crypto assets are high-risk; do your own research.
📌 Hotspot Watch · #55
#CryptoTrends $BTC $ADA
44
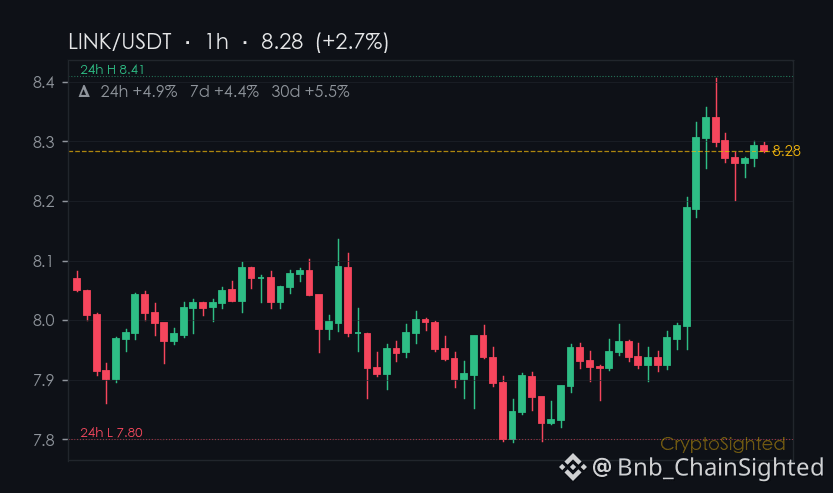
$LINK climbed 5% on the 24-hour chart, yet its funding rate remains locked at ↑0.0100%-a rare alignment where price gains don’t force crowded longs to pay a premium.
This one made me look twice.
The move isn’t just a flash in the pan. Over the past 7 days, LINK has climbed 4.4%, and over 30 days, it’s gained 5.5%.
That’s a steady climb, not a sprint. But here’s the thing: the funding rate, which is a measure of the cost of holding long positions, hasn’t budged.
That’s not typical. Usually, when price rises, especially with volume, the funding rate spikes as longs pay a premium.
Not here.
Take a look at the on-chain data. LINK’s perpetual contract open interest stands at 8.64 million tokens, valued around $72 million.
That’s a decent amount of capital on the table, but the funding rate is still balanced.
That suggests the leverage isn’t skewed toward one side.
Longs aren’t paying a premium, and shorts aren’t squeezing.
It’s a tightrope walk, but the market seems to be holding its breath.
This isn’t the first time we’ve seen this kind of divergence.
$ETH and $ZEC both saw sharp moves with no clear catalysts, and now LINK is following the same pattern.
It’s not a coincidence. It’s a signal that something is shifting under the surface.
The market is moving, but the leverage isn’t chasing it-yet.
—
📊 13 directional calls in the last 30d, every one auto-settled against price. Direction only — no buy/sell calls.
Not financial advice. DYOR.
📌 Funding Pulse · #55 · #FundingRate #CryptoSighted $LINK
$LINK climbed 5% on the 24-hour chart, yet its funding rate remains locked at ↑0.0100%-a rare alignment where price gains don’t force crowded longs to pay a premium.
This one made me look twice.
The move isn’t just a flash in the pan. Over the past 7 days, LINK has climbed 4.4%, and over 30 days, it’s gained 5.5%.
That’s a steady climb, not a sprint. But here’s the thing: the funding rate, which is a measure of the cost of holding long positions, hasn’t budged.
That’s not typical. Usually, when price rises, especially with volume, the funding rate spikes as longs pay a premium.
Not here.
Take a look at the on-chain data. LINK’s perpetual contract open interest stands at 8.64 million tokens, valued around $72 million.
That’s a decent amount of capital on the table, but the funding rate is still balanced.
That suggests the leverage isn’t skewed toward one side.
Longs aren’t paying a premium, and shorts aren’t squeezing.
It’s a tightrope walk, but the market seems to be holding its breath.
This isn’t the first time we’ve seen this kind of divergence.
$ETH and $ZEC both saw sharp moves with no clear catalysts, and now LINK is following the same pattern.
It’s not a coincidence. It’s a signal that something is shifting under the surface.
The market is moving, but the leverage isn’t chasing it-yet.
—
📊 13 directional calls in the last 30d, every one auto-settled against price. Direction only — no buy/sell calls.
Not financial advice. DYOR.
📌 Funding Pulse · #55 · #FundingRate #CryptoSighted $LINK
This one made me look twice.
The move isn’t just a flash in the pan. Over the past 7 days, LINK has climbed 4.4%, and over 30 days, it’s gained 5.5%.
That’s a steady climb, not a sprint. But here’s the thing: the funding rate, which is a measure of the cost of holding long positions, hasn’t budged.
That’s not typical. Usually, when price rises, especially with volume, the funding rate spikes as longs pay a premium.
Not here.
Take a look at the on-chain data. LINK’s perpetual contract open interest stands at 8.64 million tokens, valued around $72 million.
That’s a decent amount of capital on the table, but the funding rate is still balanced.
That suggests the leverage isn’t skewed toward one side.
Longs aren’t paying a premium, and shorts aren’t squeezing.
It’s a tightrope walk, but the market seems to be holding its breath.
This isn’t the first time we’ve seen this kind of divergence.
$ETH and $ZEC both saw sharp moves with no clear catalysts, and now LINK is following the same pattern.
It’s not a coincidence. It’s a signal that something is shifting under the surface.
The market is moving, but the leverage isn’t chasing it-yet.
—
📊 13 directional calls in the last 30d, every one auto-settled against price. Direction only — no buy/sell calls.
Not financial advice. DYOR.
📌 Funding Pulse · #55 · #FundingRate #CryptoSighted $LINK
371
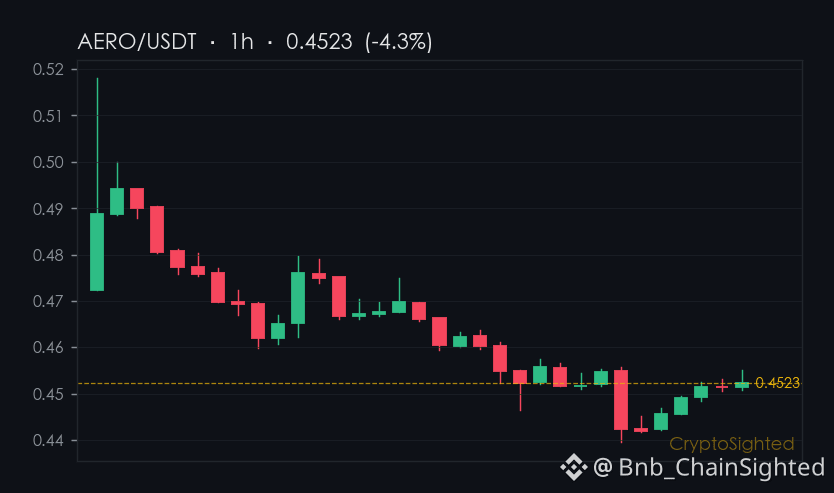
$AERO’s inclusion on Binance across multiple products lines up with a broader trend: institutional interest in tokenized assets is growing, even as regulators take a harder stance on certain platforms.
France’s move to block Polymarket shows the tightening grip regulators are applying, especially in Europe.
But at the same time, Binance is expanding AERO’s use - adding it to Earn, Buy Crypto, Convert, VIP Loan, and Margin.
That’s not just product diversification; it’s a signal that tokenized assets are gaining traction in institutional portfolios.
—
Not financial advice. DYOR.
📌 News Take · #55 · #CryptoNews #CryptoSighted $AERO
$AERO ’s inclusion on Binance across multiple products lines up with a broader trend: institutional interest in tokenized assets is growing, even as regulators take a harder stance on certain platforms.
France’s move to block Polymarket shows the tightening grip regulators are applying, especially in Europe.
But at the same time, Binance is expanding AERO’s use - adding it to Earn, Buy Crypto, Convert, VIP Loan, and Margin.
That’s not just product diversification; it’s a signal that tokenized assets are gaining traction in institutional portfolios.
—
Not financial advice. DYOR.
📌 News Take · #55 · #CryptoNews #CryptoSighted $AERO
France’s move to block Polymarket shows the tightening grip regulators are applying, especially in Europe.
But at the same time, Binance is expanding AERO’s use - adding it to Earn, Buy Crypto, Convert, VIP Loan, and Margin.
That’s not just product diversification; it’s a signal that tokenized assets are gaining traction in institutional portfolios.
—
Not financial advice. DYOR.
📌 News Take · #55 · #CryptoNews #CryptoSighted $AERO
278
Log in to explore more content
Join global crypto users on Binance Square
⚡️ Get latest and useful information about crypto.
💬 Trusted by the world’s largest crypto exchange.
👍 Discover real insights from verified creators.
Email / Phone number
Trending Topics
1
#HotCPIDecemberHikePriced
51,540 views
816 Discussing
2
#AnthropicRejectsIPODelayValuationinQuestion
186,326 views
1,634 Discussing
3
#NvidiaInvestigatesAfterHuang’sAffairApology
462,152 views
3,084 Discussing
4
#CanNvidiaEarningsEaseMarketConcerns?
25,464 views
439 Discussing
5
#ADPWeeklyEstimateShowsUSPrivatePayrollsUp19750
10,610 views
221 Discussing
6
#US-IranTalksFuelStrongStockMarketRebound
111,298 views
574 Discussing
7
#BitcoinFiveWeeklyLosses
479,858 views
3,223 Discussing
8
#AIChipSlumpNasdaq
261,494 views
1,806 Discussing
9
#BitcoinSpotETFsPost$201MNetOutflowForThirdStraightDay
1,750 views
30 Discussing
10
#CryptoLiquidationsReach$1.16BIn24Hours
67,579 views
84 Discussing