

#20
20
145,053 views
222 Discussing
Hot
Latest

·
--
$FRAG This one was posted by the project team themselves: in the group, the points that can be discussed are very clear—this isn’t just shouting slogans; it’s the Week 20 buyback.
The verifiable wording comes from Fragmetric’s official statement: “Weekly Buyback #20, 411,069 $FRAG was purchased on the open market and transferred to the FRAG Treasury Wallet.”
In plain language, it means: the project used the protocol fees from that period to buy 411,069 $FRAG on the open market, then transferred them into the Treasury Wallet.
The most interesting part of this isn’t the words “purchased” or “buy”—it’s the extra sentence: “Backed by 100% of protocol fees during the period.”
So the buyback funding for this cycle is anchored to “100% of protocol fees during the period.” The community will therefore focus on two things: whether the protocol actually continues to generate revenue, and whether those revenues are still used for buybacks into treasury.
For retail sentiment, this kind of weekly buyback is more like giving the community a fixed checkpoint.
How the price moves is another matter, but at least this time the on-chain gossip has concrete numbers: 411,069 $FRAG, purchased on the open market, and sent to the Treasury Wallet.
Next, we’ll see whether Fragmetric can keep turning “Weekly Buyback” into an ongoing series.
$FRAG #链上吃瓜 #Retail sentiment
Generated with Claude Fable 5. AI may be inaccurate; information is for reference only.
$FRAG This one was posted by the project team themselves: in the group, the points that can be discussed are very clear—this isn’t just shouting slogans; it’s the Week 20 buyback.
The verifiable wording comes from Fragmetric’s official statement: “Weekly Buyback #20, 411,069 $FRAG was purchased on the open market and transferred to the FRAG Treasury Wallet.”
In plain language, it means: the project used the protocol fees from that period to buy 411,069 $FRAG on the open market, then transferred them into the Treasury Wallet.
The most interesting part of this isn’t the words “purchased” or “buy”—it’s the extra sentence: “Backed by 100% of protocol fees during the period.”
So the buyback funding for this cycle is anchored to “100% of protocol fees during the period.” The community will therefore focus on two things: whether the protocol actually continues to generate revenue, and whether those revenues are still used for buybacks into treasury.
For retail sentiment, this kind of weekly buyback is more like giving the community a fixed checkpoint.
How the price moves is another matter, but at least this time the on-chain gossip has concrete numbers: 411,069 $FRAG, purchased on the open market, and sent to the Treasury Wallet.
Next, we’ll see whether Fragmetric can keep turning “Weekly Buyback” into an ongoing series.
$FRAG #链上吃瓜 #Retail sentiment
Generated with Claude Fable 5. AI may be inaccurate; information is for reference only.
The verifiable wording comes from Fragmetric’s official statement: “Weekly Buyback #20, 411,069 $FRAG was purchased on the open market and transferred to the FRAG Treasury Wallet.”
In plain language, it means: the project used the protocol fees from that period to buy 411,069 $FRAG on the open market, then transferred them into the Treasury Wallet.
The most interesting part of this isn’t the words “purchased” or “buy”—it’s the extra sentence: “Backed by 100% of protocol fees during the period.”
So the buyback funding for this cycle is anchored to “100% of protocol fees during the period.” The community will therefore focus on two things: whether the protocol actually continues to generate revenue, and whether those revenues are still used for buybacks into treasury.
For retail sentiment, this kind of weekly buyback is more like giving the community a fixed checkpoint.
How the price moves is another matter, but at least this time the on-chain gossip has concrete numbers: 411,069 $FRAG, purchased on the open market, and sent to the Treasury Wallet.
Next, we’ll see whether Fragmetric can keep turning “Weekly Buyback” into an ongoing series.
$FRAG #链上吃瓜 #Retail sentiment
Generated with Claude Fable 5. AI may be inaccurate; information is for reference only.

33

Article
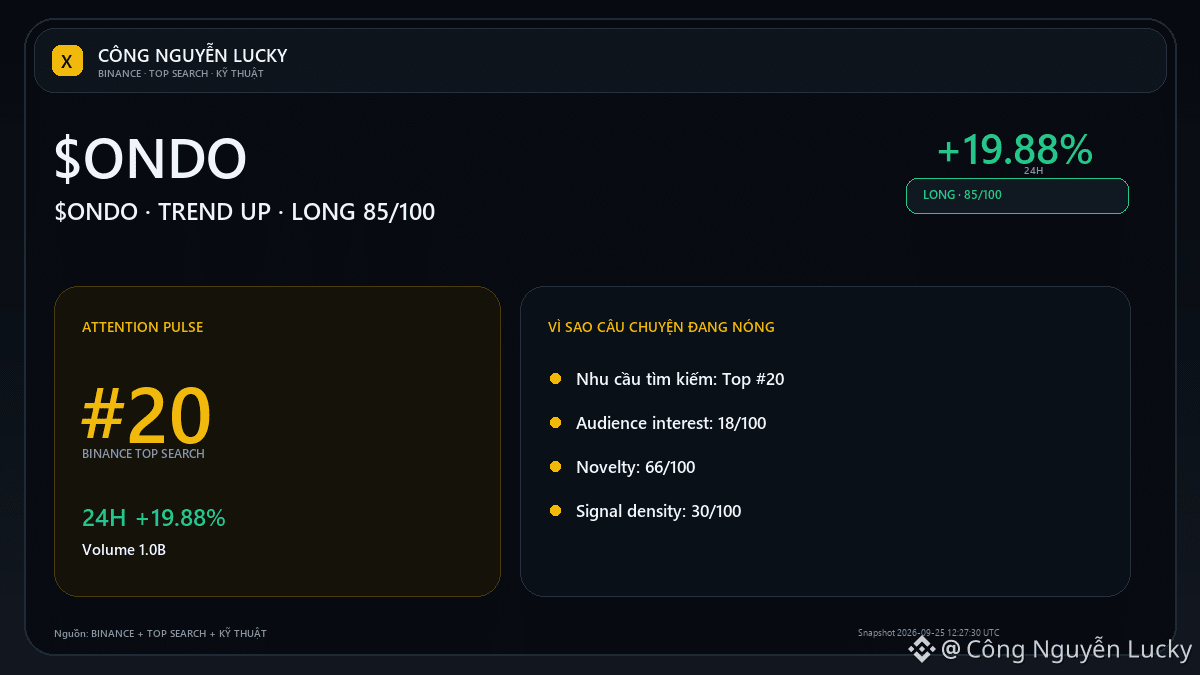
$ONDO · TREND UP: real breakout or just 24h fluctuation?📝 Watchlist note — $ONDO: no need for a big conclusion yet, but there is enough data to track closely. • 0.5434 · 24h +19.88% · volume ~1,034.8M USDT · 4,372,721 transactions. Conditions to raise conviction: Break above 0.5793 with expanded volume will make the continuation scenario more convincing.
What made me ignore it: Failing to hold the high zone and dropping back below the midpoint 0.514 will make the cooling-off scenario clearer. 🎯 Preferred trend: **LONG · STRONG · 85/100**.
$ONDO · TREND UP: real breakout or just 24h fluctuation?
📝 Watchlist note — $ONDO : no need for a big conclusion yet, but there is enough data to track closely. • 0.5434 · 24h +19.88% · volume ~1,034.8M USDT · 4,372,721 transactions. Conditions to raise conviction: Break above 0.5793 with expanded volume will make the continuation scenario more convincing.
What made me ignore it: Failing to hold the high zone and dropping back below the midpoint 0.514 will make the cooling-off scenario clearer. 🎯 Preferred trend: **LONG · STRONG · 85/100**.
What made me ignore it: Failing to hold the high zone and dropping back below the midpoint 0.514 will make the cooling-off scenario clearer. 🎯 Preferred trend: **LONG · STRONG · 85/100**.
10

·
--
$GRASS This move is a bit too sudden—on the 15m chart it just went straight up, +2.35% right away. Volume has surged to nearly 4 times, and the closing price also pushed through the upper limit of the past ~20 of the 5m candles.
What’s interesting is that OI is actually falling—both on the 15m and 1h it’s decreasing. Combined with the funding rate hovering in the recent high percentile, this structure doesn’t look like fresh longs are entering. It looks more like shorts are being forced to cover. The active buy/sell ratio is 1.29—slightly buy-side—but whether it has staying power still depends on whether the covering completes and whether there’s someone left to take the other side.
This pool has an abnormality ranking at #20. It’s been popping up for several consecutive cycles—keep an eye on it first, don’t chase the price.
$GRASS This move is a bit too sudden—on the 15m chart it just went straight up, +2.35% right away. Volume has surged to nearly 4 times, and the closing price also pushed through the upper limit of the past ~20 of the 5m candles.
What’s interesting is that OI is actually falling—both on the 15m and 1h it’s decreasing. Combined with the funding rate hovering in the recent high percentile, this structure doesn’t look like fresh longs are entering. It looks more like shorts are being forced to cover. The active buy/sell ratio is 1.29—slightly buy-side—but whether it has staying power still depends on whether the covering completes and whether there’s someone left to take the other side.
This pool has an abnormality ranking at #20. It’s been popping up for several consecutive cycles—keep an eye on it first, don’t chase the price.
What’s interesting is that OI is actually falling—both on the 15m and 1h it’s decreasing. Combined with the funding rate hovering in the recent high percentile, this structure doesn’t look like fresh longs are entering. It looks more like shorts are being forced to cover. The active buy/sell ratio is 1.29—slightly buy-side—but whether it has staying power still depends on whether the covering completes and whether there’s someone left to take the other side.
This pool has an abnormality ranking at #20. It’s been popping up for several consecutive cycles—keep an eye on it first, don’t chase the price.
26

·
--
ZAMA This drop isn’t too aggressive, but the structure is quite interesting. The 15m price fell 0.89%, volume expanded to 1.59x, and price directly broke below the lower boundary of the last ~20 5m candles. The key is that OI is also declining: the 15m contract is -0.29% and 1h is -0.04%, with nominal changes all negative. This doesn’t look like new shorts rushing in to smash the market—it looks more like longs de-leveraging, taking stop losses, or actively shrinking positions.
The主动成交 difference (aggressive trade imbalance) is -15.1%, buy/sell ratio is 0.74. There is selling pressure, but not to the level of panic. Funding rate is still in a high percentile recently, suggesting longs were fairly crowded before. So this pullback seems more like clearing up floating positions.
Abnormal percentile across the whole pool is 70.4%, abnormal rank #20, nominal change rank #36. It’s not the most extreme tier, but considering that the trading volume is higher than normal, price has touched the edge of the range, and aggressive trading is skewed toward the sell side, the short-term directional choice is already fairly clear. 24h turnover is 34.62M; liquidity is decent—not like there’s nobody to take the other side.
My take: this combination of a selloff plus OI declining usually isn’t a signal of a trend reversal. It’s more like a short-term imbalance after passive reduction by longs. If OI keeps falling and price stabilizes, it could be a good observation point; but if OI rises again while price continues to drop, then you’d need to watch out for new shorts entering. $ZAMA
ZAMA This drop isn’t too aggressive, but the structure is quite interesting. The 15m price fell 0.89%, volume expanded to 1.59x, and price directly broke below the lower boundary of the last ~20 5m candles. The key is that OI is also declining: the 15m contract is -0.29% and 1h is -0.04%, with nominal changes all negative. This doesn’t look like new shorts rushing in to smash the market—it looks more like longs de-leveraging, taking stop losses, or actively shrinking positions.
The主动成交 difference (aggressive trade imbalance) is -15.1%, buy/sell ratio is 0.74. There is selling pressure, but not to the level of panic. Funding rate is still in a high percentile recently, suggesting longs were fairly crowded before. So this pullback seems more like clearing up floating positions.
Abnormal percentile across the whole pool is 70.4%, abnormal rank #20, nominal change rank #36. It’s not the most extreme tier, but considering that the trading volume is higher than normal, price has touched the edge of the range, and aggressive trading is skewed toward the sell side, the short-term directional choice is already fairly clear. 24h turnover is 34.62M; liquidity is decent—not like there’s nobody to take the other side.
My take: this combination of a selloff plus OI declining usually isn’t a signal of a trend reversal. It’s more like a short-term imbalance after passive reduction by longs. If OI keeps falling and price stabilizes, it could be a good observation point; but if OI rises again while price continues to drop, then you’d need to watch out for new shorts entering. $ZAMA
The主动成交 difference (aggressive trade imbalance) is -15.1%, buy/sell ratio is 0.74. There is selling pressure, but not to the level of panic. Funding rate is still in a high percentile recently, suggesting longs were fairly crowded before. So this pullback seems more like clearing up floating positions.
Abnormal percentile across the whole pool is 70.4%, abnormal rank #20, nominal change rank #36. It’s not the most extreme tier, but considering that the trading volume is higher than normal, price has touched the edge of the range, and aggressive trading is skewed toward the sell side, the short-term directional choice is already fairly clear. 24h turnover is 34.62M; liquidity is decent—not like there’s nobody to take the other side.
My take: this combination of a selloff plus OI declining usually isn’t a signal of a trend reversal. It’s more like a short-term imbalance after passive reduction by longs. If OI keeps falling and price stabilizes, it could be a good observation point; but if OI rises again while price continues to drop, then you’d need to watch out for new shorts entering. $ZAMA
9

·
--
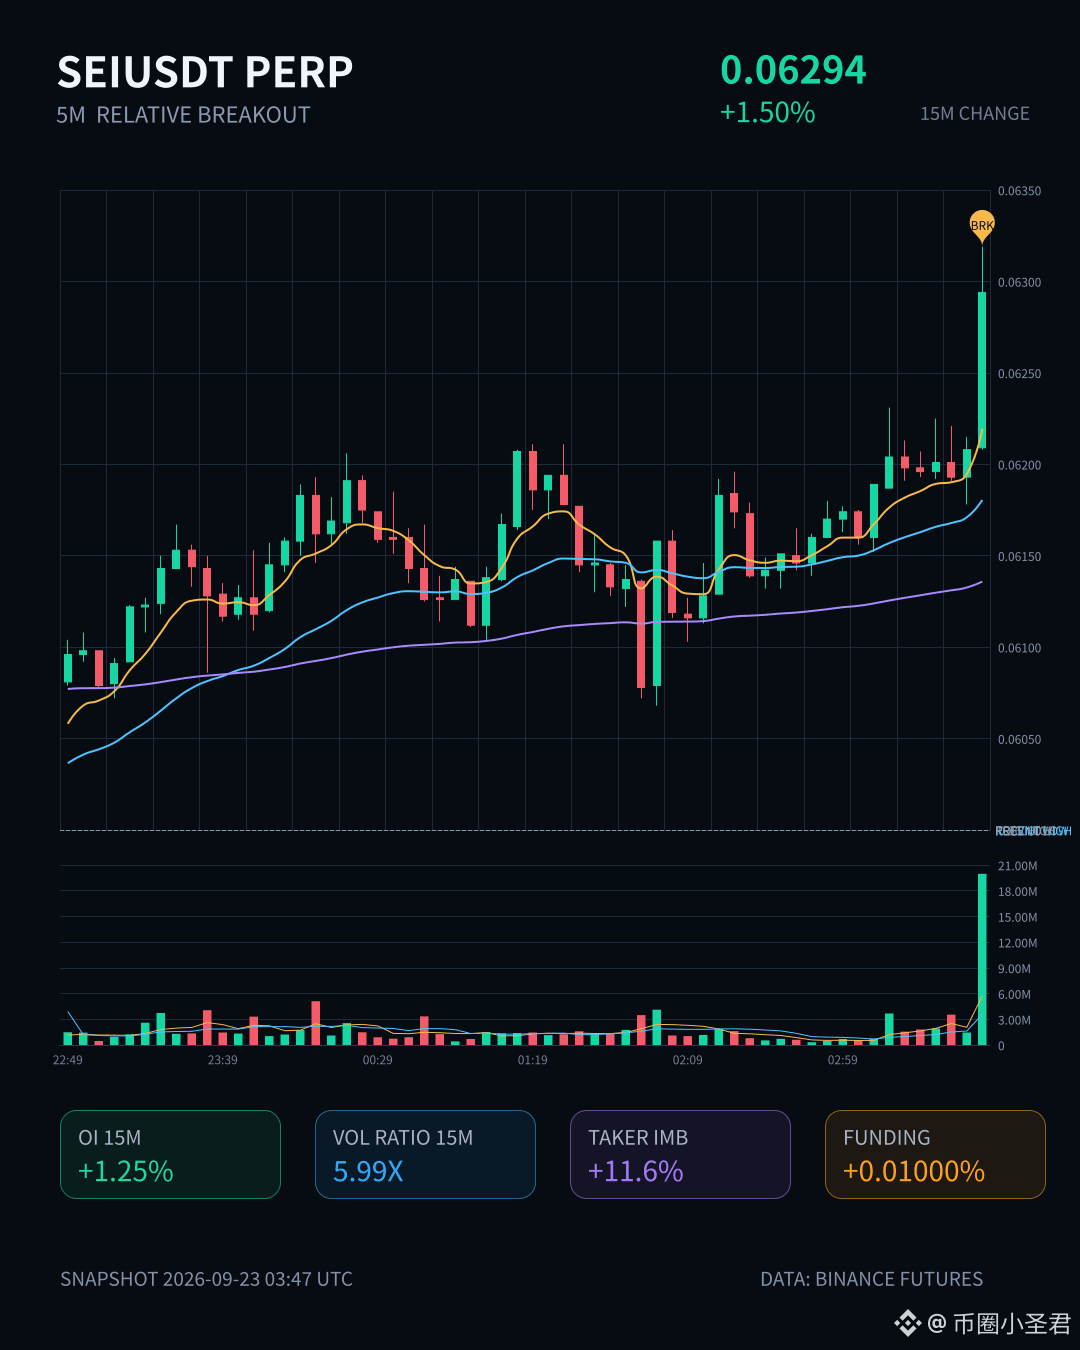
$SEI 15m Suddenly the volume surged 6x; the price broke above the upper edge of nearly 20 of the 5m candles. Aggressive buy orders gap +11.6%, buy/sell ratio 1.26. OI (1h) +1.93%, nominal +629K, abnormal percentile 92.7%, the whole pool ranks at #20. Price and OI moving together suggests new long positions are driving it—not short covering. With this kind of volume spike, first see whether it can hold the upper boundary of the range.
$SEI 15m Suddenly the volume surged 6x; the price broke above the upper edge of nearly 20 of the 5m candles. Aggressive buy orders gap +11.6%, buy/sell ratio 1.26. OI (1h) +1.93%, nominal +629K, abnormal percentile 92.7%, the whole pool ranks at #20. Price and OI moving together suggests new long positions are driving it—not short covering. With this kind of volume spike, first see whether it can hold the upper boundary of the range.
15

$XLM (Stellar) update: Currently trading at $0.21239, +2% in the last 24 hours, and +12% over the past 7 days. Today's trading range was $0.20607 to $0.219762. Market cap stands at $7417742552, ranking #20 globally, with a 24h market cap change of 2%. Fully diluted valuation: $10617818877. 24h trading volume: $479499645. All-time high: $0.875563 (-76% from peak, reached 2018-01-02T16:00:00.000Z); all-time low: $0.00047612 (reached 2015-03-04T16:00:00.000Z). Circulating supply: 34931880664.95415 XLM, total supply: 50001786839.70148 XLM. Last updated 2026-09-22T09:47:10.000Z. (CoinGecko data, informational only) #XLM #Crypto #Altcoins
$XLM (Stellar) update: Currently trading at $0.21239, +2% in the last 24 hours, and +12% over the past 7 days. Today's trading range was $0.20607 to $0.219762. Market cap stands at $7417742552, ranking #20 globally, with a 24h market cap change of 2%. Fully diluted valuation: $10617818877. 24h trading volume: $479499645. All-time high: $0.875563 (-76% from peak, reached 2018-01-02T16:00:00.000Z); all-time low: $0.00047612 (reached 2015-03-04T16:00:00.000Z). Circulating supply: 34931880664.95415 XLM, total supply: 50001786839.70148 XLM. Last updated 2026-09-22T09:47:10.000Z. (CoinGecko data, informational only) #XLM #Crypto #Altcoins
31
Article
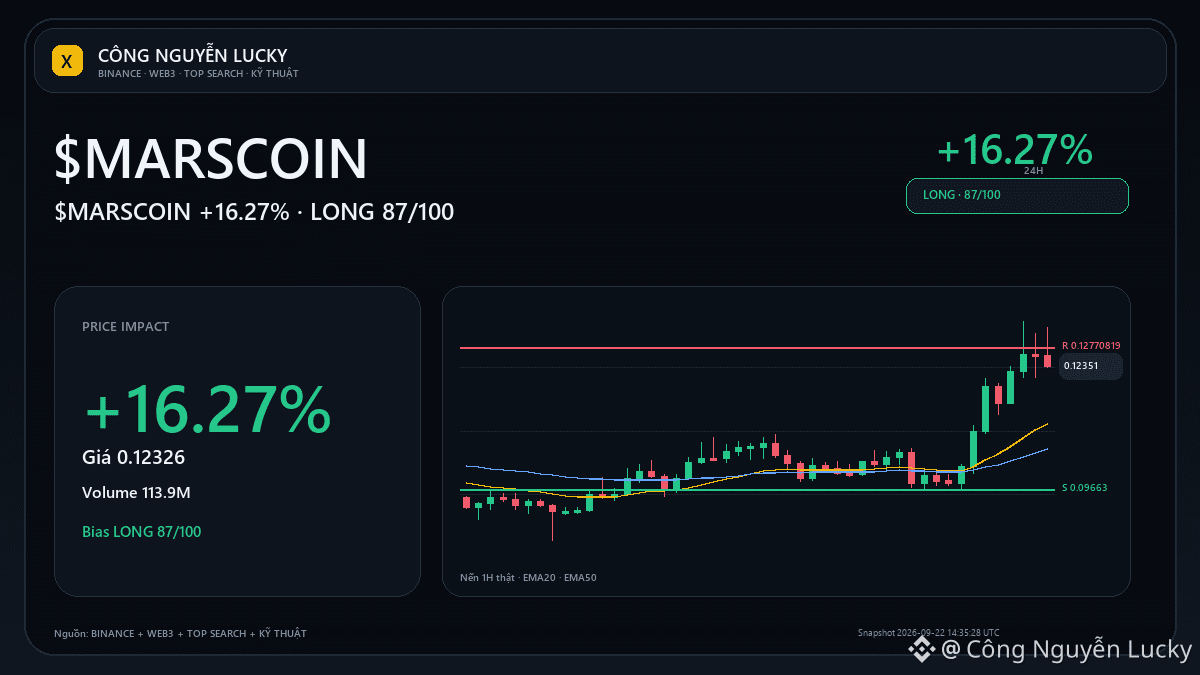
$MARSCOIN: Fib 0.236 is the trend-testing zone$MARSCOIN has a notable signal — but which data really decides the next move? Market: 0.12326 · 24h +16.27% · volume ~113.9M USDT · 1,501,020 trades.
Technical context: MIXED · bias NEUTRAL 45/100.
Golden zone 0.50–0.618: 0.10380836–0.10947. Confirmation points: price reacts in the right direction in the Fib zone and maintains the dominant structure/EMA.
Invalidation point: break 0.12770819 with momentum going against the bias. The technical layers are being selected according to the current regime:
$MARSCOIN: Fib 0.236 is the trend-testing zone
$MARSCOIN has a notable signal — but which data really decides the next move? Market: 0.12326 · 24h +16.27% · volume ~113.9M USDT · 1,501,020 trades.
Technical context: MIXED · bias NEUTRAL 45/100.
Golden zone 0.50–0.618: 0.10380836–0.10947. Confirmation points: price reacts in the right direction in the Fib zone and maintains the dominant structure/EMA.
Invalidation point: break 0.12770819 with momentum going against the bias. The technical layers are being selected according to the current regime:
Technical context: MIXED · bias NEUTRAL 45/100.
Golden zone 0.50–0.618: 0.10380836–0.10947. Confirmation points: price reacts in the right direction in the Fib zone and maintains the dominant structure/EMA.
Invalidation point: break 0.12770819 with momentum going against the bias. The technical layers are being selected according to the current regime:
76
·
--
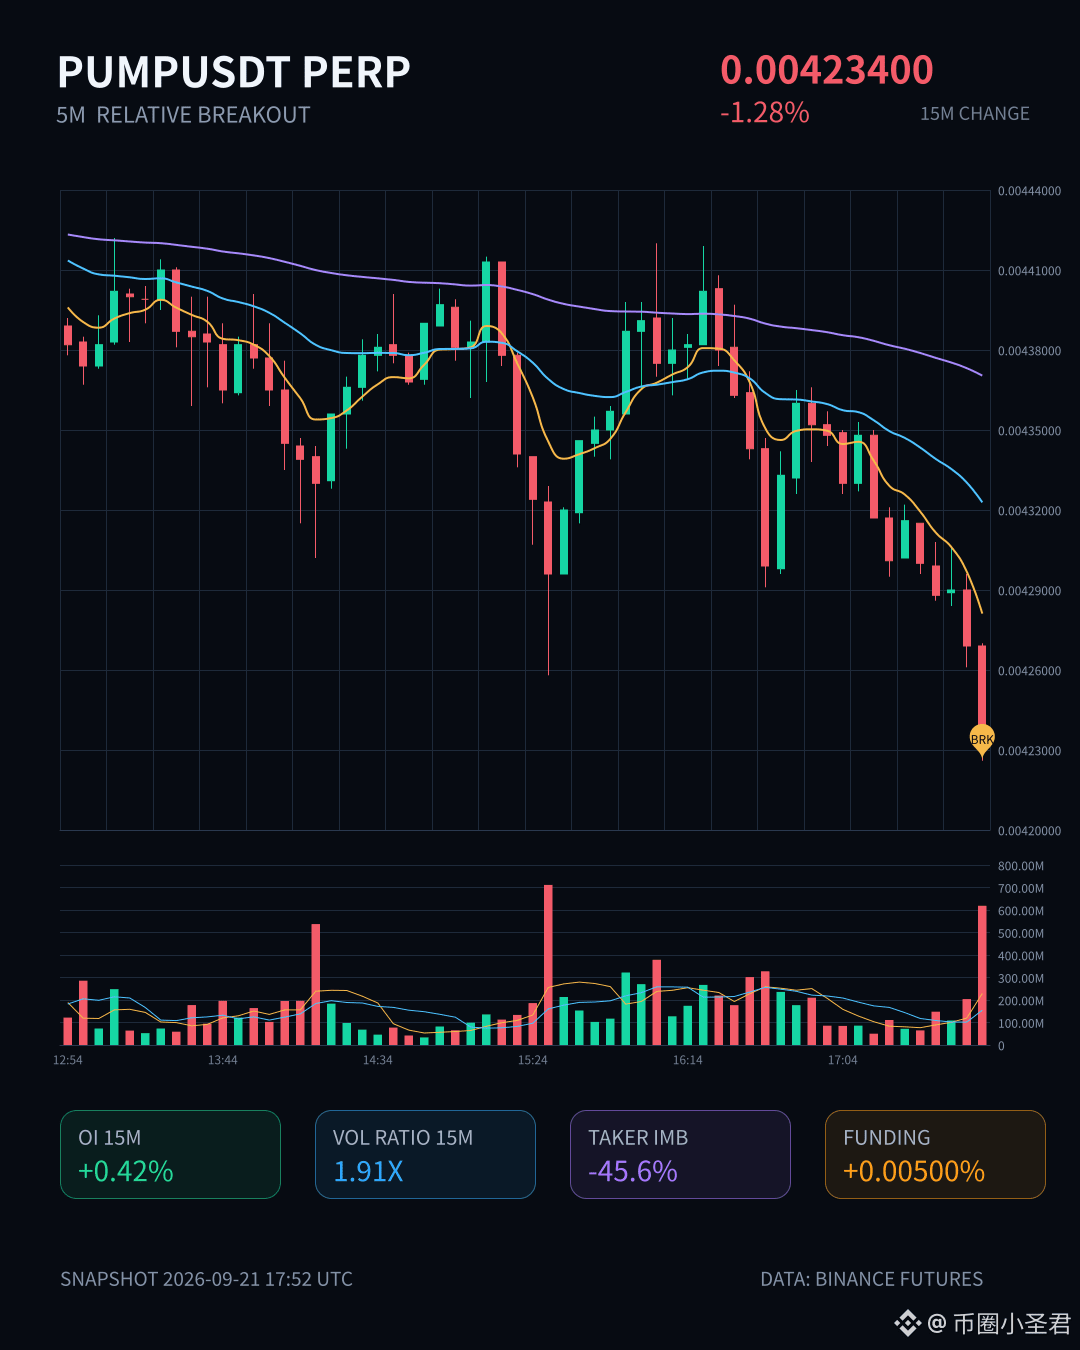
$PUMP This 15m move was pretty decisive—the volume directly hit 1.91x, and the price broke through the near-20 5m lower bound; the active buy/sell ratio is 0.37, and the sell pressure really is coming out.
But what’s interesting is that OI didn’t drop—1h is +0.36%, and the notional even recovered by -1.95M. This combination looks more like the kind of "new leveraged short entry" I mentioned earlier, not a long-covering sell-off. The funding rate is still in a high percentile recently, which suggests the shorts are genuinely willing to pay the cost this time.
The overall pool’s notional change ranks #20, with an abnormal percentile of 68.5%; the heat is mid-to-high—not the kind of pure noise. What I’m watching is whether the funding rate keeps pushing higher—if it stays elevated and the price continues to go down, there’s likely another wave. On the other hand, if the funding rate turns down, then be careful about short covering.
24h turnover is 168M; the depth is enough, and the probability of a wick/spike is relatively lower. For now, I’m not in a hurry to buy.
$PUMP This 15m move was pretty decisive—the volume directly hit 1.91x, and the price broke through the near-20 5m lower bound; the active buy/sell ratio is 0.37, and the sell pressure really is coming out.
But what’s interesting is that OI didn’t drop—1h is +0.36%, and the notional even recovered by -1.95M. This combination looks more like the kind of "new leveraged short entry" I mentioned earlier, not a long-covering sell-off. The funding rate is still in a high percentile recently, which suggests the shorts are genuinely willing to pay the cost this time.
The overall pool’s notional change ranks #20, with an abnormal percentile of 68.5%; the heat is mid-to-high—not the kind of pure noise. What I’m watching is whether the funding rate keeps pushing higher—if it stays elevated and the price continues to go down, there’s likely another wave. On the other hand, if the funding rate turns down, then be careful about short covering.
24h turnover is 168M; the depth is enough, and the probability of a wick/spike is relatively lower. For now, I’m not in a hurry to buy.
But what’s interesting is that OI didn’t drop—1h is +0.36%, and the notional even recovered by -1.95M. This combination looks more like the kind of "new leveraged short entry" I mentioned earlier, not a long-covering sell-off. The funding rate is still in a high percentile recently, which suggests the shorts are genuinely willing to pay the cost this time.
The overall pool’s notional change ranks #20, with an abnormal percentile of 68.5%; the heat is mid-to-high—not the kind of pure noise. What I’m watching is whether the funding rate keeps pushing higher—if it stays elevated and the price continues to go down, there’s likely another wave. On the other hand, if the funding rate turns down, then be careful about short covering.
24h turnover is 168M; the depth is enough, and the probability of a wick/spike is relatively lower. For now, I’m not in a hurry to buy.
67
·
--
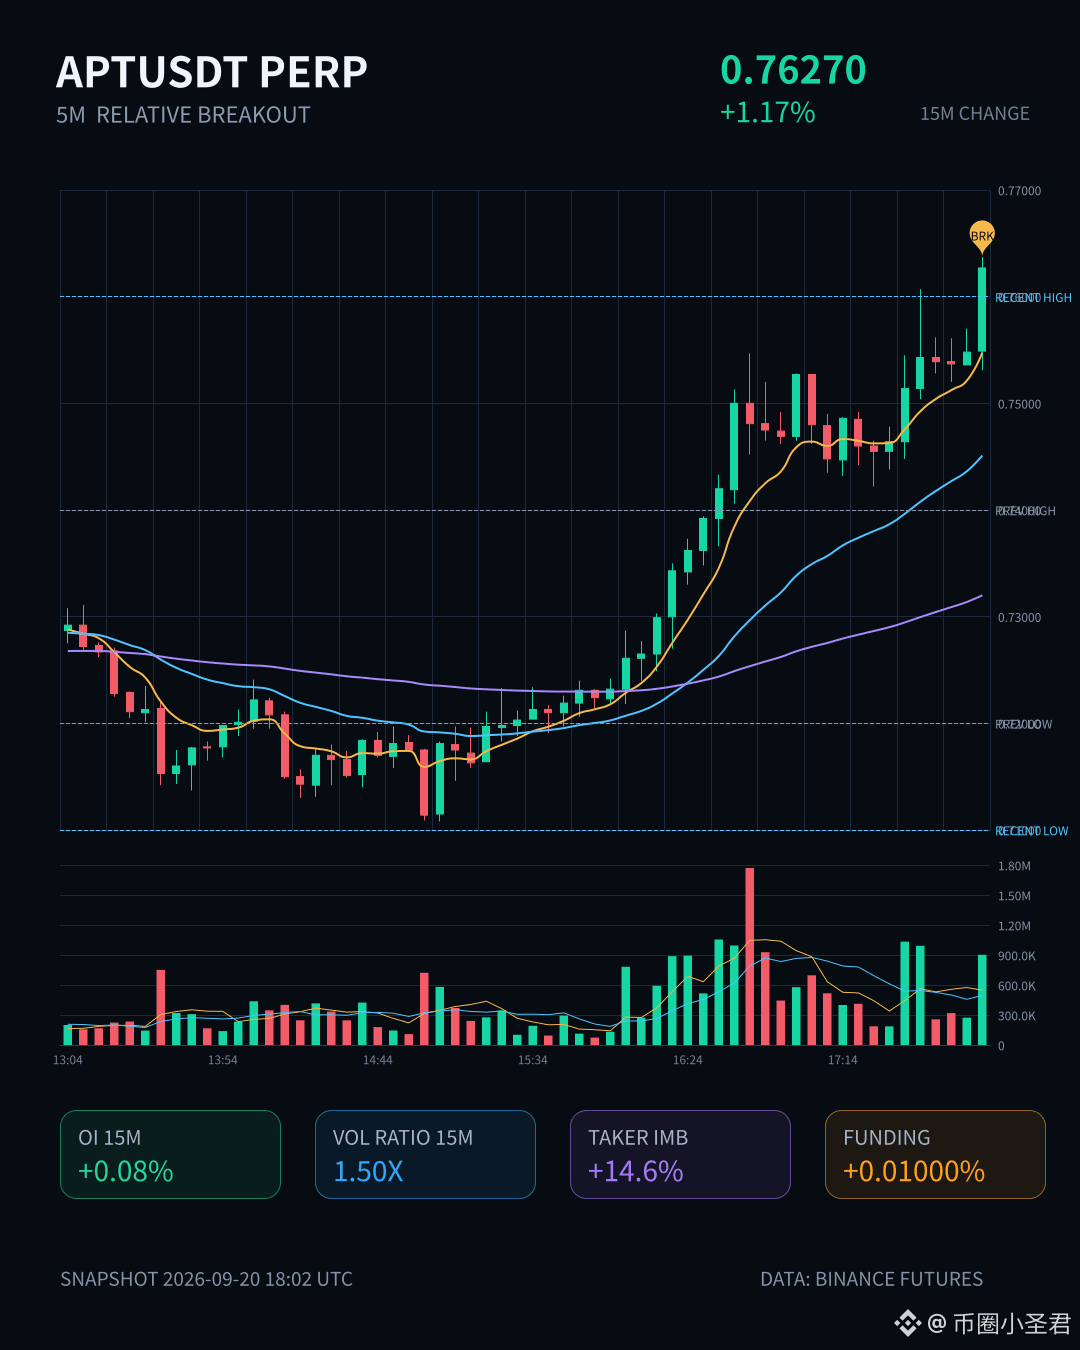
APT This round is kind of interesting.
On the 15m timeframe, it surged 1.17%, with volume at 1.5x. The closing price even directly chewed through nearly 20 of the 5m upper boundary lines. The proactive trading imbalance is +14.6%, and the buy-sell ratio is 1.34. The bids came in with direction—not some fake breakout propped up by idle limit orders.
Even more importantly, OI is lifting at the same time. 15m +0.08%, 1h +0.68%, with nominal increase of over 500k U. Price is up, positions are up—this is a classic case of incremental leveraged longs entering, not short covering pushing price. The abnormal percentile is 83.5%, ranked #20 across the whole pool, and nominal change is #32. It’s not the most explosive tier, but within APT’s liquidity, this amount is definitely worth watching.
In the past 24h, turnover is 64.6M. Depth confirmation looks fine; the volume is higher than usual, and the boundary breakout isn’t just a needle-through.
Of course, with only 1h OI up 0.68%, leverage is still somewhat restrained—not the kind of structure that rockets straight to the sky in one go. Whether it can continue will depend on whether there’s a pullback-and-confirm after the 5m upper boundary breakout—don’t let it get slapped back the moment the session opens.
Just watch it for now; don’t chase the price.
APT This round is kind of interesting.
On the 15m timeframe, it surged 1.17%, with volume at 1.5x. The closing price even directly chewed through nearly 20 of the 5m upper boundary lines. The proactive trading imbalance is +14.6%, and the buy-sell ratio is 1.34. The bids came in with direction—not some fake breakout propped up by idle limit orders.
Even more importantly, OI is lifting at the same time. 15m +0.08%, 1h +0.68%, with nominal increase of over 500k U. Price is up, positions are up—this is a classic case of incremental leveraged longs entering, not short covering pushing price. The abnormal percentile is 83.5%, ranked #20 across the whole pool, and nominal change is #32. It’s not the most explosive tier, but within APT’s liquidity, this amount is definitely worth watching.
In the past 24h, turnover is 64.6M. Depth confirmation looks fine; the volume is higher than usual, and the boundary breakout isn’t just a needle-through.
Of course, with only 1h OI up 0.68%, leverage is still somewhat restrained—not the kind of structure that rockets straight to the sky in one go. Whether it can continue will depend on whether there’s a pullback-and-confirm after the 5m upper boundary breakout—don’t let it get slapped back the moment the session opens.
Just watch it for now; don’t chase the price.
On the 15m timeframe, it surged 1.17%, with volume at 1.5x. The closing price even directly chewed through nearly 20 of the 5m upper boundary lines. The proactive trading imbalance is +14.6%, and the buy-sell ratio is 1.34. The bids came in with direction—not some fake breakout propped up by idle limit orders.
Even more importantly, OI is lifting at the same time. 15m +0.08%, 1h +0.68%, with nominal increase of over 500k U. Price is up, positions are up—this is a classic case of incremental leveraged longs entering, not short covering pushing price. The abnormal percentile is 83.5%, ranked #20 across the whole pool, and nominal change is #32. It’s not the most explosive tier, but within APT’s liquidity, this amount is definitely worth watching.
In the past 24h, turnover is 64.6M. Depth confirmation looks fine; the volume is higher than usual, and the boundary breakout isn’t just a needle-through.
Of course, with only 1h OI up 0.68%, leverage is still somewhat restrained—not the kind of structure that rockets straight to the sky in one go. Whether it can continue will depend on whether there’s a pullback-and-confirm after the 5m upper boundary breakout—don’t let it get slapped back the moment the session opens.
Just watch it for now; don’t chase the price.
4
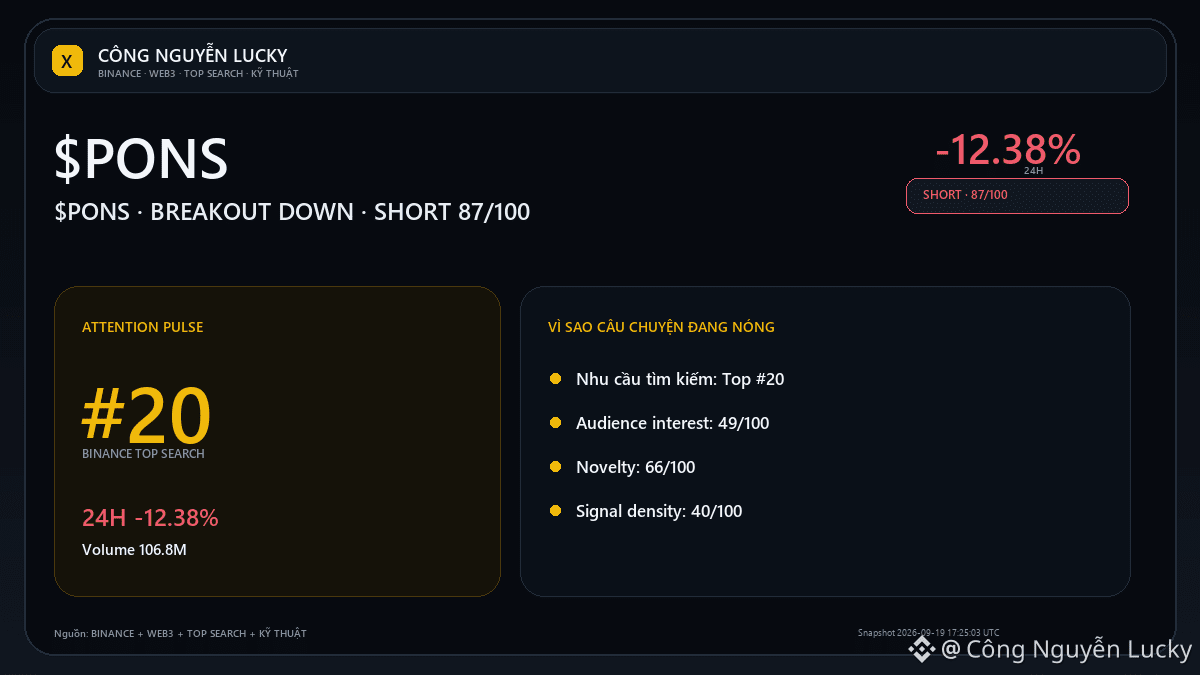
🚨 $PONS is in BREAKOUT DOWN — is it a real breakout or a breakout that is easy to get pulled back? Market: 0.5911 · 24h -12.38% · volume ~106.8M USDT · 920,976 trades.
Location: 5/100 within the daily range · about 16.0% below the high. Continuation requires: Breaking 0.5855 with expanded volume will make the bearish continuation scenario more credible.
Cooling off if: Not holding the lower zone and reclaiming the midpoint 0.64445 will weaken the downward pressure. 📌 LONG/SHORT Outlook: **SHORT · STRONG · 87/100**.
Key basis: 24h -12.38% price change; price is 5/100 within the 24h range; weaker than BTC by -13.34 percentage points.
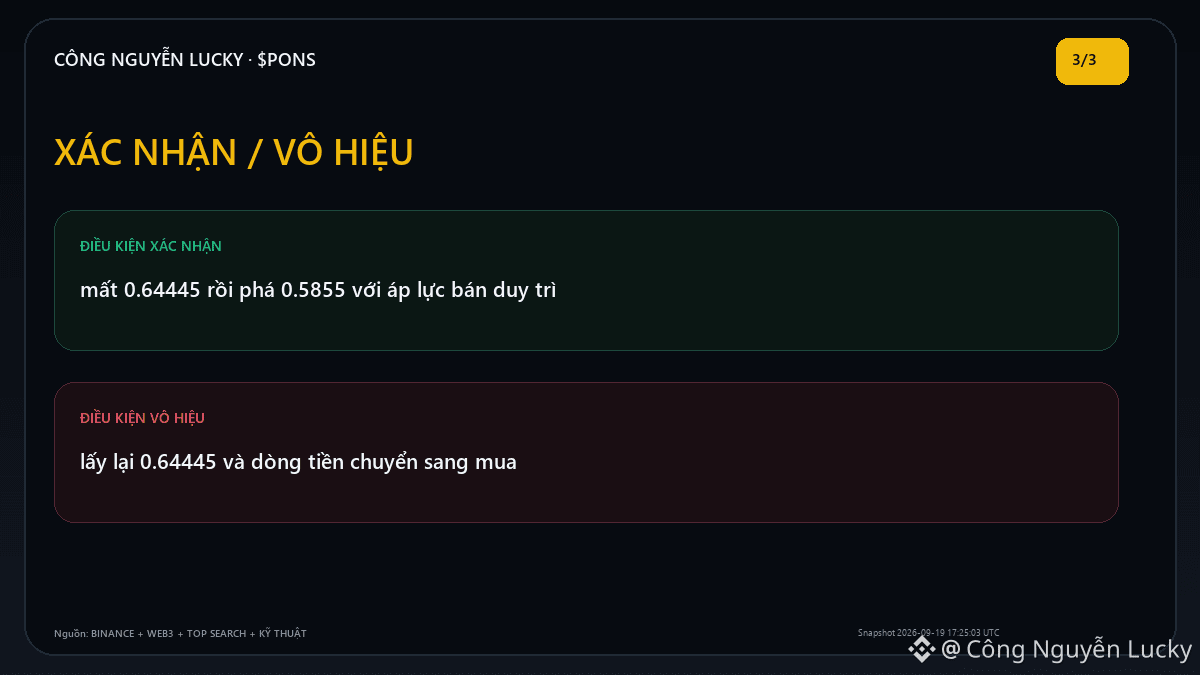
Further confirmation when: Losing 0.64445 then breaking 0.5855 with sell pressure staying strong.
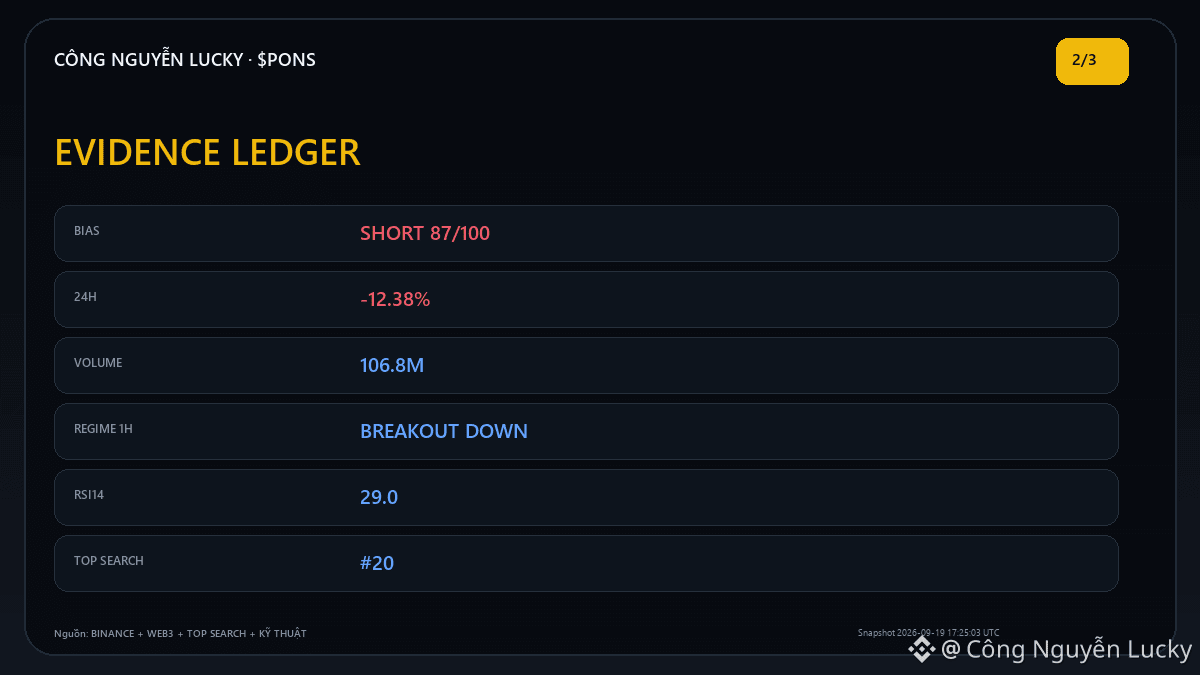
Neutralize/cancel the direction if: Reclaiming 0.64445 and money flow switches to buying. 💬 For $PONS, are you weighting price/volume higher or money flow/positioning? 📌 If you’re monitoring $PONS, open the cashtag to check the price, liquidity, and the current market context before deciding. 🔎 **Evidence check — SHORT 87/100**
• 1H: BREAKOUT DOWN; RSI14 29.0; confluence 62/100.
• Notable technicals: 20-candle breakdown with volume; MACD histogram negative/expanding.
• Price 0.5911; 24h -12.38%; volume 106.8M.
• Binance Top Search #20. 🧭 **Levels to watch:** Support 0.6005 · Resistance 0.7034 · confirmation: lose 0.64445 then break 0.5855 with sell pressure maintained · invalidation: reclaim 0.64445 and money flow turns to buying Reference sources: Binance Futures Market + Binance Web3 Trending + Binance Top Search + Binance Klines / Technical · snapshot 2026-09-19 17:25:03 UTC
💬 **Discussion angle:** What confirmation signals do you need before considering this $PONS move “real” instead of noise?
⚠️ This market analysis is for reference only, not a commitment to profits. Everyone should do their own research (DYOR), manage risk themselves, and take responsibility for their trading decisions. $PONS $BTC
🚨 $PONS is in BREAKOUT DOWN — is it a real breakout or a breakout that is easy to get pulled back? Market: 0.5911 · 24h -12.38% · volume ~106.8M USDT · 920,976 trades.
Location: 5/100 within the daily range · about 16.0% below the high. Continuation requires: Breaking 0.5855 with expanded volume will make the bearish continuation scenario more credible.
Cooling off if: Not holding the lower zone and reclaiming the midpoint 0.64445 will weaken the downward pressure. 📌 LONG/SHORT Outlook: **SHORT · STRONG · 87/100**.
Key basis: 24h -12.38% price change; price is 5/100 within the 24h range; weaker than BTC by -13.34 percentage points.
Further confirmation when: Losing 0.64445 then breaking 0.5855 with sell pressure staying strong.
Neutralize/cancel the direction if: Reclaiming 0.64445 and money flow switches to buying. 💬 For $PONS , are you weighting price/volume higher or money flow/positioning? 📌 If you’re monitoring $PONS , open the cashtag to check the price, liquidity, and the current market context before deciding. 🔎 **Evidence check — SHORT 87/100**
• 1H: BREAKOUT DOWN; RSI14 29.0; confluence 62/100.
• Notable technicals: 20-candle breakdown with volume; MACD histogram negative/expanding.
• Price 0.5911; 24h -12.38%; volume 106.8M.
• Binance Top Search #20. 🧭 **Levels to watch:** Support 0.6005 · Resistance 0.7034 · confirmation: lose 0.64445 then break 0.5855 with sell pressure maintained · invalidation: reclaim 0.64445 and money flow turns to buying Reference sources: Binance Futures Market + Binance Web3 Trending + Binance Top Search + Binance Klines / Technical · snapshot 2026-09-19 17:25:03 UTC
💬 **Discussion angle:** What confirmation signals do you need before considering this $PONS move “real” instead of noise?
⚠️ This market analysis is for reference only, not a commitment to profits. Everyone should do their own research (DYOR), manage risk themselves, and take responsibility for their trading decisions. $PONS $BTC
Location: 5/100 within the daily range · about 16.0% below the high. Continuation requires: Breaking 0.5855 with expanded volume will make the bearish continuation scenario more credible.
Cooling off if: Not holding the lower zone and reclaiming the midpoint 0.64445 will weaken the downward pressure. 📌 LONG/SHORT Outlook: **SHORT · STRONG · 87/100**.
Key basis: 24h -12.38% price change; price is 5/100 within the 24h range; weaker than BTC by -13.34 percentage points.
Further confirmation when: Losing 0.64445 then breaking 0.5855 with sell pressure staying strong.
Neutralize/cancel the direction if: Reclaiming 0.64445 and money flow switches to buying. 💬 For $PONS , are you weighting price/volume higher or money flow/positioning? 📌 If you’re monitoring $PONS , open the cashtag to check the price, liquidity, and the current market context before deciding. 🔎 **Evidence check — SHORT 87/100**
• 1H: BREAKOUT DOWN; RSI14 29.0; confluence 62/100.
• Notable technicals: 20-candle breakdown with volume; MACD histogram negative/expanding.
• Price 0.5911; 24h -12.38%; volume 106.8M.
• Binance Top Search #20. 🧭 **Levels to watch:** Support 0.6005 · Resistance 0.7034 · confirmation: lose 0.64445 then break 0.5855 with sell pressure maintained · invalidation: reclaim 0.64445 and money flow turns to buying Reference sources: Binance Futures Market + Binance Web3 Trending + Binance Top Search + Binance Klines / Technical · snapshot 2026-09-19 17:25:03 UTC
💬 **Discussion angle:** What confirmation signals do you need before considering this $PONS move “real” instead of noise?
⚠️ This market analysis is for reference only, not a commitment to profits. Everyone should do their own research (DYOR), manage risk themselves, and take responsibility for their trading decisions. $PONS $BTC
192
·
--
$UAI This spot is kind of interesting.
At the 15m interval, one pull moved up 1.24%. Volume directly spiked to 1.92x, and the closing price broke above the upper edge of nearly 20 consecutive 5m candles. The proactive turnover was down 20.3%, the buy-to-sell ratio was 1.51, and the buy orders are genuinely pushing forward.
But if you switch to OI, it’s a different story—both the 15m and 1h contract OI are falling. While the price is moving up, open interest is actually being withdrawn. This combination usually isn’t a relay from fresh long buyers. More like shorts getting stopped out and then being forced into passive covering, pushing the price up.
The abnormal percentile in the whole pool is 78.8%, ranked #20. Depth and transaction direction are both confirmed. However, the total turnover over 24h is only 14.3M—the pool is too shallow. At this kind of scale, you don’t need much volume to push out one bullish candle, and the reversal can be quick.
Don’t get tricked by this candle into jumping in as a bag-holder. First, see whether OI can turn back to positive. If it’s purely a short-covering move, once volume stops, the illusion will be exposed.
$UAI This spot is kind of interesting.
At the 15m interval, one pull moved up 1.24%. Volume directly spiked to 1.92x, and the closing price broke above the upper edge of nearly 20 consecutive 5m candles. The proactive turnover was down 20.3%, the buy-to-sell ratio was 1.51, and the buy orders are genuinely pushing forward.
But if you switch to OI, it’s a different story—both the 15m and 1h contract OI are falling. While the price is moving up, open interest is actually being withdrawn. This combination usually isn’t a relay from fresh long buyers. More like shorts getting stopped out and then being forced into passive covering, pushing the price up.
The abnormal percentile in the whole pool is 78.8%, ranked #20. Depth and transaction direction are both confirmed. However, the total turnover over 24h is only 14.3M—the pool is too shallow. At this kind of scale, you don’t need much volume to push out one bullish candle, and the reversal can be quick.
Don’t get tricked by this candle into jumping in as a bag-holder. First, see whether OI can turn back to positive. If it’s purely a short-covering move, once volume stops, the illusion will be exposed.
At the 15m interval, one pull moved up 1.24%. Volume directly spiked to 1.92x, and the closing price broke above the upper edge of nearly 20 consecutive 5m candles. The proactive turnover was down 20.3%, the buy-to-sell ratio was 1.51, and the buy orders are genuinely pushing forward.
But if you switch to OI, it’s a different story—both the 15m and 1h contract OI are falling. While the price is moving up, open interest is actually being withdrawn. This combination usually isn’t a relay from fresh long buyers. More like shorts getting stopped out and then being forced into passive covering, pushing the price up.
The abnormal percentile in the whole pool is 78.8%, ranked #20. Depth and transaction direction are both confirmed. However, the total turnover over 24h is only 14.3M—the pool is too shallow. At this kind of scale, you don’t need much volume to push out one bullish candle, and the reversal can be quick.
Don’t get tricked by this candle into jumping in as a bag-holder. First, see whether OI can turn back to positive. If it’s purely a short-covering move, once volume stops, the illusion will be exposed.
9

·
--
$CHIP This spot is kind of interesting.
In 15m, it directly surged 2.4%. Volume reached 2.17×, the Z value is 3.49, and the close even pushed through the upper edge of nearly 20 of the 5m candles. This isn’t that slow, grinding kind of move—there’s capital actively pushing it.
More importantly, it’s OI—price is rising while OI rises in sync. The nominal changes for the whole pool rank all the way up to #20; the abnormal percentile is 96.2%, and the whole pool’s abnormality is #6. This combo leans more toward new long positions adding leverage and entering, rather than shorts being forced to cover.
The主动成交差 (active trade differential) is 29.5%, and the buy/sell ratio is 1.84—active buying is clearly dominant. The funding rate is also pushed to a high recent percentile.
The 24h traded value is only 29M, so the float isn’t that large. Once this kind of volume comes in, the upside elasticity should be very direct. A high funding rate is a double-edged sword: it means long sentiment is already very hot. If you chase, don’t get carried away—but as long as the structure hasn’t broken, don’t lightly stand on the other side.
First, see whether this breakout level can be held. If it holds, it continues; if it doesn’t, it’s a pin-bar fakeout. Watch OI—so long as it’s still increasing and price hasn’t collapsed, the longs still have the say.
$CHIP This spot is kind of interesting.
In 15m, it directly surged 2.4%. Volume reached 2.17×, the Z value is 3.49, and the close even pushed through the upper edge of nearly 20 of the 5m candles. This isn’t that slow, grinding kind of move—there’s capital actively pushing it.
More importantly, it’s OI—price is rising while OI rises in sync. The nominal changes for the whole pool rank all the way up to #20; the abnormal percentile is 96.2%, and the whole pool’s abnormality is #6. This combo leans more toward new long positions adding leverage and entering, rather than shorts being forced to cover.
The主动成交差 (active trade differential) is 29.5%, and the buy/sell ratio is 1.84—active buying is clearly dominant. The funding rate is also pushed to a high recent percentile.
The 24h traded value is only 29M, so the float isn’t that large. Once this kind of volume comes in, the upside elasticity should be very direct. A high funding rate is a double-edged sword: it means long sentiment is already very hot. If you chase, don’t get carried away—but as long as the structure hasn’t broken, don’t lightly stand on the other side.
First, see whether this breakout level can be held. If it holds, it continues; if it doesn’t, it’s a pin-bar fakeout. Watch OI—so long as it’s still increasing and price hasn’t collapsed, the longs still have the say.
In 15m, it directly surged 2.4%. Volume reached 2.17×, the Z value is 3.49, and the close even pushed through the upper edge of nearly 20 of the 5m candles. This isn’t that slow, grinding kind of move—there’s capital actively pushing it.
More importantly, it’s OI—price is rising while OI rises in sync. The nominal changes for the whole pool rank all the way up to #20; the abnormal percentile is 96.2%, and the whole pool’s abnormality is #6. This combo leans more toward new long positions adding leverage and entering, rather than shorts being forced to cover.
The主动成交差 (active trade differential) is 29.5%, and the buy/sell ratio is 1.84—active buying is clearly dominant. The funding rate is also pushed to a high recent percentile.
The 24h traded value is only 29M, so the float isn’t that large. Once this kind of volume comes in, the upside elasticity should be very direct. A high funding rate is a double-edged sword: it means long sentiment is already very hot. If you chase, don’t get carried away—but as long as the structure hasn’t broken, don’t lightly stand on the other side.
First, see whether this breakout level can be held. If it holds, it continues; if it doesn’t, it’s a pin-bar fakeout. Watch OI—so long as it’s still increasing and price hasn’t collapsed, the longs still have the say.
11


·
--
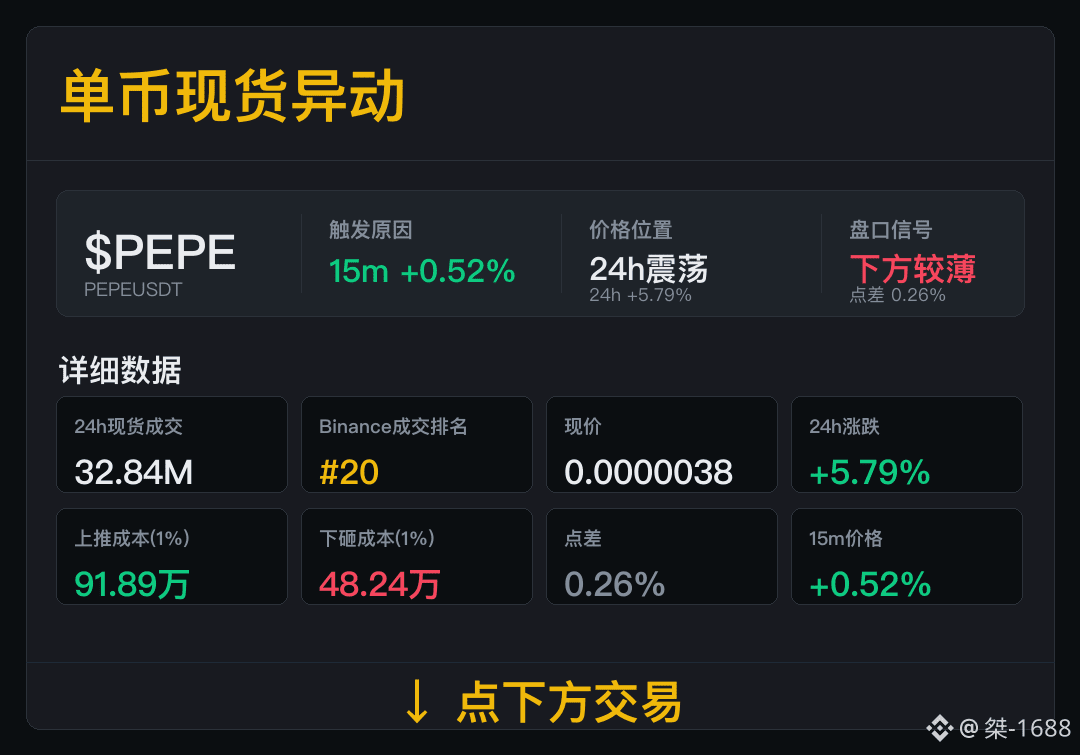
$PEPE Intraday volatility is amplified; the成交和点差 (trading volume and bid-ask spread) need to be considered together.
Spot trading volume: 32.84M, Binance trading rank #20. Once the trading volume ranking moves into the top tier, the next wave of volume still needs to be further confirmed.
Current 24h performance: +5.79%; spread: 0.26%. Upward (buy-side) costs are 0.9189M, downward (sell-side) costs are 0.4824M. The spot trading volume and the order book cost levels match up—only then do the short-term signals feel more solid.
Next, focus on the spread and trading volume. If the spread holds steady and trading volume keeps coming, we can talk about the next leg.
$PEPE Intraday volatility is amplified; the成交和点差 (trading volume and bid-ask spread) need to be considered together.
Spot trading volume: 32.84M, Binance trading rank #20. Once the trading volume ranking moves into the top tier, the next wave of volume still needs to be further confirmed.
Current 24h performance: +5.79%; spread: 0.26%. Upward (buy-side) costs are 0.9189M, downward (sell-side) costs are 0.4824M. The spot trading volume and the order book cost levels match up—only then do the short-term signals feel more solid.
Next, focus on the spread and trading volume. If the spread holds steady and trading volume keeps coming, we can talk about the next leg.
Spot trading volume: 32.84M, Binance trading rank #20. Once the trading volume ranking moves into the top tier, the next wave of volume still needs to be further confirmed.
Current 24h performance: +5.79%; spread: 0.26%. Upward (buy-side) costs are 0.9189M, downward (sell-side) costs are 0.4824M. The spot trading volume and the order book cost levels match up—only then do the short-term signals feel more solid.
Next, focus on the spread and trading volume. If the spread holds steady and trading volume keeps coming, we can talk about the next leg.
1
194
·
--
$ZRO This move is quite decisive. In the 15m timeframe it directly broke through the top of the 5m range by nearly 20 lines; the trading volume spiked to 1.76x, with the buy-to-sell ratio at 2.64.
But OI is falling—15m -0.69%, 1h -0.84%. Price is up while positions are down, a typical short-covering pattern, not new longs entering.
The funding rate has already been in the high percentile recently: the rate is at 92.9%, an abnormal percentile, and the entire pool ranks #20. This setup is most afraid of chasing price. Shorts cover, and the funding is also expensive—who’s going to take the next baton?
Watch whether it can hold steady at this breakout level. If it can’t, it’s only a matter of one needle-like wick.
$ZRO This move is quite decisive. In the 15m timeframe it directly broke through the top of the 5m range by nearly 20 lines; the trading volume spiked to 1.76x, with the buy-to-sell ratio at 2.64.
But OI is falling—15m -0.69%, 1h -0.84%. Price is up while positions are down, a typical short-covering pattern, not new longs entering.
The funding rate has already been in the high percentile recently: the rate is at 92.9%, an abnormal percentile, and the entire pool ranks #20. This setup is most afraid of chasing price. Shorts cover, and the funding is also expensive—who’s going to take the next baton?
Watch whether it can hold steady at this breakout level. If it can’t, it’s only a matter of one needle-like wick.
But OI is falling—15m -0.69%, 1h -0.84%. Price is up while positions are down, a typical short-covering pattern, not new longs entering.
The funding rate has already been in the high percentile recently: the rate is at 92.9%, an abnormal percentile, and the entire pool ranks #20. This setup is most afraid of chasing price. Shorts cover, and the funding is also expensive—who’s going to take the next baton?
Watch whether it can hold steady at this breakout level. If it can’t, it’s only a matter of one needle-like wick.
29
·
--
$VVV Over these 15 minutes, something doesn’t feel right.
The price dropped by 2.27%, volume rose to 1.58x, and it directly broke below the lower bound of the past ~20 5-minute candles. Active trading volume discrepancy is -18.1%, buy/sell ratio is 0.69, and selling pressure is clearly dominant.
What’s interesting is the OI: the 15m contract is +0.33%, but the nominal value is -530K; the 1h contract is -1.37%, with nominal -1.36M. Price is falling while OI is rising—there’s a strong smell of fresh leveraged shorts entering. The abnormal percentile is 92.7%, the whole pool is #13, nominal change is #20, and it’s continued across multiple consecutive periods.
24h trading value is 77.6M, and the order depth confirms it. I generally wouldn’t rush to take this setup. If shorts add to their position, after the lower-band breakdown there could still be another leg. Let’s wait for the OI to cool off, or for active buying to come back.
Just watch for now.
$VVV Over these 15 minutes, something doesn’t feel right.
The price dropped by 2.27%, volume rose to 1.58x, and it directly broke below the lower bound of the past ~20 5-minute candles. Active trading volume discrepancy is -18.1%, buy/sell ratio is 0.69, and selling pressure is clearly dominant.
What’s interesting is the OI: the 15m contract is +0.33%, but the nominal value is -530K; the 1h contract is -1.37%, with nominal -1.36M. Price is falling while OI is rising—there’s a strong smell of fresh leveraged shorts entering. The abnormal percentile is 92.7%, the whole pool is #13, nominal change is #20, and it’s continued across multiple consecutive periods.
24h trading value is 77.6M, and the order depth confirms it. I generally wouldn’t rush to take this setup. If shorts add to their position, after the lower-band breakdown there could still be another leg. Let’s wait for the OI to cool off, or for active buying to come back.
Just watch for now.
The price dropped by 2.27%, volume rose to 1.58x, and it directly broke below the lower bound of the past ~20 5-minute candles. Active trading volume discrepancy is -18.1%, buy/sell ratio is 0.69, and selling pressure is clearly dominant.
What’s interesting is the OI: the 15m contract is +0.33%, but the nominal value is -530K; the 1h contract is -1.37%, with nominal -1.36M. Price is falling while OI is rising—there’s a strong smell of fresh leveraged shorts entering. The abnormal percentile is 92.7%, the whole pool is #13, nominal change is #20, and it’s continued across multiple consecutive periods.
24h trading value is 77.6M, and the order depth confirms it. I generally wouldn’t rush to take this setup. If shorts add to their position, after the lower-band breakdown there could still be another leg. Let’s wait for the OI to cool off, or for active buying to come back.
Just watch for now.
4
·
--
ONE This move is a bit interesting.
In 15m, it rose 4.39%, with volume up 1.6x. OI jumped +4.84% in 1h, and nominal value saw 1.92M in inflows. Price is up, positions are up—this is typical leveraged longs adding, not shorts getting squeezed.
Anomaly percentile is 89.9%, within the whole pool #20, nominal change #14—this isn’t the absolute top, but it’s already in the front row. The funding rate has also reached a high percentile recently, suggesting long sentiment isn’t low.
In 24h, turnover is 603M, buy/sell ratio 1.04. Active buying is slightly dominant, but not extreme.
The question now is: OI is rising faster than price, and the leverage is stacking a bit quickly. If it can hold here, it becomes the upper boundary of a new range; if it can’t, it becomes fuel for a wave of longs getting forced liquidated.
First, see whether it can hold the 4.39% move on the 15m timeframe.
ONE This move is a bit interesting.
In 15m, it rose 4.39%, with volume up 1.6x. OI jumped +4.84% in 1h, and nominal value saw 1.92M in inflows. Price is up, positions are up—this is typical leveraged longs adding, not shorts getting squeezed.
Anomaly percentile is 89.9%, within the whole pool #20, nominal change #14—this isn’t the absolute top, but it’s already in the front row. The funding rate has also reached a high percentile recently, suggesting long sentiment isn’t low.
In 24h, turnover is 603M, buy/sell ratio 1.04. Active buying is slightly dominant, but not extreme.
The question now is: OI is rising faster than price, and the leverage is stacking a bit quickly. If it can hold here, it becomes the upper boundary of a new range; if it can’t, it becomes fuel for a wave of longs getting forced liquidated.
First, see whether it can hold the 4.39% move on the 15m timeframe.
In 15m, it rose 4.39%, with volume up 1.6x. OI jumped +4.84% in 1h, and nominal value saw 1.92M in inflows. Price is up, positions are up—this is typical leveraged longs adding, not shorts getting squeezed.
Anomaly percentile is 89.9%, within the whole pool #20, nominal change #14—this isn’t the absolute top, but it’s already in the front row. The funding rate has also reached a high percentile recently, suggesting long sentiment isn’t low.
In 24h, turnover is 603M, buy/sell ratio 1.04. Active buying is slightly dominant, but not extreme.
The question now is: OI is rising faster than price, and the leverage is stacking a bit quickly. If it can hold here, it becomes the upper boundary of a new range; if it can’t, it becomes fuel for a wave of longs getting forced liquidated.
First, see whether it can hold the 4.39% move on the 15m timeframe.
17
·
--
ZEC: This move is a bit too rushed. In the 15m timeframe it’s already +1.63%, but if you look closely, OI is actually trending downward—15m -0.12%, 1h -0.29%. As the price rises, the positions are decreasing instead.
In plain terms, this structure is shorts getting squeezed into covering—not fresh long capital really pouring in. On the 5m Binance side, the liquidation agent at 172K is prominent, and buy-side orders are clearly denser. Combined with the funding rate being at a high percentile recently, it gives a strong squeeze/buyback vibe.
That said, the position is indeed not low. The OI abnormal percentile has already reached 93.3%; across the whole pool, the abnormal rank is #20, and the notional change is directly #3—meaning this market-wide anomaly is definitely significant. 24h turnover is over 4.4B; the taker buy/sell ratio is 1.10, and taker execution is off by 4.9%. The bids are still slightly more proactive.
My view: If OI doesn’t catch up with the price rebound, it usually won’t go far. It’s more like a squeeze-driven, compress-and-cover rebound rather than the start of a real trend. If you’re thinking of going long, be careful—wait for a pullback and see whether the longs are willing to add back into positions. $ZEC
ZEC: This move is a bit too rushed. In the 15m timeframe it’s already +1.63%, but if you look closely, OI is actually trending downward—15m -0.12%, 1h -0.29%. As the price rises, the positions are decreasing instead.
In plain terms, this structure is shorts getting squeezed into covering—not fresh long capital really pouring in. On the 5m Binance side, the liquidation agent at 172K is prominent, and buy-side orders are clearly denser. Combined with the funding rate being at a high percentile recently, it gives a strong squeeze/buyback vibe.
That said, the position is indeed not low. The OI abnormal percentile has already reached 93.3%; across the whole pool, the abnormal rank is #20, and the notional change is directly #3—meaning this market-wide anomaly is definitely significant. 24h turnover is over 4.4B; the taker buy/sell ratio is 1.10, and taker execution is off by 4.9%. The bids are still slightly more proactive.
My view: If OI doesn’t catch up with the price rebound, it usually won’t go far. It’s more like a squeeze-driven, compress-and-cover rebound rather than the start of a real trend. If you’re thinking of going long, be careful—wait for a pullback and see whether the longs are willing to add back into positions. $ZEC
In plain terms, this structure is shorts getting squeezed into covering—not fresh long capital really pouring in. On the 5m Binance side, the liquidation agent at 172K is prominent, and buy-side orders are clearly denser. Combined with the funding rate being at a high percentile recently, it gives a strong squeeze/buyback vibe.
That said, the position is indeed not low. The OI abnormal percentile has already reached 93.3%; across the whole pool, the abnormal rank is #20, and the notional change is directly #3—meaning this market-wide anomaly is definitely significant. 24h turnover is over 4.4B; the taker buy/sell ratio is 1.10, and taker execution is off by 4.9%. The bids are still slightly more proactive.
My view: If OI doesn’t catch up with the price rebound, it usually won’t go far. It’s more like a squeeze-driven, compress-and-cover rebound rather than the start of a real trend. If you’re thinking of going long, be careful—wait for a pullback and see whether the longs are willing to add back into positions. $ZEC
101


Article
$XLM +8.7% in 24h — hit the maximum gain in the top 100!🔥 $XLM +8.7% in 24h — hit the maximum gain in the top 100!
Did you see that?
🧭 Summary: the move is within a broader trend — 7D and 30D in the same direction; volume is low — the movement may be unstable.
🌍 Market context: out of 53 major coins with noticeable movement over 24h — 🔼 35 went up, 🔽 18 fell
📈 Star of the day: $XLM +8.7% in 24h
$XLM +8.7% in 24h — hit the maximum gain in the top 100!
🔥 $XLM +8.7% in 24h — hit the maximum gain in the top 100!
Did you see that?
🧭 Summary: the move is within a broader trend — 7D and 30D in the same direction; volume is low — the movement may be unstable.
🌍 Market context: out of 53 major coins with noticeable movement over 24h — 🔼 35 went up, 🔽 18 fell
📈 Star of the day: $XLM +8.7% in 24h
Did you see that?
🧭 Summary: the move is within a broader trend — 7D and 30D in the same direction; volume is low — the movement may be unstable.
🌍 Market context: out of 53 major coins with noticeable movement over 24h — 🔼 35 went up, 🔽 18 fell
📈 Star of the day: $XLM +8.7% in 24h
376

·
--
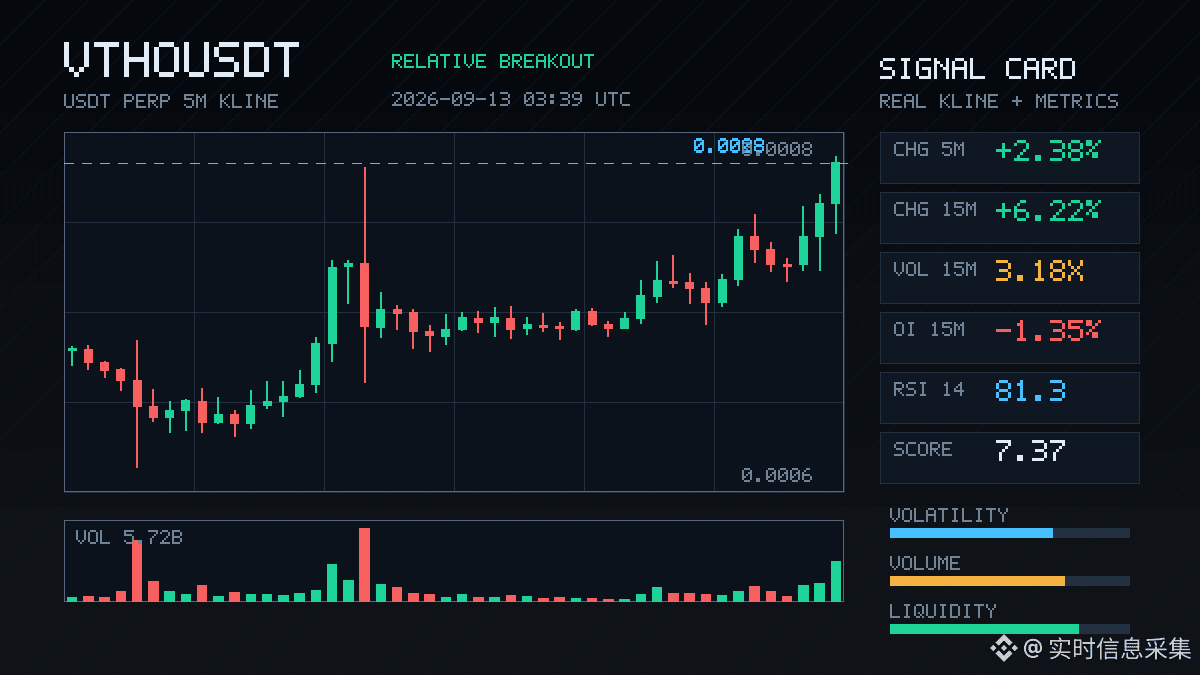
$VTHO This move is a bit interesting.
In 15m, it directly surged 6.22%. Volume hit more than 3 times the usual level, and the price closed outside the upper edge of the last ~20 five-minute candles. But the OI is trending downward—15m -1.35%, 1h -1.23%. Yet nominal changes are actually rising.
This kind of structure usually isn’t driven by fresh longs entering. It looks more like shorts are being forced to cover, or existing positions are being reduced. Active trade imbalance is +7%, and the buy/sell ratio is 1.15. Buyers are indeed chasing, but they’re chasing liquidity—not adding new positions.
The OI abnormal percentile is 94.6%. It ranks #20 across the whole pool by OI anomaly, and nominal change ranks #28. The location itself is also close to a historical extreme zone.
In the past 24h, trading value is 229 million—definitely not small. In a breakout where volume/price are diverging, chasing in can easily mean catching the end of a covering cycle. I’d rather first see whether it can hold steady above the breakout level; if OI doesn’t come back, the continuity will be very much in question.
$VTHO This move is a bit interesting.
In 15m, it directly surged 6.22%. Volume hit more than 3 times the usual level, and the price closed outside the upper edge of the last ~20 five-minute candles. But the OI is trending downward—15m -1.35%, 1h -1.23%. Yet nominal changes are actually rising.
This kind of structure usually isn’t driven by fresh longs entering. It looks more like shorts are being forced to cover, or existing positions are being reduced. Active trade imbalance is +7%, and the buy/sell ratio is 1.15. Buyers are indeed chasing, but they’re chasing liquidity—not adding new positions.
The OI abnormal percentile is 94.6%. It ranks #20 across the whole pool by OI anomaly, and nominal change ranks #28. The location itself is also close to a historical extreme zone.
In the past 24h, trading value is 229 million—definitely not small. In a breakout where volume/price are diverging, chasing in can easily mean catching the end of a covering cycle. I’d rather first see whether it can hold steady above the breakout level; if OI doesn’t come back, the continuity will be very much in question.
In 15m, it directly surged 6.22%. Volume hit more than 3 times the usual level, and the price closed outside the upper edge of the last ~20 five-minute candles. But the OI is trending downward—15m -1.35%, 1h -1.23%. Yet nominal changes are actually rising.
This kind of structure usually isn’t driven by fresh longs entering. It looks more like shorts are being forced to cover, or existing positions are being reduced. Active trade imbalance is +7%, and the buy/sell ratio is 1.15. Buyers are indeed chasing, but they’re chasing liquidity—not adding new positions.
The OI abnormal percentile is 94.6%. It ranks #20 across the whole pool by OI anomaly, and nominal change ranks #28. The location itself is also close to a historical extreme zone.
In the past 24h, trading value is 229 million—definitely not small. In a breakout where volume/price are diverging, chasing in can easily mean catching the end of a covering cycle. I’d rather first see whether it can hold steady above the breakout level; if OI doesn’t come back, the continuity will be very much in question.
23
·
--
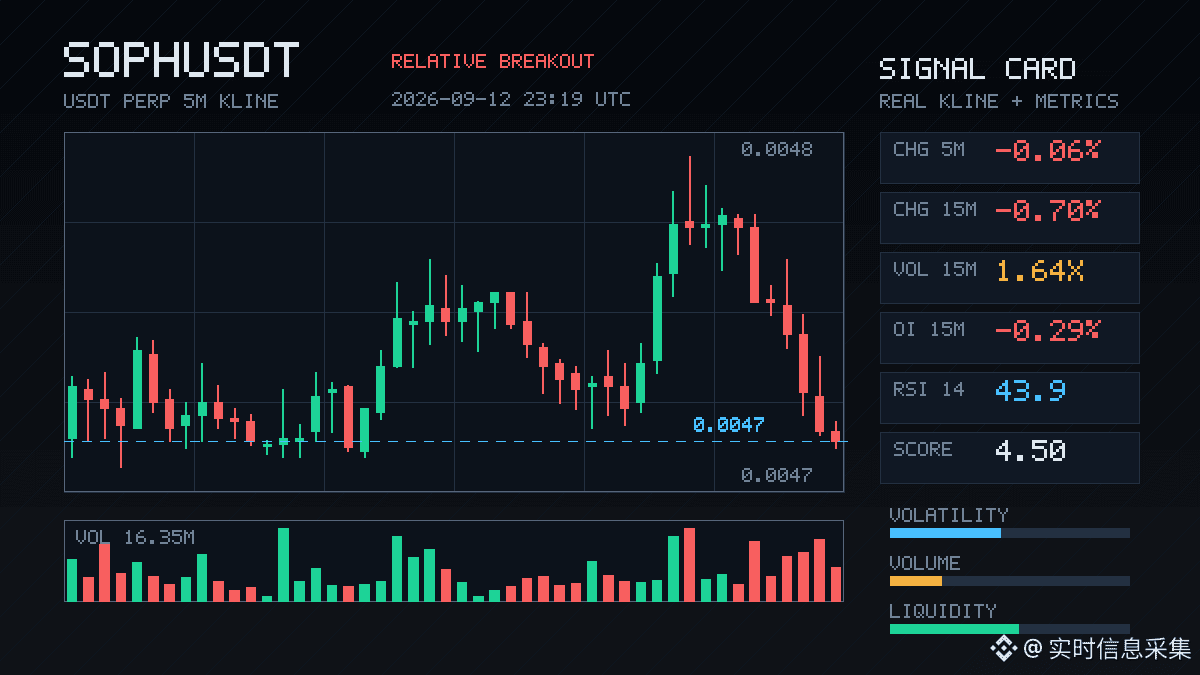
$SOPH This drop is kind of interesting: the price fell 0.7%, but OI also dropped. Both the 15m and 1h are reducing positions, and the notional change isn’t much—around 82K. This is typical of leverage being withdrawn, not of the shorts aggressively dumping.
Trading volume is up to 1.64x. The aggressive trade gap is -13.7%, and the buy/sell ratio is 0.76—sell pressure is showing up, but the magnitude isn’t that extreme. The key level is that the price broke below the lower edge of the past ~20 5m candles. This breakdown, together with the shrinking OI, looks more like longs cutting losses or de-leveraging themselves, rather than new short pressure.
The abnormal percentile is 72.2%, and it ranks #20 in the whole pool. It’s not like it’s especially chaotic, but within the current structure it’s worth keeping an eye on. If OI continues to fall and the price can’t hold, there may be another leg of deleveraging; if OI starts to rebound while price doesn’t drop, then this area may just be a washout. $SOPH
$SOPH This drop is kind of interesting: the price fell 0.7%, but OI also dropped. Both the 15m and 1h are reducing positions, and the notional change isn’t much—around 82K. This is typical of leverage being withdrawn, not of the shorts aggressively dumping.
Trading volume is up to 1.64x. The aggressive trade gap is -13.7%, and the buy/sell ratio is 0.76—sell pressure is showing up, but the magnitude isn’t that extreme. The key level is that the price broke below the lower edge of the past ~20 5m candles. This breakdown, together with the shrinking OI, looks more like longs cutting losses or de-leveraging themselves, rather than new short pressure.
The abnormal percentile is 72.2%, and it ranks #20 in the whole pool. It’s not like it’s especially chaotic, but within the current structure it’s worth keeping an eye on. If OI continues to fall and the price can’t hold, there may be another leg of deleveraging; if OI starts to rebound while price doesn’t drop, then this area may just be a washout. $SOPH
Trading volume is up to 1.64x. The aggressive trade gap is -13.7%, and the buy/sell ratio is 0.76—sell pressure is showing up, but the magnitude isn’t that extreme. The key level is that the price broke below the lower edge of the past ~20 5m candles. This breakdown, together with the shrinking OI, looks more like longs cutting losses or de-leveraging themselves, rather than new short pressure.
The abnormal percentile is 72.2%, and it ranks #20 in the whole pool. It’s not like it’s especially chaotic, but within the current structure it’s worth keeping an eye on. If OI continues to fall and the price can’t hold, there may be another leg of deleveraging; if OI starts to rebound while price doesn’t drop, then this area may just be a washout. $SOPH
9
Log in to explore more content
Join global crypto users on Binance Square
⚡️ Get latest and useful information about crypto.
💬 Trusted by the world’s largest crypto exchange.
👍 Discover real insights from verified creators.
Email / Phone number
Trending Topics
1
#BitwiseFilesFinalNEARSpotETFProspectus
6,186 views
297 Discussing
2
#BitgetHackerMoves$83MStolenXRP
12,695 views
79 Discussing
3
#SOLSpotETFWeeklyInflow$188M
5,052 views
63 Discussing
4
#DogecoinETFsPostBiggestWeekSinceLaunch
10,569 views
360 Discussing
5
#StrategyStriveAdd2305BitcoinThisWeek
64,018 views
1,410 Discussing
6
#TrumpRejectsIranHormuzReopening
63,050 views
1,128 Discussing
7
#TokenizedStockDEXVolumeHits$20.9B
134 views
6 Discussing
8
#CircleTetherFreezeBitgetHackerWallet
70,519 views
1,099 Discussing
9
#SECSaysTokenBuybacksNotAutoSecurities
38,892 views
675 Discussing
10
#ChinaUSAgreeOn$30BTariffCut
3,326 views
36 Discussing