
Rani Crypto Pro
802 Posts

Rani Crypto Pro
Report
Block User
لا أستعجل… لأن السوق لا يهرب
2.2K+ Following
662 Followers
564 Liked
Posts
All
Quotes
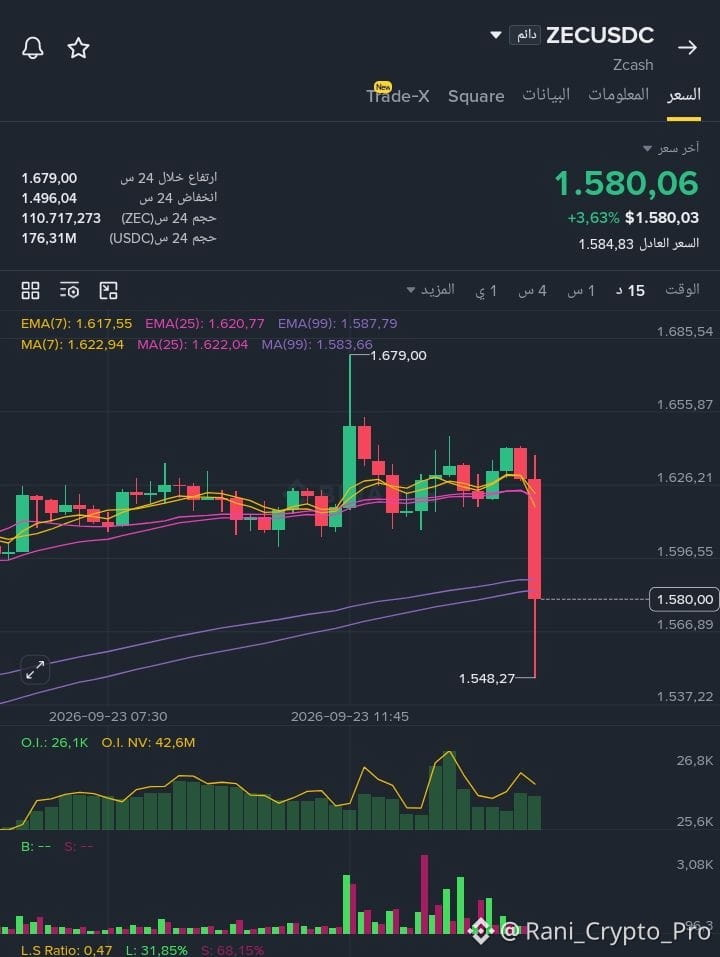
— Important update for followers $ZEC
The price is trading near $1580 after a strong drop from the $1625–1630 area, but the candle recorded a rebound from $1548, making the current zone sensitive.
🔹 Support: $1548–1560
🔹 Stronger support: $1515–1522
🔹 Resistance: $1590–1600, then $1615–1625
🔹 Last high: $1679
What’s notable from the orders is that the short ratio is high, with negative funding, while clear buy orders appeared in some trading volumes. Therefore, we do not consider the current decline alone as enough of a signal to chase a sell.
✅ Positive scenario: Reclaiming $1590–1600 and holding above it could push the price back toward $1615, then $1638.
⚠️ Negative scenario: Breaking $1548 with a clear close and continued selling pressure could drive the price to test $1520.
Summary: ZEC is now in a real test zone; the best approach is to monitor the price reaction at $1548–1600 instead of entering randomly amid the move.
{future}(ZECUSDT)
— Important update for followers $ZEC
The price is trading near $1580 after a strong drop from the $1625–1630 area, but the candle recorded a rebound from $1548, making the current zone sensitive.
🔹 Support: $1548–1560
🔹 Stronger support: $1515–1522
🔹 Resistance: $1590–1600, then $1615–1625
🔹 Last high: $1679
What’s notable from the orders is that the short ratio is high, with negative funding, while clear buy orders appeared in some trading volumes. Therefore, we do not consider the current decline alone as enough of a signal to chase a sell.
✅ Positive scenario: Reclaiming $1590–1600 and holding above it could push the price back toward $1615, then $1638.
⚠️ Negative scenario: Breaking $1548 with a clear close and continued selling pressure could drive the price to test $1520.
Summary: ZEC is now in a real test zone; the best approach is to monitor the price reaction at $1548–1600 instead of entering randomly amid the move.
The price is trading near $1580 after a strong drop from the $1625–1630 area, but the candle recorded a rebound from $1548, making the current zone sensitive.
🔹 Support: $1548–1560
🔹 Stronger support: $1515–1522
🔹 Resistance: $1590–1600, then $1615–1625
🔹 Last high: $1679
What’s notable from the orders is that the short ratio is high, with negative funding, while clear buy orders appeared in some trading volumes. Therefore, we do not consider the current decline alone as enough of a signal to chase a sell.
✅ Positive scenario: Reclaiming $1590–1600 and holding above it could push the price back toward $1615, then $1638.
⚠️ Negative scenario: Breaking $1548 with a clear close and continued selling pressure could drive the price to test $1520.
Summary: ZEC is now in a real test zone; the best approach is to monitor the price reaction at $1548–1600 instead of entering randomly amid the move.
65
Verified

Article
LSK… a real opportunity or just community hype?Let’s look at $LSK from a different angle, away from talk like: "it’s going to 🚀" or "it’s going to reach incredible numbers."
And I personally bought from them, but that doesn’t mean I’m telling you it’s guaranteed.
The real question is:
Is LSK just a coin that the community is trying to hype?
Or is there actually something changing within the project? 👀
📌 Lisk has entered a new phase in its project, with a move toward financial solutions for businesses, using digital currencies and Stablecoins in financial operations.
LSK… a real opportunity or just community hype?
Let’s look at $LSK from a different angle, away from talk like: "it’s going to 🚀" or "it’s going to reach incredible numbers."
And I personally bought from them, but that doesn’t mean I’m telling you it’s guaranteed.
The real question is:
Is LSK just a coin that the community is trying to hype?
Or is there actually something changing within the project? 👀
📌 Lisk has entered a new phase in its project, with a move toward financial solutions for businesses, using digital currencies and Stablecoins in financial operations.
And I personally bought from them, but that doesn’t mean I’m telling you it’s guaranteed.
The real question is:
Is LSK just a coin that the community is trying to hype?
Or is there actually something changing within the project? 👀
📌 Lisk has entered a new phase in its project, with a move toward financial solutions for businesses, using digital currencies and Stablecoins in financial operations.
2
352
·
--
Bullish
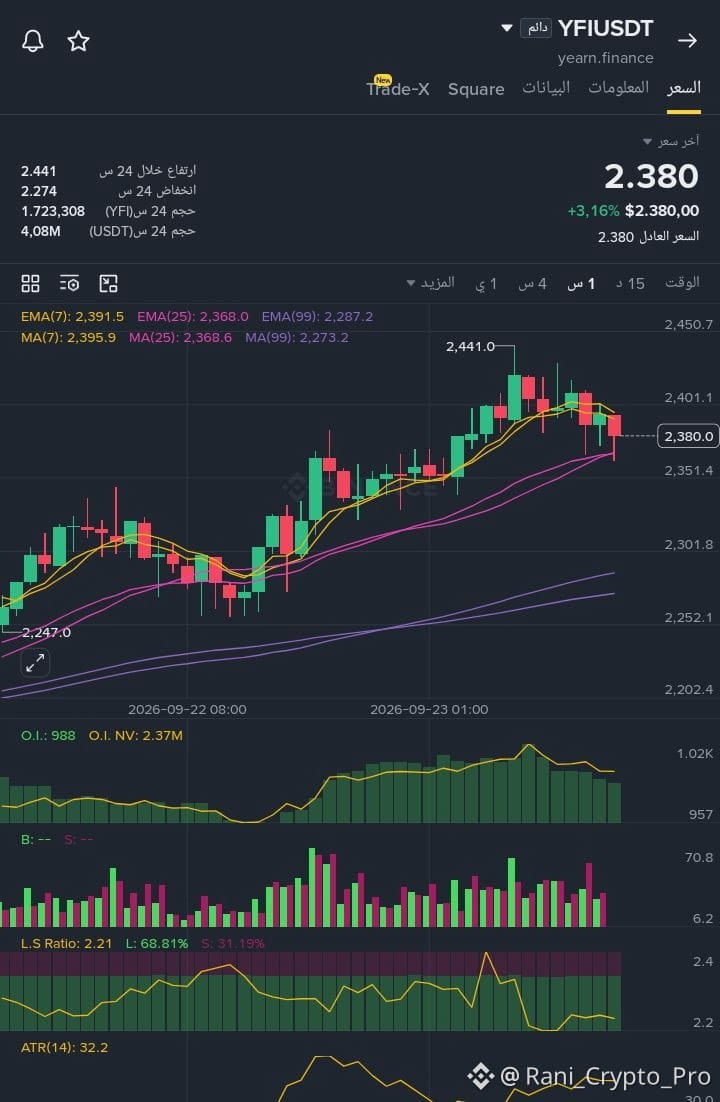
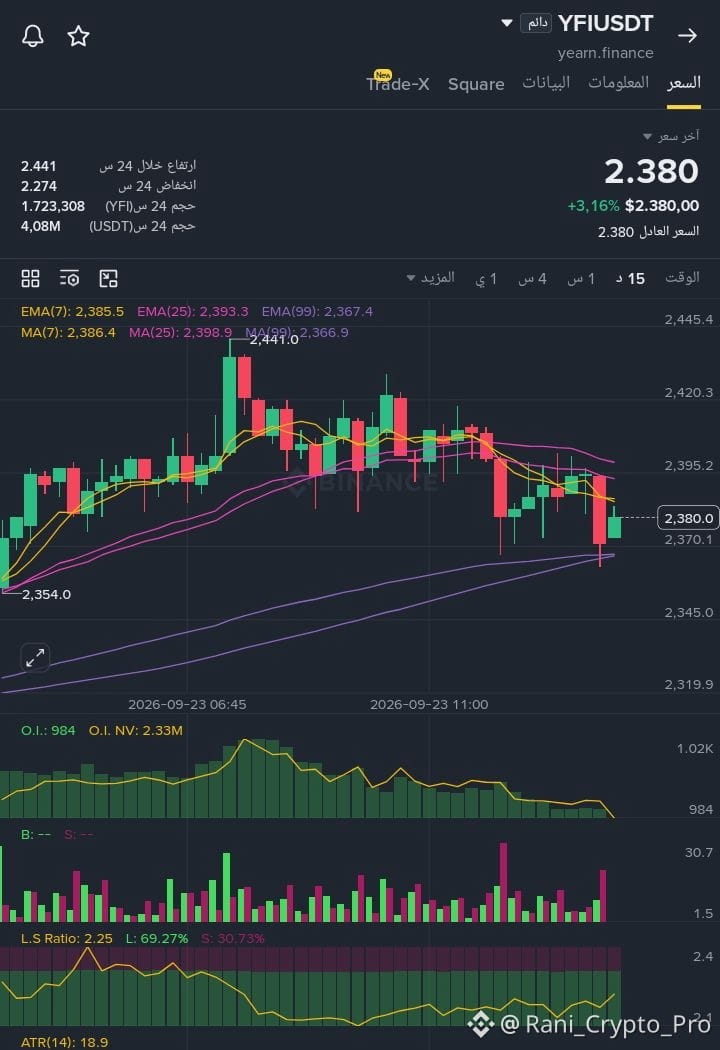
YFI$/USDT — Quick review
$YFI is currently moving near $2.38 after reaching $2.441.
🔹 The larger timeframes still support the uptrend, and the price is above key moving averages.
🔹 But on 15m and 1h, a correction and short-term selling pressure has appeared.
🔹 The 2.367–2.38$ zone is very important; holding it may push the price toward $2.395–$2.41, then test $2.441.
🔹 A break below $2.367 could open the door for a correction toward $2.33, then $2.29.
🔹 The Long ratio is relatively high, so be cautious about liquidating buy positions if support breaks.
Conclusion: The overall trend hasn’t been broken, but the price is now in an important test zone; it’s best to monitor confirmation of support or reclaiming resistance rather than chasing the move.
$YFI
l
{future}(YFIUSDT)
YFI$/USDT — Quick review
$YFI is currently moving near $2.38 after reaching $2.441.
🔹 The larger timeframes still support the uptrend, and the price is above key moving averages.
🔹 But on 15m and 1h, a correction and short-term selling pressure has appeared.
🔹 The 2.367–2.38$ zone is very important; holding it may push the price toward $2.395–$2.41, then test $2.441.
🔹 A break below $2.367 could open the door for a correction toward $2.33, then $2.29.
🔹 The Long ratio is relatively high, so be cautious about liquidating buy positions if support breaks.
Conclusion: The overall trend hasn’t been broken, but the price is now in an important test zone; it’s best to monitor confirmation of support or reclaiming resistance rather than chasing the move.
$YFI
l
$YFI is currently moving near $2.38 after reaching $2.441.
🔹 The larger timeframes still support the uptrend, and the price is above key moving averages.
🔹 But on 15m and 1h, a correction and short-term selling pressure has appeared.
🔹 The 2.367–2.38$ zone is very important; holding it may push the price toward $2.395–$2.41, then test $2.441.
🔹 A break below $2.367 could open the door for a correction toward $2.33, then $2.29.
🔹 The Long ratio is relatively high, so be cautious about liquidating buy positions if support breaks.
Conclusion: The overall trend hasn’t been broken, but the price is now in an important test zone; it’s best to monitor confirmation of support or reclaiming resistance rather than chasing the move.
$YFI
l
57
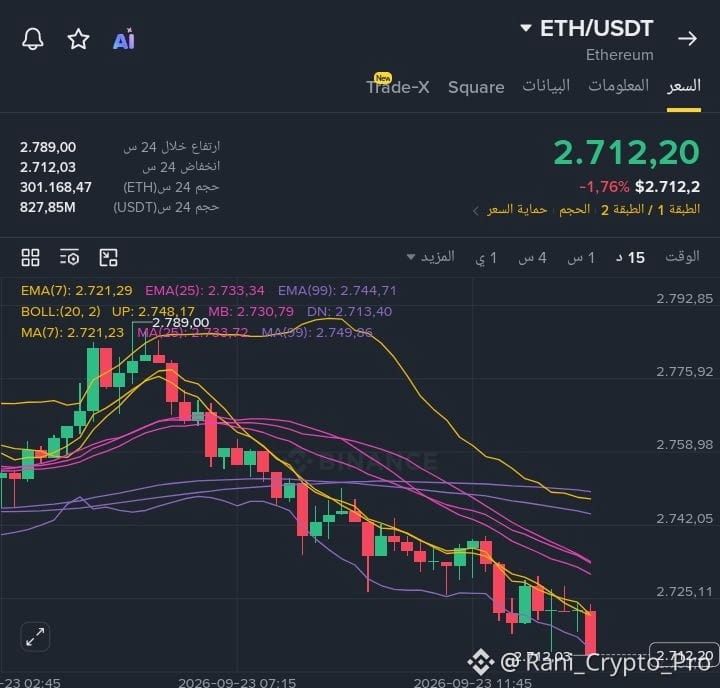
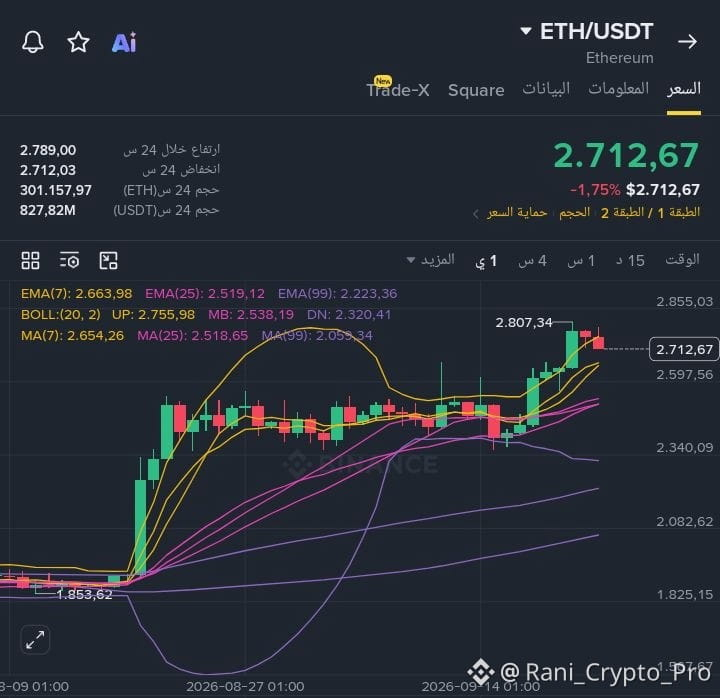
Ethereum near the 2712$ level, with sell pressure visible on short timeframes, while the price remains below key moving averages and the MACD is bearish.
📊 The money flow is also leaning toward selling: 🔴 Sell: 308.51K ETH
🟢 Buy: 295.56K ETH
➡️ Net flow: about -12.95K ETH
However ⚠️ indicators such as RSI and Williams %R have entered oversold zones, so a temporary rebound remains possible before the next move is determined.
🔻 A break of support could open the door for further downside.
🔺 Meanwhile, reclaiming the lost areas could provide an opportunity for a rebound.
The conflict is clear right now: sellers are applying pressure, but $ETH has reached an area that requires caution for a sudden rebound.
{future}(ETHUSDT)
Ethereum near the 2712$ level, with sell pressure visible on short timeframes, while the price remains below key moving averages and the MACD is bearish.
📊 The money flow is also leaning toward selling: 🔴 Sell: 308.51K ETH
🟢 Buy: 295.56K ETH
➡️ Net flow: about -12.95K ETH
However ⚠️ indicators such as RSI and Williams %R have entered oversold zones, so a temporary rebound remains possible before the next move is determined.
🔻 A break of support could open the door for further downside.
🔺 Meanwhile, reclaiming the lost areas could provide an opportunity for a rebound.
The conflict is clear right now: sellers are applying pressure, but $ETH has reached an area that requires caution for a sudden rebound.
📊 The money flow is also leaning toward selling: 🔴 Sell: 308.51K ETH
🟢 Buy: 295.56K ETH
➡️ Net flow: about -12.95K ETH
However ⚠️ indicators such as RSI and Williams %R have entered oversold zones, so a temporary rebound remains possible before the next move is determined.
🔻 A break of support could open the door for further downside.
🔺 Meanwhile, reclaiming the lost areas could provide an opportunity for a rebound.
The conflict is clear right now: sellers are applying pressure, but $ETH has reached an area that requires caution for a sudden rebound.
99
BCH$/USDT | Analysis + Follow-up Trade
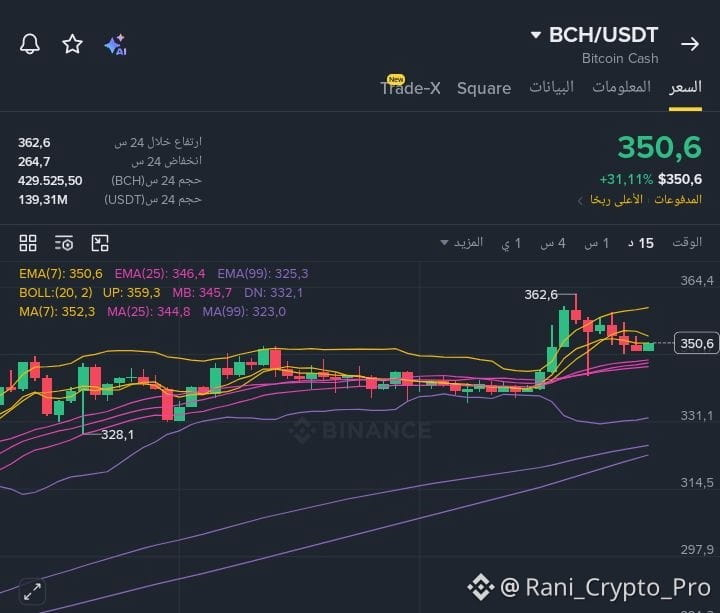
After the strong rally from the 314$ zone up to the 350–362$ area, BCH is now facing a crucial zone.
📊 Bullish Scenario:
If the price holds above 350–353$ and then breaks 362$ with clear trading volume, I will watch:
🎯 Target 1: 370$
🎯 Target 2: 375$
🎯 Target 3: 385$
💰 Suggested Spot Trade
Entry: 348–352$
Stop Loss: 339$
TP1: 370$
TP2: 375$
TP3: 385$
⚠️ If BCH loses the 339–340$ zone, cancel the entry scenario and wait for a lower support area instead of chasing the price.
Note: This is an educational hypothetical trade and not a financial recommendation. It’s better not to enter with your full capital, especially after a fast rally.
BCH is now up against an important test: will it hold above 350$ and return to retest 362$?
$BCH
{spot}(BCHUSDT)
BCH$/USDT | Analysis + Follow-up Trade
After the strong rally from the 314$ zone up to the 350–362$ area, BCH is now facing a crucial zone.
📊 Bullish Scenario:
If the price holds above 350–353$ and then breaks 362$ with clear trading volume, I will watch:
🎯 Target 1: 370$
🎯 Target 2: 375$
🎯 Target 3: 385$
💰 Suggested Spot Trade
Entry: 348–352$
Stop Loss: 339$
TP1: 370$
TP2: 375$
TP3: 385$
⚠️ If BCH loses the 339–340$ zone, cancel the entry scenario and wait for a lower support area instead of chasing the price.
Note: This is an educational hypothetical trade and not a financial recommendation. It’s better not to enter with your full capital, especially after a fast rally.
BCH is now up against an important test: will it hold above 350$ and return to retest 362$?
$BCH
After the strong rally from the 314$ zone up to the 350–362$ area, BCH is now facing a crucial zone.
📊 Bullish Scenario:
If the price holds above 350–353$ and then breaks 362$ with clear trading volume, I will watch:
🎯 Target 1: 370$
🎯 Target 2: 375$
🎯 Target 3: 385$
💰 Suggested Spot Trade
Entry: 348–352$
Stop Loss: 339$
TP1: 370$
TP2: 375$
TP3: 385$
⚠️ If BCH loses the 339–340$ zone, cancel the entry scenario and wait for a lower support area instead of chasing the price.
Note: This is an educational hypothetical trade and not a financial recommendation. It’s better not to enter with your full capital, especially after a fast rally.
BCH is now up against an important test: will it hold above 350$ and return to retest 362$?
$BCH
82
🟢 ALICE$ /USDT | Technical Analysis
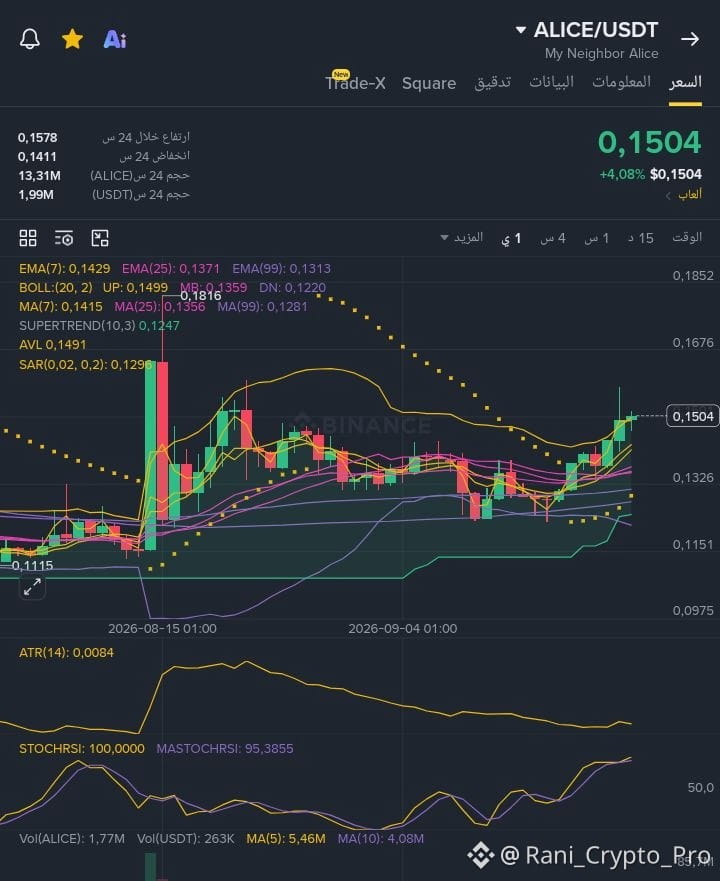
ALICE is currently trading near the 0.1504 USDT level, with a rise of about 4.08%. The technical picture across multiple timeframes suggests continued bullish momentum.
📊 On the short timeframe:
Price is above the EMA7, EMA25, and EMA99.
MACD is in positive territory.
RSI is around 60 on the 15-minute timeframe, indicating buying momentum without strong overbought conditions.
StochRSI is elevated, so the possibility of a pause or a short pullback remains.
📈 On the higher timeframes:
The trend is still bullish, and the price is holding above key moving averages, while OBV shows improvement in trading volume during the up move.
💰 Flows: Flow data shown on Binance indicates buy activity, with total buy orders around 13.66M versus 12.82M for sell orders in the snapshot.
🎯 Key levels: 🔴 Resistance: 0.1515 – 0.1520
🚀 A breakout with strong volume could open the way to monitor 0.1538, then 0.1578.
🟢 Near support: 0.1490 – 0.1485
🟢 Stronger support: 0.1470 – 0.1465
🟢 Important support on the higher timeframe: 0.1420 – 0.1415
⚠️ Despite the strength of the trend, some indicators on the higher timeframes are high, so entering after a sharp rise may be followed by a correction.
This is a technical analysis and personal follow-up, not financial advice.
$ALICE
{future}(ALICEUSDT)
🟢 ALICE$ /USDT | Technical Analysis
ALICE is currently trading near the 0.1504 USDT level, with a rise of about 4.08%. The technical picture across multiple timeframes suggests continued bullish momentum.
📊 On the short timeframe:
Price is above the EMA7, EMA25, and EMA99.
MACD is in positive territory.
RSI is around 60 on the 15-minute timeframe, indicating buying momentum without strong overbought conditions.
StochRSI is elevated, so the possibility of a pause or a short pullback remains.
📈 On the higher timeframes:
The trend is still bullish, and the price is holding above key moving averages, while OBV shows improvement in trading volume during the up move.
💰 Flows: Flow data shown on Binance indicates buy activity, with total buy orders around 13.66M versus 12.82M for sell orders in the snapshot.
🎯 Key levels: 🔴 Resistance: 0.1515 – 0.1520
🚀 A breakout with strong volume could open the way to monitor 0.1538, then 0.1578.
🟢 Near support: 0.1490 – 0.1485
🟢 Stronger support: 0.1470 – 0.1465
🟢 Important support on the higher timeframe: 0.1420 – 0.1415
⚠️ Despite the strength of the trend, some indicators on the higher timeframes are high, so entering after a sharp rise may be followed by a correction.
This is a technical analysis and personal follow-up, not financial advice.
$ALICE
ALICE is currently trading near the 0.1504 USDT level, with a rise of about 4.08%. The technical picture across multiple timeframes suggests continued bullish momentum.
📊 On the short timeframe:
Price is above the EMA7, EMA25, and EMA99.
MACD is in positive territory.
RSI is around 60 on the 15-minute timeframe, indicating buying momentum without strong overbought conditions.
StochRSI is elevated, so the possibility of a pause or a short pullback remains.
📈 On the higher timeframes:
The trend is still bullish, and the price is holding above key moving averages, while OBV shows improvement in trading volume during the up move.
💰 Flows: Flow data shown on Binance indicates buy activity, with total buy orders around 13.66M versus 12.82M for sell orders in the snapshot.
🎯 Key levels: 🔴 Resistance: 0.1515 – 0.1520
🚀 A breakout with strong volume could open the way to monitor 0.1538, then 0.1578.
🟢 Near support: 0.1490 – 0.1485
🟢 Stronger support: 0.1470 – 0.1465
🟢 Important support on the higher timeframe: 0.1420 – 0.1415
⚠️ Despite the strength of the trend, some indicators on the higher timeframes are high, so entering after a sharp rise may be followed by a correction.
This is a technical analysis and personal follow-up, not financial advice.
$ALICE
156
#AIStocksWhatNext
Artificial Intelligence Stocks: Is the Market Buying the Future… or Paying Upfront?
There’s a common mistake when following the AI sector: focusing only on the power of the technology.
The most important question isn’t: Will AI change the economy?
This transformation has already begun.
The hardest question is:
Will the future profits and revenues of AI-linked companies be enough to justify their current valuations?
🔹 Infrastructure: Data centers, chips, processors, and networks require massive investments. Continued demand supports the entire chain of companies, but you also need to monitor the cost of these expansions and the returns they generate.
🔹 Real Revenue: Launching a new AI model is one thing; turning it into a widely used product that generates recurring revenue is something entirely different.
🔹 Growth vs. Valuation: A company may achieve strong growth, but if the stock price has already priced in huge growth expectations, any slowdown could quickly change the market’s view.
🔹 The Real Standard: For me, the strength of an AI story isn’t measured only by the technology, but by companies’ ability to turn massive investment into sustainable revenues, profits, and cash flows.
#AIStocksWhatNext
Artificial Intelligence Stocks: Is the Market Buying the Future… or Paying Upfront?
There’s a common mistake when following the AI sector: focusing only on the power of the technology.
The most important question isn’t: Will AI change the economy?
This transformation has already begun.
The hardest question is:
Will the future profits and revenues of AI-linked companies be enough to justify their current valuations?
🔹 Infrastructure: Data centers, chips, processors, and networks require massive investments. Continued demand supports the entire chain of companies, but you also need to monitor the cost of these expansions and the returns they generate.
🔹 Real Revenue: Launching a new AI model is one thing; turning it into a widely used product that generates recurring revenue is something entirely different.
🔹 Growth vs. Valuation: A company may achieve strong growth, but if the stock price has already priced in huge growth expectations, any slowdown could quickly change the market’s view.
🔹 The Real Standard: For me, the strength of an AI story isn’t measured only by the technology, but by companies’ ability to turn massive investment into sustainable revenues, profits, and cash flows.
Artificial Intelligence Stocks: Is the Market Buying the Future… or Paying Upfront?
There’s a common mistake when following the AI sector: focusing only on the power of the technology.
The most important question isn’t: Will AI change the economy?
This transformation has already begun.
The hardest question is:
Will the future profits and revenues of AI-linked companies be enough to justify their current valuations?
🔹 Infrastructure: Data centers, chips, processors, and networks require massive investments. Continued demand supports the entire chain of companies, but you also need to monitor the cost of these expansions and the returns they generate.
🔹 Real Revenue: Launching a new AI model is one thing; turning it into a widely used product that generates recurring revenue is something entirely different.
🔹 Growth vs. Valuation: A company may achieve strong growth, but if the stock price has already priced in huge growth expectations, any slowdown could quickly change the market’s view.
🔹 The Real Standard: For me, the strength of an AI story isn’t measured only by the technology, but by companies’ ability to turn massive investment into sustainable revenues, profits, and cash flows.
76
Entry zones I’m monitoring🟢 Entry zones I’m monitoring$SHOP
The zone
Handling
145.5–146.5$
First entry, if there is a clear bounce
143.5–144.5$
Stronger entry if a pullback happens
140–141.5$
A very important zone; suitable for rebuilding the position if you hold on to it
149.8–150.5$
I don’t chase it directly; it’s only suitable if there is a breakout with holding, then a retest
The closest area to me right now: 145.5–146.5$, because the EMA7 on the hourly timeframe is close to 143.84 and the price is still strongly above the moving averages.
Entry zones I’m monitoring
🟢 Entry zones I’m monitoring$SHOP
The zone
Handling
145.5–146.5$
First entry, if there is a clear bounce
143.5–144.5$
Stronger entry if a pullback happens
140–141.5$
A very important zone; suitable for rebuilding the position if you hold on to it
149.8–150.5$
I don’t chase it directly; it’s only suitable if there is a breakout with holding, then a retest
The closest area to me right now: 145.5–146.5$, because the EMA7 on the hourly timeframe is close to 143.84 and the price is still strongly above the moving averages.
The zone
Handling
145.5–146.5$
First entry, if there is a clear bounce
143.5–144.5$
Stronger entry if a pullback happens
140–141.5$
A very important zone; suitable for rebuilding the position if you hold on to it
149.8–150.5$
I don’t chase it directly; it’s only suitable if there is a breakout with holding, then a retest
The closest area to me right now: 145.5–146.5$, because the EMA7 on the hourly timeframe is close to 143.84 and the price is still strongly above the moving averages.
96
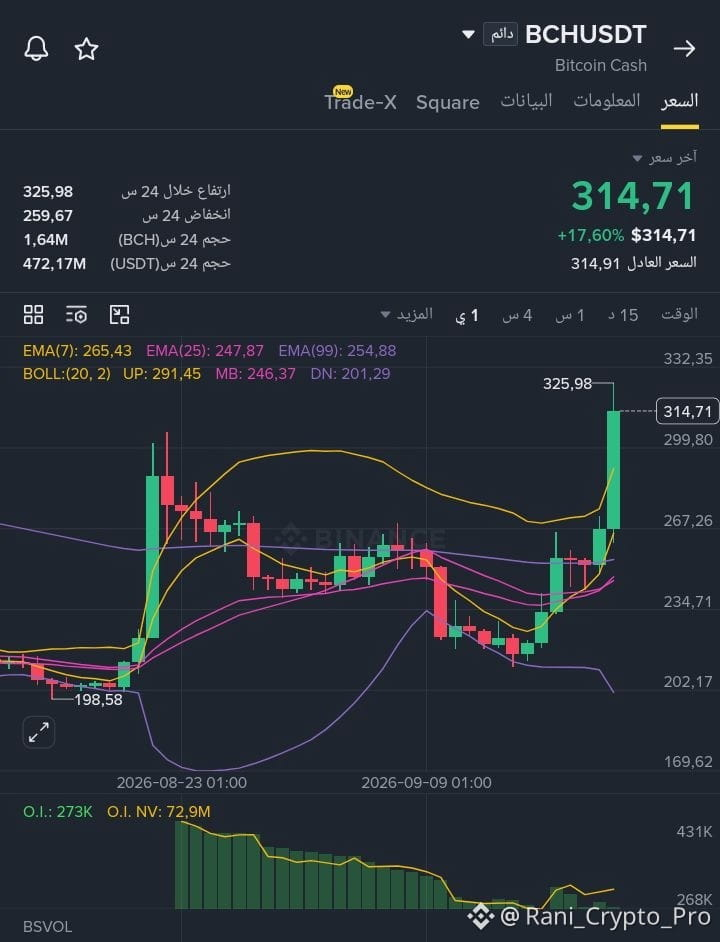
Summary $BCH now
Trend: 🟢 strongly bullish
Momentum: 🔥 very strong
OI: 🔥 rising strongly
Longs: outperforming 62.56%
RSI/StochRSI: 🔴 overbought
Resistance: 326$
First important support: 299–300$
Deeper support: 289–291$
The signal I will be watching more than RSI right now is price + OI + volume together:
If price rises while OI and volume continue → that indicates continued position openings and momentum.
If price stalls near 326 while OI keeps rising → risk of crowded positions increases and Longs get trapped more.
If price starts to fall and OI drops quickly along with it → this tends to indicate exits/liquidations, not just a normal pullback.
{future}(BCHUSDT)
Summary $BCH now
Trend: 🟢 strongly bullish
Momentum: 🔥 very strong
OI: 🔥 rising strongly
Longs: outperforming 62.56%
RSI/StochRSI: 🔴 overbought
Resistance: 326$
First important support: 299–300$
Deeper support: 289–291$
The signal I will be watching more than RSI right now is price + OI + volume together:
If price rises while OI and volume continue → that indicates continued position openings and momentum.
If price stalls near 326 while OI keeps rising → risk of crowded positions increases and Longs get trapped more.
If price starts to fall and OI drops quickly along with it → this tends to indicate exits/liquidations, not just a normal pullback.
Trend: 🟢 strongly bullish
Momentum: 🔥 very strong
OI: 🔥 rising strongly
Longs: outperforming 62.56%
RSI/StochRSI: 🔴 overbought
Resistance: 326$
First important support: 299–300$
Deeper support: 289–291$
The signal I will be watching more than RSI right now is price + OI + volume together:
If price rises while OI and volume continue → that indicates continued position openings and momentum.
If price stalls near 326 while OI keeps rising → risk of crowded positions increases and Longs get trapped more.
If price starts to fall and OI drops quickly along with it → this tends to indicate exits/liquidations, not just a normal pullback.
153
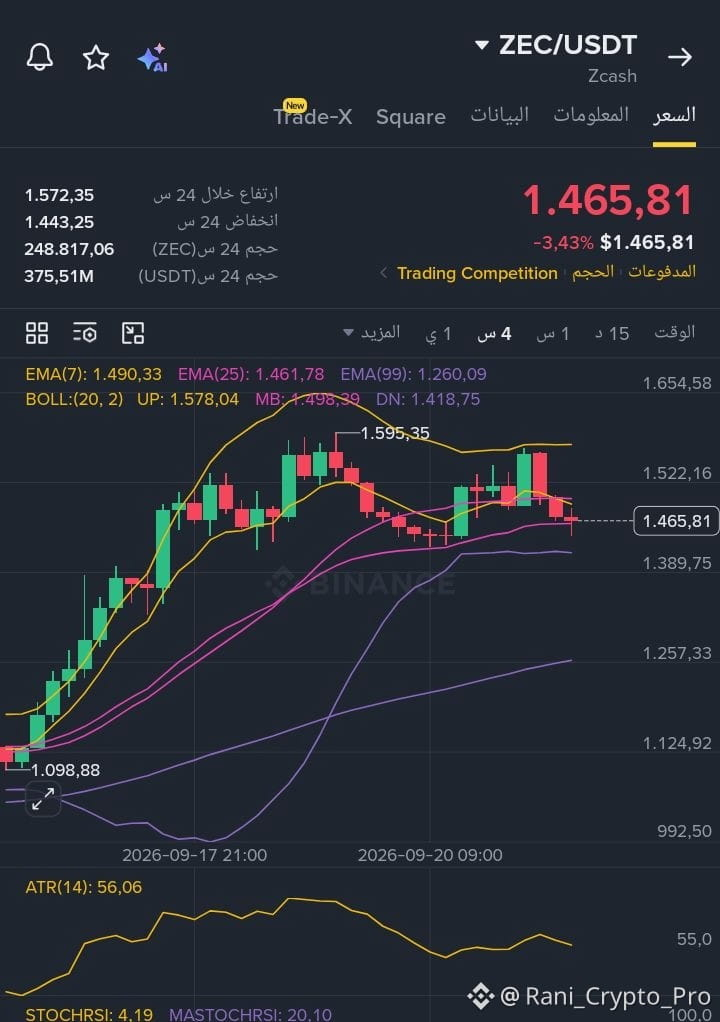
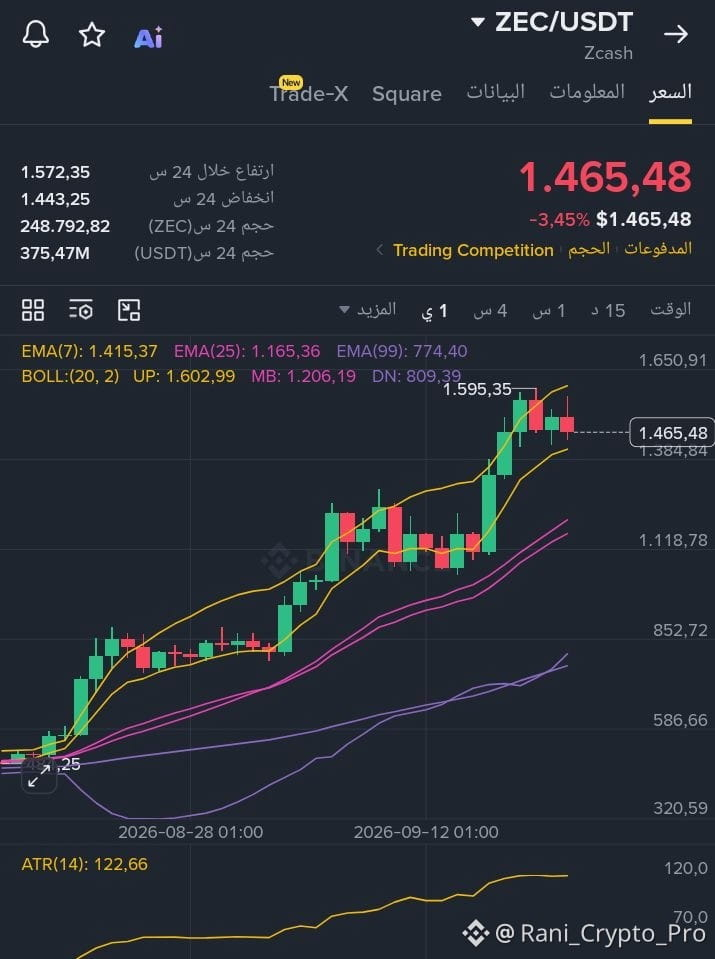
📊 ZEC$/USDT — Reading the timeframes like a pro
The mistake many traders make is that they see 1H or 4H in red and think the trend has ended.
But the timeframe must not be read separately from the larger timeframe.
🟢 The daily chart is the foundation: as long as the daily structure is still bullish and the price holds the key support zones, the drop on smaller timeframes is technically classified as a bearish correction / a downward bounce within the uptrend—not a full reversal.
🔸 4H: It shows us the depth of the correction and the support areas where the decline may stop.
🔸 1H: We watch it to know when the correction starts losing strength.
🔸 15M: We use it to time the entry after a bounce signal appears.
🎯 The trade
LONG: 1460–1480$
SL: 1425–1430$
TP1: 1520$
TP2: 1560$
TP3: 1590–1600$
💡 The important reason:
The market doesn’t move in a straight line. Even a strong uptrend needs pullbacks to take profit and rebalance liquidity. Therefore, a drop on 15M or 1H shouldn’t worry us as long as it hasn’t broken the structure and the important supports on the higher timeframe.
🔥 In short:
The daily chart defines the direction, 4H defines the correction zone, and 1H & 15M define the timing of the return.
That’s why we don’t judge the ZEC direction based on only a bearish candle on a small timeframe.
$ZEC
{future}(ZECUSDT)
📊 ZEC$/USDT — Reading the timeframes like a pro
The mistake many traders make is that they see 1H or 4H in red and think the trend has ended.
But the timeframe must not be read separately from the larger timeframe.
🟢 The daily chart is the foundation: as long as the daily structure is still bullish and the price holds the key support zones, the drop on smaller timeframes is technically classified as a bearish correction / a downward bounce within the uptrend—not a full reversal.
🔸 4H: It shows us the depth of the correction and the support areas where the decline may stop.
🔸 1H: We watch it to know when the correction starts losing strength.
🔸 15M: We use it to time the entry after a bounce signal appears.
🎯 The trade
LONG: 1460–1480$
SL: 1425–1430$
TP1: 1520$
TP2: 1560$
TP3: 1590–1600$
💡 The important reason:
The market doesn’t move in a straight line. Even a strong uptrend needs pullbacks to take profit and rebalance liquidity. Therefore, a drop on 15M or 1H shouldn’t worry us as long as it hasn’t broken the structure and the important supports on the higher timeframe.
🔥 In short:
The daily chart defines the direction, 4H defines the correction zone, and 1H & 15M define the timing of the return.
That’s why we don’t judge the ZEC direction based on only a bearish candle on a small timeframe.
$ZEC
The mistake many traders make is that they see 1H or 4H in red and think the trend has ended.
But the timeframe must not be read separately from the larger timeframe.
🟢 The daily chart is the foundation: as long as the daily structure is still bullish and the price holds the key support zones, the drop on smaller timeframes is technically classified as a bearish correction / a downward bounce within the uptrend—not a full reversal.
🔸 4H: It shows us the depth of the correction and the support areas where the decline may stop.
🔸 1H: We watch it to know when the correction starts losing strength.
🔸 15M: We use it to time the entry after a bounce signal appears.
🎯 The trade
LONG: 1460–1480$
SL: 1425–1430$
TP1: 1520$
TP2: 1560$
TP3: 1590–1600$
💡 The important reason:
The market doesn’t move in a straight line. Even a strong uptrend needs pullbacks to take profit and rebalance liquidity. Therefore, a drop on 15M or 1H shouldn’t worry us as long as it hasn’t broken the structure and the important supports on the higher timeframe.
🔥 In short:
The daily chart defines the direction, 4H defines the correction zone, and 1H & 15M define the timing of the return.
That’s why we don’t judge the ZEC direction based on only a bearish candle on a small timeframe.
$ZEC
139
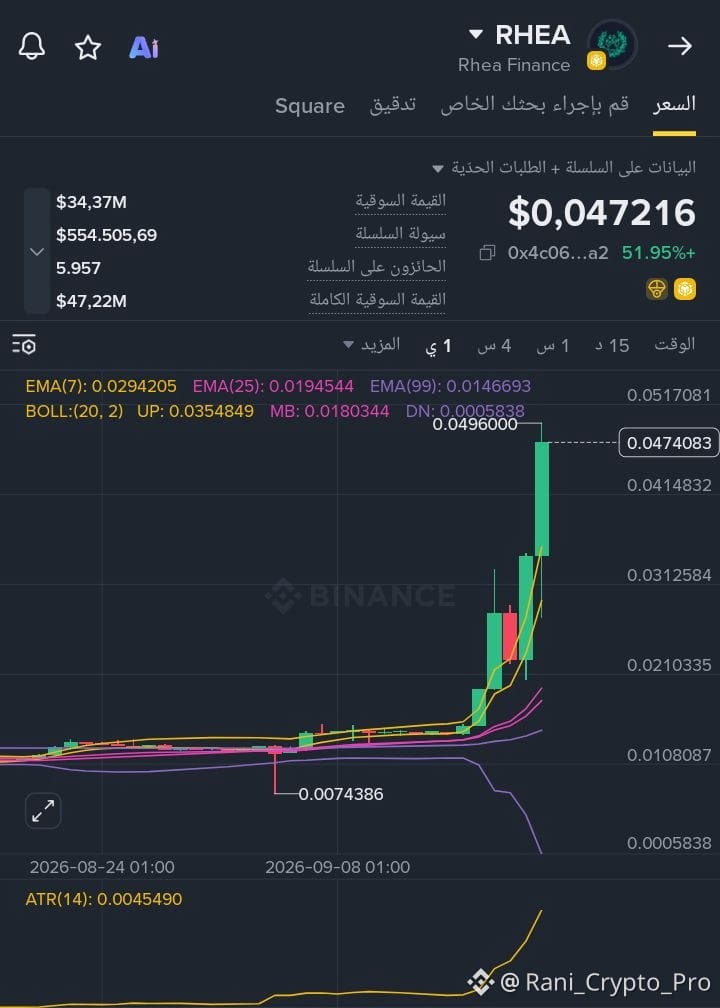
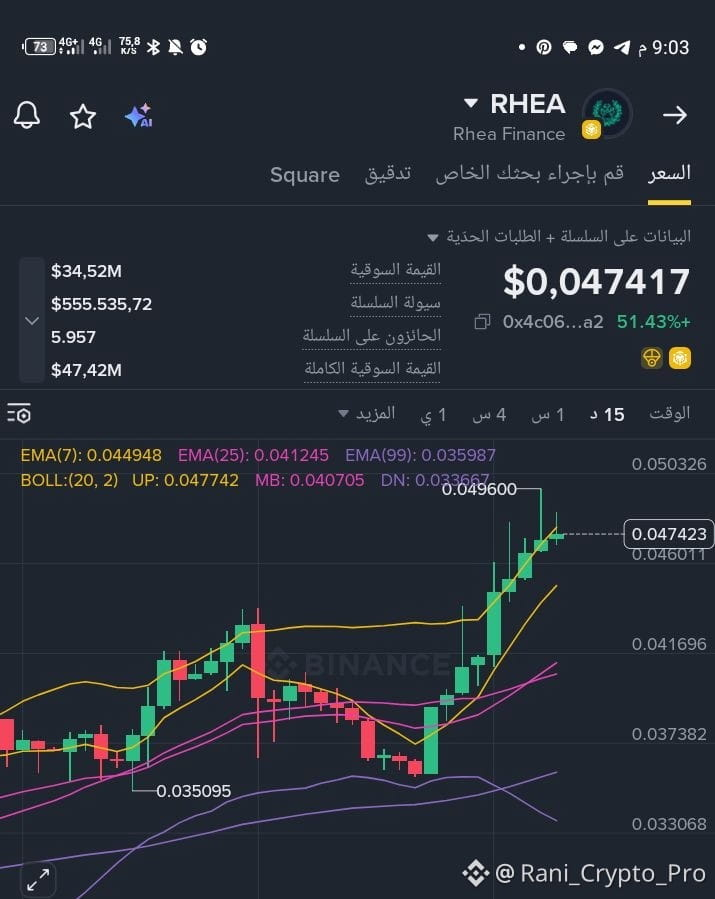
15 minutes: Bullish trend$RHEA; the price is above the EMA7/25/99, and the MACD is positive.
1 hour: Strong upward move with consecutive breakouts, and very high momentum.
4 hours: The trend clearly turned bullish, and the price is above the moving averages.
Daily timeframe: The bullish move is very strong, with rising volume and a positive MACD.
Higher timeframe: The price has exited the previous consolidation area and broke through key levels, supporting the continuation of the uptrend.
⚠️ Important point: The upward move is strong, but RSI and Stoch RSI are in very overbought territory, and the price is close to the upper Bollinger Band; therefore the likelihood of a pullback/short cooldown before continuing the move has increased.
Technical summary:
🟢 Overall trend: Bullish across all shown timeframes
🟢 Momentum: Strong
🟢 MACD: Positive
🟢 Volume: Supports the move
🔴 Overbought: Very high
🔴 Volatility: Very high
The most important current level is 0.0460–0.0470; holding above it keeps the bullish structure strong, while breaking 0.043–0.044 could open the way for a deeper correction.
{alpha}(560x4c067de26475e1cefee8b8d1f6e2266b33a2372e)
15 minutes: Bullish trend$RHEA; the price is above the EMA7/25/99, and the MACD is positive.
1 hour: Strong upward move with consecutive breakouts, and very high momentum.
4 hours: The trend clearly turned bullish, and the price is above the moving averages.
Daily timeframe: The bullish move is very strong, with rising volume and a positive MACD.
Higher timeframe: The price has exited the previous consolidation area and broke through key levels, supporting the continuation of the uptrend.
⚠️ Important point: The upward move is strong, but RSI and Stoch RSI are in very overbought territory, and the price is close to the upper Bollinger Band; therefore the likelihood of a pullback/short cooldown before continuing the move has increased.
Technical summary:
🟢 Overall trend: Bullish across all shown timeframes
🟢 Momentum: Strong
🟢 MACD: Positive
🟢 Volume: Supports the move
🔴 Overbought: Very high
🔴 Volatility: Very high
The most important current level is 0.0460–0.0470; holding above it keeps the bullish structure strong, while breaking 0.043–0.044 could open the way for a deeper correction.
1 hour: Strong upward move with consecutive breakouts, and very high momentum.
4 hours: The trend clearly turned bullish, and the price is above the moving averages.
Daily timeframe: The bullish move is very strong, with rising volume and a positive MACD.
Higher timeframe: The price has exited the previous consolidation area and broke through key levels, supporting the continuation of the uptrend.
⚠️ Important point: The upward move is strong, but RSI and Stoch RSI are in very overbought territory, and the price is close to the upper Bollinger Band; therefore the likelihood of a pullback/short cooldown before continuing the move has increased.
Technical summary:
🟢 Overall trend: Bullish across all shown timeframes
🟢 Momentum: Strong
🟢 MACD: Positive
🟢 Volume: Supports the move
🔴 Overbought: Very high
🔴 Volatility: Very high
The most important current level is 0.0460–0.0470; holding above it keeps the bullish structure strong, while breaking 0.043–0.044 could open the way for a deeper correction.
133
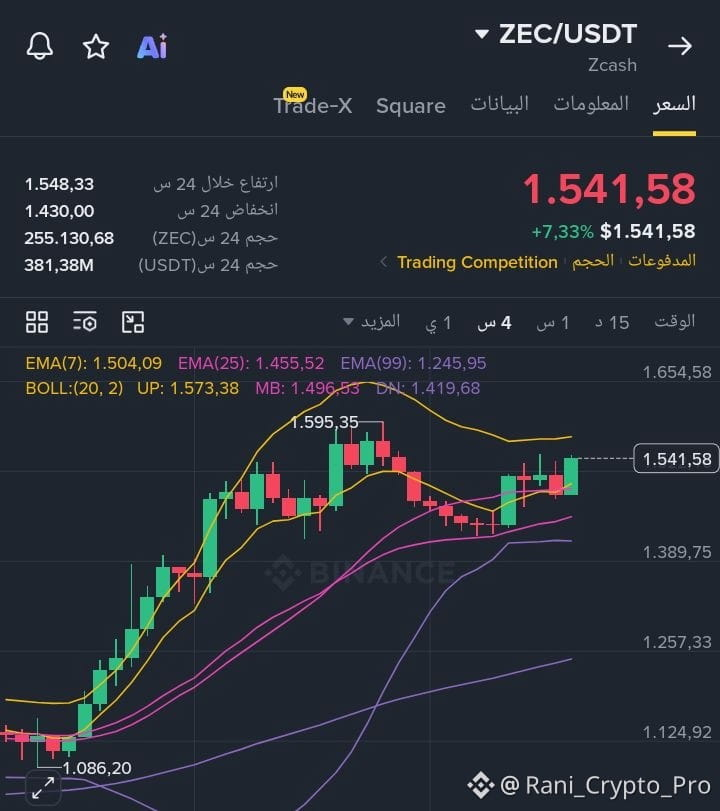
15 minutes: Price 1544 above EMA7 = 1529 and EMA25 = 1517 and EMA99 = 1500 → clear bullish momentum.
1 hour: Price 1542 above EMA7 = 1524 and EMA25 = 1503 and EMA99 = 1453, and MACD is positive.
4 hours: Price above EMA7 = 1504 and EMA25 = 1455. The structure is still bullish, although MACD has not turned fully positive yet.
Daily: Very strong trend; price 1538 vs EMA7 at 1432, and MACD +25.04.
Flows: In the last 4 hours buys are greater than sells, and the total of the last 5 days for the large flow is +72,521 ZEC. The last 24 hours is also positive by about +3,839 $ZEC .
Very important levels:
🟢 1548 = the current resistance.
Breaking it and holding above it → 1570 then 1595.
🟡 1520–1515 = nearby support.
As long as price stays above it, the upside advantage remains.
🔴 1500–1490 = danger zone; losing it clearly weakens the uptrend.
But pay attention: 15-minute Stoch RSI is around ~93 and RSI ~69, so price is stretched in the short term and may pull back before attempting to break 1548.
Direct conclusion:
The direction I’m choosing right now: 🟢 up.
The most important target ahead is 1595, but I don’t like chasing buys at 1545 if 1548 isn’t broken; because a pullback toward 1520–1515 would be normal within an uptrend.
ZEC moved from defending 1466 to now testing 1548; this is a very important point in the scenario change.
$ZEC
{future}(ZECUSDT)
15 minutes: Price 1544 above EMA7 = 1529 and EMA25 = 1517 and EMA99 = 1500 → clear bullish momentum.
1 hour: Price 1542 above EMA7 = 1524 and EMA25 = 1503 and EMA99 = 1453, and MACD is positive.
4 hours: Price above EMA7 = 1504 and EMA25 = 1455. The structure is still bullish, although MACD has not turned fully positive yet.
Daily: Very strong trend; price 1538 vs EMA7 at 1432, and MACD +25.04.
Flows: In the last 4 hours buys are greater than sells, and the total of the last 5 days for the large flow is +72,521 ZEC. The last 24 hours is also positive by about +3,839 $ZEC .
Very important levels:
🟢 1548 = the current resistance.
Breaking it and holding above it → 1570 then 1595.
🟡 1520–1515 = nearby support.
As long as price stays above it, the upside advantage remains.
🔴 1500–1490 = danger zone; losing it clearly weakens the uptrend.
But pay attention: 15-minute Stoch RSI is around ~93 and RSI ~69, so price is stretched in the short term and may pull back before attempting to break 1548.
Direct conclusion:
The direction I’m choosing right now: 🟢 up.
The most important target ahead is 1595, but I don’t like chasing buys at 1545 if 1548 isn’t broken; because a pullback toward 1520–1515 would be normal within an uptrend.
ZEC moved from defending 1466 to now testing 1548; this is a very important point in the scenario change.
$ZEC
1 hour: Price 1542 above EMA7 = 1524 and EMA25 = 1503 and EMA99 = 1453, and MACD is positive.
4 hours: Price above EMA7 = 1504 and EMA25 = 1455. The structure is still bullish, although MACD has not turned fully positive yet.
Daily: Very strong trend; price 1538 vs EMA7 at 1432, and MACD +25.04.
Flows: In the last 4 hours buys are greater than sells, and the total of the last 5 days for the large flow is +72,521 ZEC. The last 24 hours is also positive by about +3,839 $ZEC .
Very important levels:
🟢 1548 = the current resistance.
Breaking it and holding above it → 1570 then 1595.
🟡 1520–1515 = nearby support.
As long as price stays above it, the upside advantage remains.
🔴 1500–1490 = danger zone; losing it clearly weakens the uptrend.
But pay attention: 15-minute Stoch RSI is around ~93 and RSI ~69, so price is stretched in the short term and may pull back before attempting to break 1548.
Direct conclusion:
The direction I’m choosing right now: 🟢 up.
The most important target ahead is 1595, but I don’t like chasing buys at 1545 if 1548 isn’t broken; because a pullback toward 1520–1515 would be normal within an uptrend.
ZEC moved from defending 1466 to now testing 1548; this is a very important point in the scenario change.
$ZEC
62
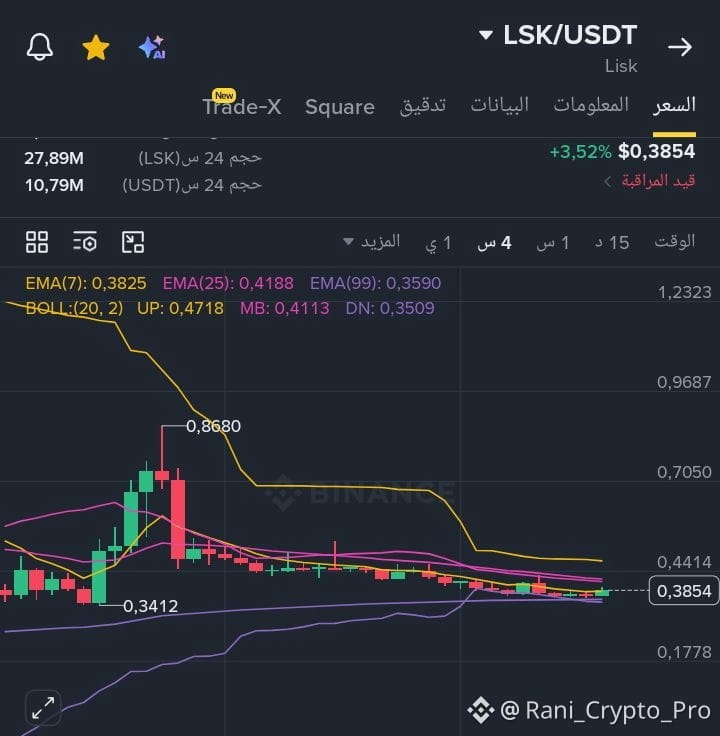
$LSK is currently trying to build a rebound after recording a bottom near $0.3642, and the price reached around $0.385.
🔹 On 15 minutes: clear improvement in momentum and positive MACD, but retracement started to appear after touching the $0.39 area.
🔹 On the hour: the price is still below EMA25 and EMA99, so the trend has not yet turned into a confirmed uptrend.
🔹 Flows: over the last 24 hours they turned positive to +347K LSK, but the bigger picture is still cautious, with a large negative flow during the past days.
🔹 Key resistance: $0.390–$0.397
🔹 Support: $0.377 then $0.364
⚠️ LSK is now in a decision zone:
A breakout and holding above $0.397 could give the rebound more strength, while losing $0.377 would bring pressure back onto the price.
Watch it… because the next move needs confirmation, not just a green candle.
$LSK is currently trying to build a rebound after recording a bottom near $0.3642, and the price reached around $0.385.
🔹 On 15 minutes: clear improvement in momentum and positive MACD, but retracement started to appear after touching the $0.39 area.
🔹 On the hour: the price is still below EMA25 and EMA99, so the trend has not yet turned into a confirmed uptrend.
🔹 Flows: over the last 24 hours they turned positive to +347K LSK, but the bigger picture is still cautious, with a large negative flow during the past days.
🔹 Key resistance: $0.390–$0.397
🔹 Support: $0.377 then $0.364
⚠️ LSK is now in a decision zone:
A breakout and holding above $0.397 could give the rebound more strength, while losing $0.377 would bring pressure back onto the price.
Watch it… because the next move needs confirmation, not just a green candle.
🔹 On 15 minutes: clear improvement in momentum and positive MACD, but retracement started to appear after touching the $0.39 area.
🔹 On the hour: the price is still below EMA25 and EMA99, so the trend has not yet turned into a confirmed uptrend.
🔹 Flows: over the last 24 hours they turned positive to +347K LSK, but the bigger picture is still cautious, with a large negative flow during the past days.
🔹 Key resistance: $0.390–$0.397
🔹 Support: $0.377 then $0.364
⚠️ LSK is now in a decision zone:
A breakout and holding above $0.397 could give the rebound more strength, while losing $0.377 would bring pressure back onto the price.
Watch it… because the next move needs confirmation, not just a green candle.
397
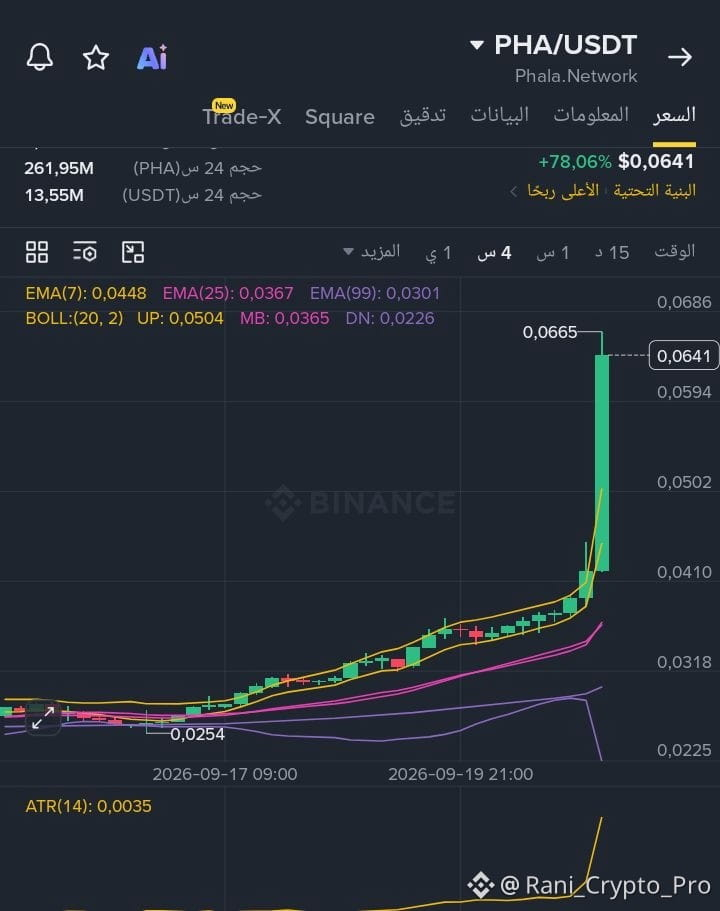
$PHA Under strict surveillance!
PHA recorded a strong surge exceeding +78%, with the price reaching the 0.064–0.0665$ range.
📊 The financial flows clearly favor buyers: total buying in the last 4 hours: 208.70M 🔴 total selling: 173.02M. And over the last 24 hours, there was a strong jump in the large inflow reaching about +31.35M.
But ⚠️ the risk is also clear: RSI and Stoch RSI are at very overbought levels, and the price has moved significantly away from the averages.
0.0665$ is the current important peak.
In case of a correction, I’m watching 0.061–0.0596$, then 0.0585$.
Summary:
The trend is bullish and the flows support buyers, but entering after this jump requires great caution, because any weakness in flows could trigger a fast correction.
{future}(PHAUSDT)
$PHA Under strict surveillance!
PHA recorded a strong surge exceeding +78%, with the price reaching the 0.064–0.0665$ range.
📊 The financial flows clearly favor buyers: total buying in the last 4 hours: 208.70M 🔴 total selling: 173.02M. And over the last 24 hours, there was a strong jump in the large inflow reaching about +31.35M.
But ⚠️ the risk is also clear: RSI and Stoch RSI are at very overbought levels, and the price has moved significantly away from the averages.
0.0665$ is the current important peak.
In case of a correction, I’m watching 0.061–0.0596$, then 0.0585$.
Summary:
The trend is bullish and the flows support buyers, but entering after this jump requires great caution, because any weakness in flows could trigger a fast correction.
PHA recorded a strong surge exceeding +78%, with the price reaching the 0.064–0.0665$ range.
📊 The financial flows clearly favor buyers: total buying in the last 4 hours: 208.70M 🔴 total selling: 173.02M. And over the last 24 hours, there was a strong jump in the large inflow reaching about +31.35M.
But ⚠️ the risk is also clear: RSI and Stoch RSI are at very overbought levels, and the price has moved significantly away from the averages.
0.0665$ is the current important peak.
In case of a correction, I’m watching 0.061–0.0596$, then 0.0585$.
Summary:
The trend is bullish and the flows support buyers, but entering after this jump requires great caution, because any weakness in flows could trigger a fast correction.
114

Article
Technical imagePrice: about $84,500 $BTC
Last peak: $85,299
15m: Uptrend; EMA7 above EMA25, but RSI ≈ 69.6 and MACD is positive with a gradual decline in momentum.
1h: RSI ≈ 87, and the price is above/around the upper Bollinger Band → clear overbought.
4h: RSI ≈ 92 and the price is above the upper Bollinger Band → very strong overbought while the uptrend remains intact.
Volume surged with the move up, then started to calm down; this matters because continuing the uptrend needs a return of volume.
Technical image
Price: about $84,500 $BTC
Last peak: $85,299
15m: Uptrend; EMA7 above EMA25, but RSI ≈ 69.6 and MACD is positive with a gradual decline in momentum.
1h: RSI ≈ 87, and the price is above/around the upper Bollinger Band → clear overbought.
4h: RSI ≈ 92 and the price is above the upper Bollinger Band → very strong overbought while the uptrend remains intact.
Volume surged with the move up, then started to calm down; this matters because continuing the uptrend needs a return of volume.
Last peak: $85,299
15m: Uptrend; EMA7 above EMA25, but RSI ≈ 69.6 and MACD is positive with a gradual decline in momentum.
1h: RSI ≈ 87, and the price is above/around the upper Bollinger Band → clear overbought.
4h: RSI ≈ 92 and the price is above the upper Bollinger Band → very strong overbought while the uptrend remains intact.
Volume surged with the move up, then started to calm down; this matters because continuing the uptrend needs a return of volume.
216
·
--
Bullish
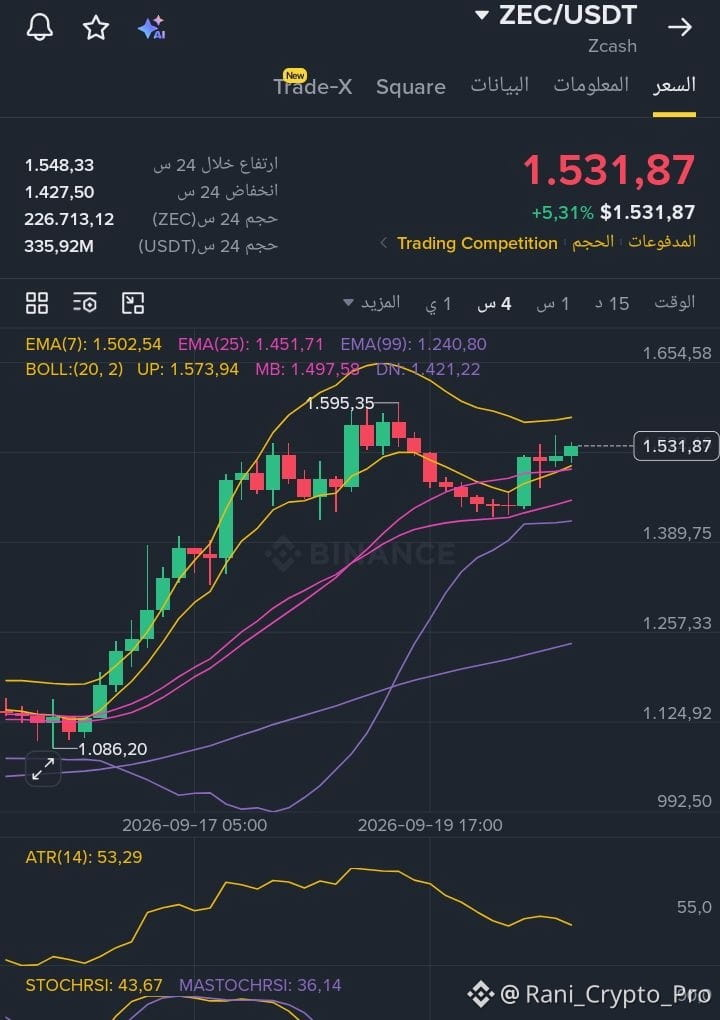
My final decision on $ZEC
🟢 Upside is the current most likely scenario.
The reason is that several things lined up:
The price 1530–1533 is above EMA7 and EMA25 on the 15m and 1h charts.
15m: MACD is still slightly negative, but improving, and Stoch RSI is rising.
1h: MACD is positive +7.25, and the price is above EMA7 ≈ 1515 and EMA25 ≈ 1490.
4h: Price 1531 is above EMA7 ≈ 1502 and EMA25 ≈ 1452, and the structure is still trending up.
Daily: The trend is very strong; price 1530 vs EMA7 ≈ 1432, and MACD +25.
Flow: In the last two hours, buys ≈ 22.55K ZEC vs sells ≈ 15.60K → net buy ≈ +6.95K.
The large 5-day flow is still +74.4K ZEC, and the last 24 hours has returned positive by about +1.24K.
⚠️ The dangerous zone right now
1548–1552 is a very direct resistance, because it’s near the 24-hour high 1548.33 and near the upper band on the shorter timeframes.
If it breaks 1552 and holds above it: ➡️ 1595 becomes the next main target.
If it fails at 1548–1552: ➡️ a pullback to 1515 is natural, then 1490–1497 as stronger support.
Summary
I’m now with the upside, not the downside. 🟢
But I don’t consider 1530 an ideal chase zone, because the price is close to 1548.
A break of 1552 = a much stronger bullish signal toward 1595.
Losing 1515 = a warning of a deeper correction.
Most importantly: the bigger trend is still strongly bullish, while only the short-term move needs watching at 1548–1552.
{future}(ZECUSDT)
My final decision on $ZEC
🟢 Upside is the current most likely scenario.
The reason is that several things lined up:
The price 1530–1533 is above EMA7 and EMA25 on the 15m and 1h charts.
15m: MACD is still slightly negative, but improving, and Stoch RSI is rising.
1h: MACD is positive +7.25, and the price is above EMA7 ≈ 1515 and EMA25 ≈ 1490.
4h: Price 1531 is above EMA7 ≈ 1502 and EMA25 ≈ 1452, and the structure is still trending up.
Daily: The trend is very strong; price 1530 vs EMA7 ≈ 1432, and MACD +25.
Flow: In the last two hours, buys ≈ 22.55K ZEC vs sells ≈ 15.60K → net buy ≈ +6.95K.
The large 5-day flow is still +74.4K ZEC, and the last 24 hours has returned positive by about +1.24K.
⚠️ The dangerous zone right now
1548–1552 is a very direct resistance, because it’s near the 24-hour high 1548.33 and near the upper band on the shorter timeframes.
If it breaks 1552 and holds above it: ➡️ 1595 becomes the next main target.
If it fails at 1548–1552: ➡️ a pullback to 1515 is natural, then 1490–1497 as stronger support.
Summary
I’m now with the upside, not the downside. 🟢
But I don’t consider 1530 an ideal chase zone, because the price is close to 1548.
A break of 1552 = a much stronger bullish signal toward 1595.
Losing 1515 = a warning of a deeper correction.
Most importantly: the bigger trend is still strongly bullish, while only the short-term move needs watching at 1548–1552.
🟢 Upside is the current most likely scenario.
The reason is that several things lined up:
The price 1530–1533 is above EMA7 and EMA25 on the 15m and 1h charts.
15m: MACD is still slightly negative, but improving, and Stoch RSI is rising.
1h: MACD is positive +7.25, and the price is above EMA7 ≈ 1515 and EMA25 ≈ 1490.
4h: Price 1531 is above EMA7 ≈ 1502 and EMA25 ≈ 1452, and the structure is still trending up.
Daily: The trend is very strong; price 1530 vs EMA7 ≈ 1432, and MACD +25.
Flow: In the last two hours, buys ≈ 22.55K ZEC vs sells ≈ 15.60K → net buy ≈ +6.95K.
The large 5-day flow is still +74.4K ZEC, and the last 24 hours has returned positive by about +1.24K.
⚠️ The dangerous zone right now
1548–1552 is a very direct resistance, because it’s near the 24-hour high 1548.33 and near the upper band on the shorter timeframes.
If it breaks 1552 and holds above it: ➡️ 1595 becomes the next main target.
If it fails at 1548–1552: ➡️ a pullback to 1515 is natural, then 1490–1497 as stronger support.
Summary
I’m now with the upside, not the downside. 🟢
But I don’t consider 1530 an ideal chase zone, because the price is close to 1548.
A break of 1552 = a much stronger bullish signal toward 1595.
Losing 1515 = a warning of a deeper correction.
Most importantly: the bigger trend is still strongly bullish, while only the short-term move needs watching at 1548–1552.
123
·
--
Bullish
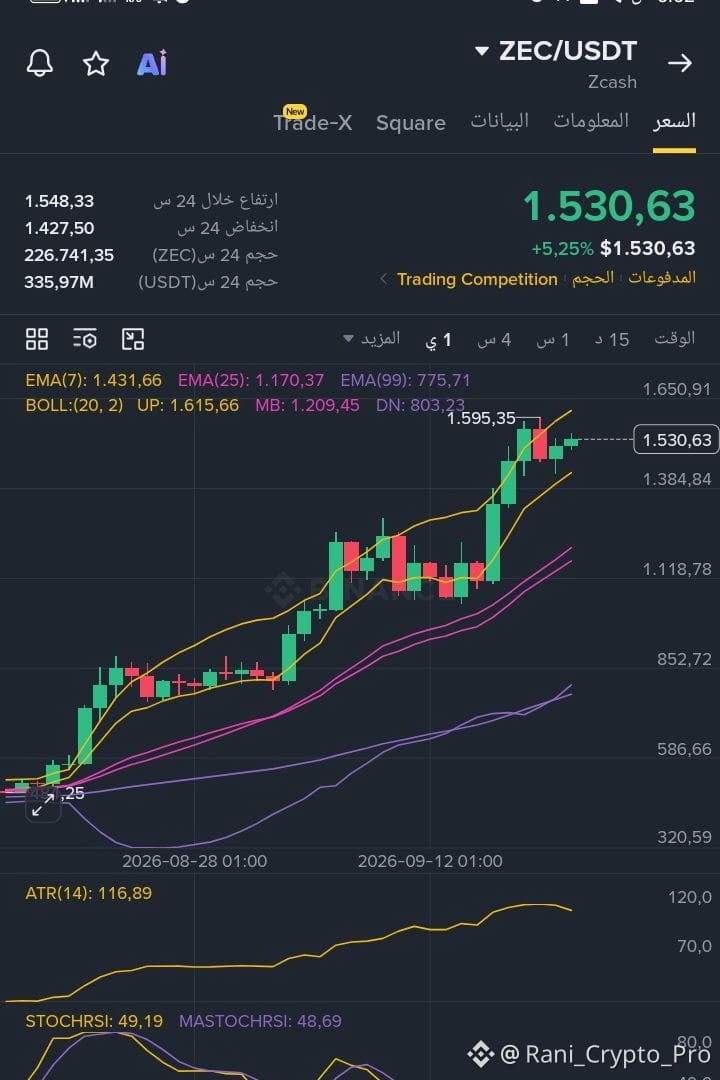
🚨 Analysis $ZEC /
ZEC is currently trading near $1,530 after a strong bullish wave. Indicators across different timeframes still show a positive trend, with clear buying pressure.
📌 Resistance: $1,548 – $1,552
🎯 If it breaks through and holds steadily, the previous high near $1,595 becomes a monitored zone.
🛡️ Support: $1,515 – $1,490
However, the RSI is relatively high, so a pullback or sideways movement before continuing the uptrend remains possible.
⚠️ This is a technical read and not a guarantee of the price.
{future}(ZECUSDT)
🚨 Analysis $ZEC /
ZEC is currently trading near $1,530 after a strong bullish wave. Indicators across different timeframes still show a positive trend, with clear buying pressure.
📌 Resistance: $1,548 – $1,552
🎯 If it breaks through and holds steadily, the previous high near $1,595 becomes a monitored zone.
🛡️ Support: $1,515 – $1,490
However, the RSI is relatively high, so a pullback or sideways movement before continuing the uptrend remains possible.
⚠️ This is a technical read and not a guarantee of the price.
ZEC is currently trading near $1,530 after a strong bullish wave. Indicators across different timeframes still show a positive trend, with clear buying pressure.
📌 Resistance: $1,548 – $1,552
🎯 If it breaks through and holds steadily, the previous high near $1,595 becomes a monitored zone.
🛡️ Support: $1,515 – $1,490
However, the RSI is relatively high, so a pullback or sideways movement before continuing the uptrend remains possible.
⚠️ This is a technical read and not a guarantee of the price.
453
·
--
Bearish
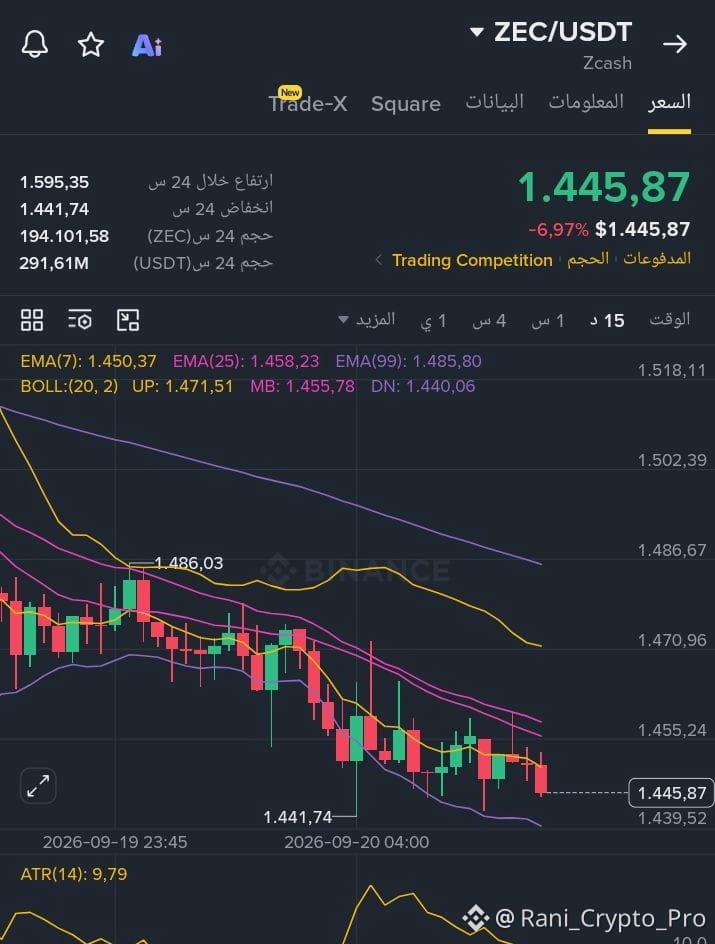
😂 Conversation between the analyst and the person who wants to enter trade $ZEC :
👤 The person: Bro, ZEC is at $1450… should I enter?
📊 The analyst: Wait, don’t rush. We have an important support at $1440.
👤 The person: So do I buy at $1450?
📊 The analyst: No, we’ll wait for confirmation.
👤 The person: What’s the confirmation?
📊 The analyst: If the support holds and we see the breakout, then we enter.
👤 The person: And if the support breaks?
📊 The analyst: We don’t enter.
👤 The person: And if it goes up without a pullback?
📊 The analyst: Don’t chase the price.
👤 The person: And if it drops?
📊 The analyst: Don’t buy the falling knife.
👤 The person: So in the end, do I enter or not? 😂
📊 The analyst: The main thing is: don’t enter until I give you the signal.
👤 The person: From when should I wait?
📊 The analyst: When the market gives us confirmation.
👤 The person: And when it gives us confirmation?
📊 The analyst: We do a new analysis to make sure the confirmation is real. 😂😂
👤 The person: So I came to make money with you… and you’re asking me to work with you on the analysis! 🤦♂️🤣
{future}(ZECUSDT)
😂 Conversation between the analyst and the person who wants to enter trade $ZEC :
👤 The person: Bro, ZEC is at $1450… should I enter?
📊 The analyst: Wait, don’t rush. We have an important support at $1440.
👤 The person: So do I buy at $1450?
📊 The analyst: No, we’ll wait for confirmation.
👤 The person: What’s the confirmation?
📊 The analyst: If the support holds and we see the breakout, then we enter.
👤 The person: And if the support breaks?
📊 The analyst: We don’t enter.
👤 The person: And if it goes up without a pullback?
📊 The analyst: Don’t chase the price.
👤 The person: And if it drops?
📊 The analyst: Don’t buy the falling knife.
👤 The person: So in the end, do I enter or not? 😂
📊 The analyst: The main thing is: don’t enter until I give you the signal.
👤 The person: From when should I wait?
📊 The analyst: When the market gives us confirmation.
👤 The person: And when it gives us confirmation?
📊 The analyst: We do a new analysis to make sure the confirmation is real. 😂😂
👤 The person: So I came to make money with you… and you’re asking me to work with you on the analysis! 🤦♂️🤣
👤 The person: Bro, ZEC is at $1450… should I enter?
📊 The analyst: Wait, don’t rush. We have an important support at $1440.
👤 The person: So do I buy at $1450?
📊 The analyst: No, we’ll wait for confirmation.
👤 The person: What’s the confirmation?
📊 The analyst: If the support holds and we see the breakout, then we enter.
👤 The person: And if the support breaks?
📊 The analyst: We don’t enter.
👤 The person: And if it goes up without a pullback?
📊 The analyst: Don’t chase the price.
👤 The person: And if it drops?
📊 The analyst: Don’t buy the falling knife.
👤 The person: So in the end, do I enter or not? 😂
📊 The analyst: The main thing is: don’t enter until I give you the signal.
👤 The person: From when should I wait?
📊 The analyst: When the market gives us confirmation.
👤 The person: And when it gives us confirmation?
📊 The analyst: We do a new analysis to make sure the confirmation is real. 😂😂
👤 The person: So I came to make money with you… and you’re asking me to work with you on the analysis! 🤦♂️🤣
2
1
812
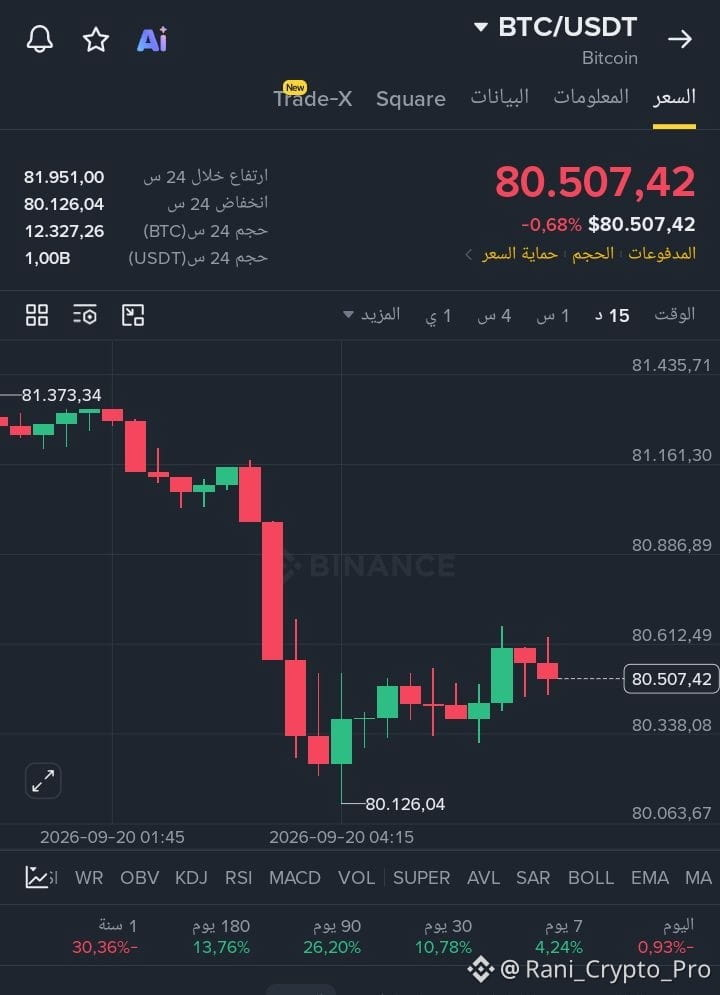
Strong battle between sellers and buyers over $BTC !
The market is currently in clear back-and-forth:
🟢 Strong buying flows in the short term, and the volume of large positions tends toward buying.
🔴 At the same time, entries by accounts slightly lean toward selling, with OI rising.
⚔️ Buyers are trying to regain control, while sellers are pushing to prevent the rise.
The current area is extremely sensitive. The decisive move requires monitoring price + flow + OI together, because whichever side begins to gain an advantage could push $BTC into a strong move.
{future}(BTCUSDT)
Strong battle between sellers and buyers over $BTC !
The market is currently in clear back-and-forth:
🟢 Strong buying flows in the short term, and the volume of large positions tends toward buying.
🔴 At the same time, entries by accounts slightly lean toward selling, with OI rising.
⚔️ Buyers are trying to regain control, while sellers are pushing to prevent the rise.
The current area is extremely sensitive. The decisive move requires monitoring price + flow + OI together, because whichever side begins to gain an advantage could push $BTC into a strong move.
The market is currently in clear back-and-forth:
🟢 Strong buying flows in the short term, and the volume of large positions tends toward buying.
🔴 At the same time, entries by accounts slightly lean toward selling, with OI rising.
⚔️ Buyers are trying to regain control, while sellers are pushing to prevent the rise.
The current area is extremely sensitive. The decisive move requires monitoring price + flow + OI together, because whichever side begins to gain an advantage could push $BTC into a strong move.
108
·
--
Bearish
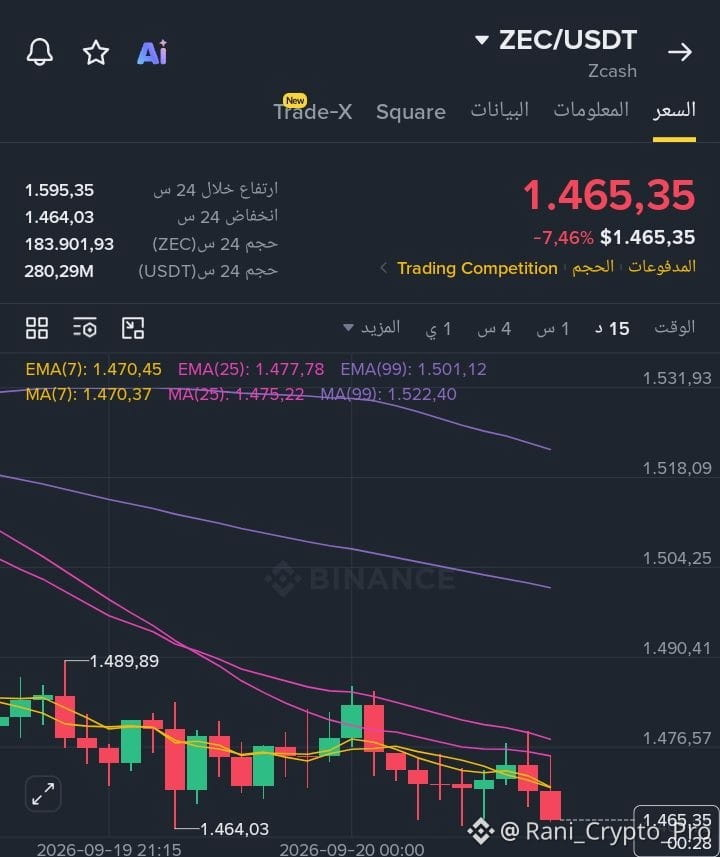
🔴 Now the downside advantage has become clearer $ZEC
The price 1465.35 broke the 1466 level we were watching, and set a low at 1464.03.
Most important:
Price is below EMA7 1470.45 and EMA25 1477.78.
The 15-minute candles have started pressing downward.
The order book shows slightly higher sell interest: 52.49% sell vs 47.51% buy.
There is a clear sell-side resistance near 1500.
The nearby support that was at 1466 has now become a level that must be reclaimed for the scenario to improve.
🎯 My decision now
🔴 I lean bearish in the short term, and my conviction is stronger than before.
The levels I’m watching: 1464 → 1447 → 1427
But if ZEC returns above 1470 and reclaims 1478–1480, I will consider the break of 1466 a failure and reassess the downside.
Summary ;
⚠️ ZEC has now broken the 1466 area we were monitoring and reached 1464. Selling pressure is now more evident. Now I’m watching whether the break holds or whether the coin quickly recovers 1470–1480. 🔴📊
{future}(ZECUSDT)
🔴 Now the downside advantage has become clearer $ZEC
The price 1465.35 broke the 1466 level we were watching, and set a low at 1464.03.
Most important:
Price is below EMA7 1470.45 and EMA25 1477.78.
The 15-minute candles have started pressing downward.
The order book shows slightly higher sell interest: 52.49% sell vs 47.51% buy.
There is a clear sell-side resistance near 1500.
The nearby support that was at 1466 has now become a level that must be reclaimed for the scenario to improve.
🎯 My decision now
🔴 I lean bearish in the short term, and my conviction is stronger than before.
The levels I’m watching: 1464 → 1447 → 1427
But if ZEC returns above 1470 and reclaims 1478–1480, I will consider the break of 1466 a failure and reassess the downside.
Summary ;
⚠️ ZEC has now broken the 1466 area we were monitoring and reached 1464. Selling pressure is now more evident. Now I’m watching whether the break holds or whether the coin quickly recovers 1470–1480. 🔴📊
The price 1465.35 broke the 1466 level we were watching, and set a low at 1464.03.
Most important:
Price is below EMA7 1470.45 and EMA25 1477.78.
The 15-minute candles have started pressing downward.
The order book shows slightly higher sell interest: 52.49% sell vs 47.51% buy.
There is a clear sell-side resistance near 1500.
The nearby support that was at 1466 has now become a level that must be reclaimed for the scenario to improve.
🎯 My decision now
🔴 I lean bearish in the short term, and my conviction is stronger than before.
The levels I’m watching: 1464 → 1447 → 1427
But if ZEC returns above 1470 and reclaims 1478–1480, I will consider the break of 1466 a failure and reassess the downside.
Summary ;
⚠️ ZEC has now broken the 1466 area we were monitoring and reached 1464. Selling pressure is now more evident. Now I’m watching whether the break holds or whether the coin quickly recovers 1470–1480. 🔴📊
128
Log in to explore more content
Join global crypto users on Binance Square
⚡️ Get latest and useful information about crypto.
💬 Trusted by the world’s largest crypto exchange.
👍 Discover real insights from verified creators.
Email / Phone number
Trending Topics
AIStocksWhatNext
945,523 views
6,853 Discussing
Share & Win Traffic Reward in our Trending Hashtag Campaign
✨Topic: What Other Investment Opportunities Remain as AI Stocks Keep Rising?
👉How to Join:
Publish a short post or article with hashtag #AIStocksWhatNext
Share whether you’re bullish or bearish, and post your AI stock holdings or trade — using the trade widget may improve your eligibility.
You can also strengthen your post by sharing data or charts, and avoiding AI-generated images.
✍️Create content based on the below angles:
- Nvidia says chip sales will double next year, and top AI companies keep hitting record revenue, the compute spend behind it is just as staggering. Is AI demand really taking off? And how long can it last? AI stocks are up across the board. Is this a real breakout, or just a short-term bounce?
- Industry leaders are calling to slow down AI development, while Trump plans to build an “AI Force”, claiming AI could account for 25% of U.S. GDP in the future. Whose side are you on? Will state-level backing be a long-term win for AI stocks?
- Are you buying AI stocks? Share your AI-related trade/holdings with our trade sharing widget.
⏰Campaign Period:
- 2026-09-22 7:00 - 2026-09-24 4:00 UTC
🎁Reward:
- Qualified posts that comply with the above guidelines and contain more than 100 words will be reviewed and may receive a random traffic boost of 500 to 3,000 views. You will receive a notification from your feed secretary if your post is selected.
- Get a chance to have your article featured on Binance Square Official
Need ideas for your post? Visit the topic page #AIStocksWhatNext or the Square Guide on How to Post for Better Reach.
Binance Square Official
·601 Likes
·1.7M views
BitcoinRejectedAt$87,300Twice
0 views
0 Discussing
BCHJumps28%OnCMEFuturesListing
17,396 views
609 Discussing