

Mi_Trade
156 Posts

Mi_Trade
Report
Block User
3 Following
8 Followers
6 Liked
Posts
·
--
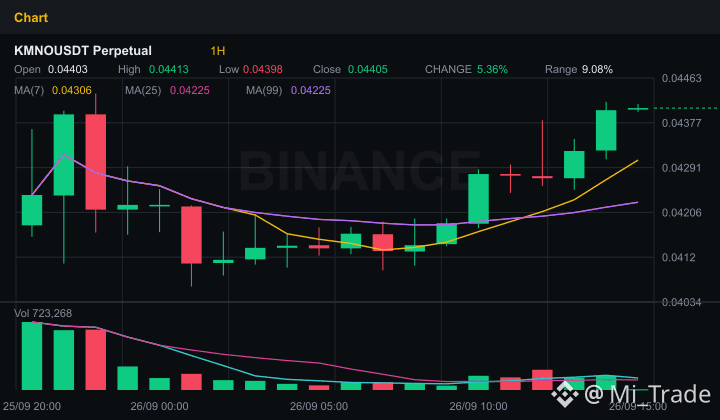
🚨 $KMNO Alert: RSI Overbought—Is the Next Move a Rocket Launch? 🚀
Hello fellow traders on Binance Square! The crypto market is never short of heart-stopping moments, and all eyes right now are on $KMNO. Looking at the order board, a lot of you who are holding Long positions are feeling excited—but are the bulls about to charge straight into the “dead zone”? Let’s break down the hot on-chain and technical data below to find out!
🔥 Technical View & $KMNO Money Flow Right Now:
- Trend & Momentum: Both the M15 and H1 timeframes are strongly aligned with a “bullish” trend. MACD supports the buyers, but RSI-14 has surged to 85.7—an iconic overbought zone. The slight warning is that the uptrend may face short-term profit-taking pressure at any moment!
- Shark Attraction: Trading volume is up 6.8%, and especially Open Interest (OI) has exploded—rising by nearly 5% within 1 hour to over $4.28 million. Fresh capital is flooding into derivatives, showing these “whales” have no intention of stopping.
- Crowd Sentiment & Positioning: The global Long/Short ratio is 1.72 (63.2% Long), indicating the community is extremely euphoric. However, the Top Trader account ratio is surprisingly balanced (50.5% Long and 49.5% Short), suggesting the big players are cautiously and fiercely battling in the resistance area.
- Price Map to Remember:
+ Hard Support: 0.04095
+ Potential Resistance: 0.04417
💡 Smart Action Strategy:
With an RSI that’s “burning hot” like $KMNO, chasing the top with FOMO right now is no different than playing a game of chance. Be patient and wait for a retest of the support zone or a decisive breakout signal above resistance accompanied by large volume. Always set a strict stop-loss right below the support area to protect your capital, because liquidity sweep moves (long squeezes) can appear out of nowhere at any time!
What do you think? Will $KMNO break through resistance at 0.04417 and soar higher, or will there be a shakeout that wipes out the “weak-hearted newcomers” before the next leg up? Leave your thoughts in the comments below!
#KMNO #BinanceSquare
🚨 $KMNO Alert: RSI Overbought—Is the Next Move a Rocket Launch? 🚀
Hello fellow traders on Binance Square! The crypto market is never short of heart-stopping moments, and all eyes right now are on $KMNO . Looking at the order board, a lot of you who are holding Long positions are feeling excited—but are the bulls about to charge straight into the “dead zone”? Let’s break down the hot on-chain and technical data below to find out!
🔥 Technical View & $KMNO Money Flow Right Now:
- Trend & Momentum: Both the M15 and H1 timeframes are strongly aligned with a “bullish” trend. MACD supports the buyers, but RSI-14 has surged to 85.7—an iconic overbought zone. The slight warning is that the uptrend may face short-term profit-taking pressure at any moment!
- Shark Attraction: Trading volume is up 6.8%, and especially Open Interest (OI) has exploded—rising by nearly 5% within 1 hour to over $4.28 million. Fresh capital is flooding into derivatives, showing these “whales” have no intention of stopping.
- Crowd Sentiment & Positioning: The global Long/Short ratio is 1.72 (63.2% Long), indicating the community is extremely euphoric. However, the Top Trader account ratio is surprisingly balanced (50.5% Long and 49.5% Short), suggesting the big players are cautiously and fiercely battling in the resistance area.
- Price Map to Remember:
+ Hard Support: 0.04095
+ Potential Resistance: 0.04417
💡 Smart Action Strategy:
With an RSI that’s “burning hot” like $KMNO , chasing the top with FOMO right now is no different than playing a game of chance. Be patient and wait for a retest of the support zone or a decisive breakout signal above resistance accompanied by large volume. Always set a strict stop-loss right below the support area to protect your capital, because liquidity sweep moves (long squeezes) can appear out of nowhere at any time!
What do you think? Will $KMNO break through resistance at 0.04417 and soar higher, or will there be a shakeout that wipes out the “weak-hearted newcomers” before the next leg up? Leave your thoughts in the comments below!
#KMNO #BinanceSquare
Hello fellow traders on Binance Square! The crypto market is never short of heart-stopping moments, and all eyes right now are on $KMNO . Looking at the order board, a lot of you who are holding Long positions are feeling excited—but are the bulls about to charge straight into the “dead zone”? Let’s break down the hot on-chain and technical data below to find out!
🔥 Technical View & $KMNO Money Flow Right Now:
- Trend & Momentum: Both the M15 and H1 timeframes are strongly aligned with a “bullish” trend. MACD supports the buyers, but RSI-14 has surged to 85.7—an iconic overbought zone. The slight warning is that the uptrend may face short-term profit-taking pressure at any moment!
- Shark Attraction: Trading volume is up 6.8%, and especially Open Interest (OI) has exploded—rising by nearly 5% within 1 hour to over $4.28 million. Fresh capital is flooding into derivatives, showing these “whales” have no intention of stopping.
- Crowd Sentiment & Positioning: The global Long/Short ratio is 1.72 (63.2% Long), indicating the community is extremely euphoric. However, the Top Trader account ratio is surprisingly balanced (50.5% Long and 49.5% Short), suggesting the big players are cautiously and fiercely battling in the resistance area.
- Price Map to Remember:
+ Hard Support: 0.04095
+ Potential Resistance: 0.04417
💡 Smart Action Strategy:
With an RSI that’s “burning hot” like $KMNO , chasing the top with FOMO right now is no different than playing a game of chance. Be patient and wait for a retest of the support zone or a decisive breakout signal above resistance accompanied by large volume. Always set a strict stop-loss right below the support area to protect your capital, because liquidity sweep moves (long squeezes) can appear out of nowhere at any time!
What do you think? Will $KMNO break through resistance at 0.04417 and soar higher, or will there be a shakeout that wipes out the “weak-hearted newcomers” before the next leg up? Leave your thoughts in the comments below!
#KMNO #BinanceSquare
4
·
--
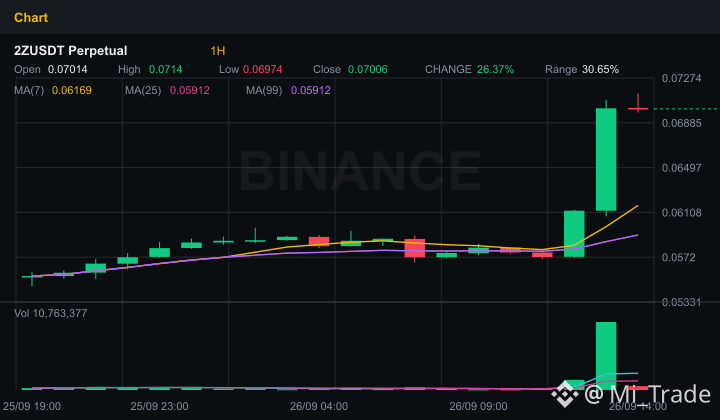
🚨 $2Z WARNING: A massive volume explosion or a "rug pull" trap from the sharks? 🚀🔥
The market has just witnessed an extremely intense "pump" that left the community unable to sit still. While niche altcoins like $RARE and $ARK are gearing up for a strong rise, attention right now is focused on $2ZUSDT—where the technical numbers are highly sensitive. Is this an opportunity to get rich, or a trap waiting to wipe out your account?
Let’s quickly break down the technical picture of $2Z right now:
• Trend & Momentum (M15 - H1): The bulls are absolutely controlling the short-term front as the price structure keeps forming higher highs. However, RSI(14) has surged to an extreme 87.2—an overbought "red alert" zone—suggesting the bulls pushed the price too far and could run out of steam at any moment.
• Volume & Flows (Volume & OI): Explosive volume growth, up +264.6%, combined with Open Interest (OI) jumping nearly 47% within just 1 hour. Money is pouring in aggressively, showing that excitement is at its peak—but it also simultaneously opens up the risk of an unexpected liquidity sweep (long squeeze).
• Shark vs Crowd Sentiment: Notably, the Long/Short ratio of the Top Trader is heavily tilted toward Long (60.5%), indicating the "sharks" are still betting on the upside. That said, the Taker Buy/Sell ratio is still below 1 (0.884), hinting that active selling pressure from the Short side is lurking and weighing on the price.
• Key Price Zones: Support is currently at 0.05675, while hard resistance is hovering just around 0.0714. A breakout or rejection here will determine the fate of this wave.
💡 Risk management advice: With an overheated RSI and sizzling derivatives flows, this is absolutely not the time to FOMO into the top with high leverage. Be patient and wait for a retest into the support zone, or manage your capital very tightly if you’re already in a position.
What do you think, guys? Will $2Z break through resistance to go higher, or will there be a "shakeout" that collapses under the floor before going further? Leave your thoughts in the comments below!
#BinanceSquare #CryptoTrading
🚨 $2Z WARNING: A massive volume explosion or a "rug pull" trap from the sharks? 🚀🔥
The market has just witnessed an extremely intense "pump" that left the community unable to sit still. While niche altcoins like $RARE and $ARK are gearing up for a strong rise, attention right now is focused on $2ZUSDT—where the technical numbers are highly sensitive. Is this an opportunity to get rich, or a trap waiting to wipe out your account?
Let’s quickly break down the technical picture of $2Z right now:
• Trend & Momentum (M15 - H1): The bulls are absolutely controlling the short-term front as the price structure keeps forming higher highs. However, RSI(14) has surged to an extreme 87.2—an overbought "red alert" zone—suggesting the bulls pushed the price too far and could run out of steam at any moment.
• Volume & Flows (Volume & OI): Explosive volume growth, up +264.6%, combined with Open Interest (OI) jumping nearly 47% within just 1 hour. Money is pouring in aggressively, showing that excitement is at its peak—but it also simultaneously opens up the risk of an unexpected liquidity sweep (long squeeze).
• Shark vs Crowd Sentiment: Notably, the Long/Short ratio of the Top Trader is heavily tilted toward Long (60.5%), indicating the "sharks" are still betting on the upside. That said, the Taker Buy/Sell ratio is still below 1 (0.884), hinting that active selling pressure from the Short side is lurking and weighing on the price.
• Key Price Zones: Support is currently at 0.05675, while hard resistance is hovering just around 0.0714. A breakout or rejection here will determine the fate of this wave.
💡 Risk management advice: With an overheated RSI and sizzling derivatives flows, this is absolutely not the time to FOMO into the top with high leverage. Be patient and wait for a retest into the support zone, or manage your capital very tightly if you’re already in a position.
What do you think, guys? Will $2Z break through resistance to go higher, or will there be a "shakeout" that collapses under the floor before going further? Leave your thoughts in the comments below!
#BinanceSquare #CryptoTrading
The market has just witnessed an extremely intense "pump" that left the community unable to sit still. While niche altcoins like $RARE and $ARK are gearing up for a strong rise, attention right now is focused on $2ZUSDT—where the technical numbers are highly sensitive. Is this an opportunity to get rich, or a trap waiting to wipe out your account?
Let’s quickly break down the technical picture of $2Z right now:
• Trend & Momentum (M15 - H1): The bulls are absolutely controlling the short-term front as the price structure keeps forming higher highs. However, RSI(14) has surged to an extreme 87.2—an overbought "red alert" zone—suggesting the bulls pushed the price too far and could run out of steam at any moment.
• Volume & Flows (Volume & OI): Explosive volume growth, up +264.6%, combined with Open Interest (OI) jumping nearly 47% within just 1 hour. Money is pouring in aggressively, showing that excitement is at its peak—but it also simultaneously opens up the risk of an unexpected liquidity sweep (long squeeze).
• Shark vs Crowd Sentiment: Notably, the Long/Short ratio of the Top Trader is heavily tilted toward Long (60.5%), indicating the "sharks" are still betting on the upside. That said, the Taker Buy/Sell ratio is still below 1 (0.884), hinting that active selling pressure from the Short side is lurking and weighing on the price.
• Key Price Zones: Support is currently at 0.05675, while hard resistance is hovering just around 0.0714. A breakout or rejection here will determine the fate of this wave.
💡 Risk management advice: With an overheated RSI and sizzling derivatives flows, this is absolutely not the time to FOMO into the top with high leverage. Be patient and wait for a retest into the support zone, or manage your capital very tightly if you’re already in a position.
What do you think, guys? Will $2Z break through resistance to go higher, or will there be a "shakeout" that collapses under the floor before going further? Leave your thoughts in the comments below!
#BinanceSquare #CryptoTrading
145
·
--
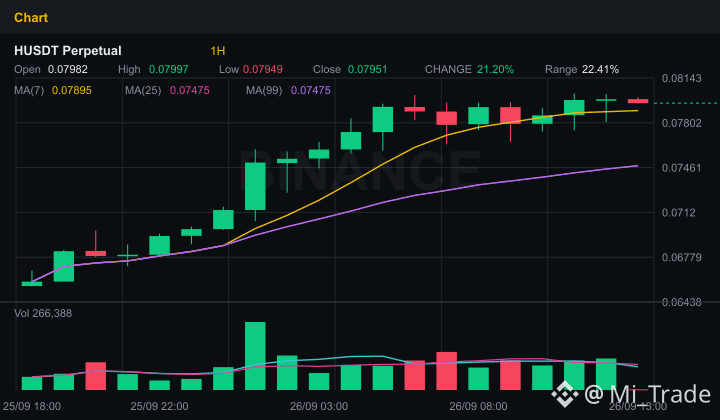
🚀 GREAT GROWTH OPPORTUNITY TRAPPED IN A TRAP? $H AND A RISING WAVE—BE VERY CAREFUL!
The crypto market always knows how to test a trader’s patience. Looking at the chart right now, many of you are excited because it’s green, but is the bulls’ side being overconfident? Let’s break down exclusive data to see what the “whales” are planning with $H !
Below is the most practical technical picture you can’t miss on a mobile chart:
• Trend & Momentum (M15 & H1 Bullish): The short-term price structure is still within an uptrend. The RSI(14) indicator is hovering at 67.6—close to the overbought zone—paired with MACD supporting the buying side. However, is this rally truly sustainable?
• Trading Volume Slumps (-19.1%): This is the biggest “sticking point” right now! Price is rising, but liquidity is thinning out. A classic warning signal suggesting new capital inflows are hesitating—the push behind $H shows signs of running out of steam.
• Cash Flow Sentiment & Derivatives: Open Interest (OI) has inched up 0.29%, indicating new positions are still being opened. Notably, the global Long/Short ratio is at 1.59, and Top Trader reaches 2.04 (67.2% Long). In addition, the Taker Buy/Sell Ratio is 0.54 (the sell side is actively dominant in some intervals). When the crowd gets overly enthusiastic and holds Long positions, the risk of getting “liquidated” in a sweep of liquidity is extremely real.
• Critical price levels you must pin down:
- Resistance: 0.08025 (Once it breaks through, new skies open up).
- Support: 0.07638 (If this level is lost, the bulls will pay a steep price).
So what’s the trading strategy right now? Absolutely don’t FOMO into the peak when RSI is high and volume is drying up. Be patient—wait for the price to retest the support zone or break out decisively with massive liquidity. Always set a tight stop-loss to protect your account during this sensitive period.
Where are you standing right now? Are you holding Long, or waiting for a Short entry to catch the pullback? Leave your thoughts in the comments so we can discuss together!
#BinanceSquare #CryptoTrading
🚀 GREAT GROWTH OPPORTUNITY TRAPPED IN A TRAP? $H AND A RISING WAVE—BE VERY CAREFUL!
The crypto market always knows how to test a trader’s patience. Looking at the chart right now, many of you are excited because it’s green, but is the bulls’ side being overconfident? Let’s break down exclusive data to see what the “whales” are planning with $H !
Below is the most practical technical picture you can’t miss on a mobile chart:
• Trend & Momentum (M15 & H1 Bullish): The short-term price structure is still within an uptrend. The RSI(14) indicator is hovering at 67.6—close to the overbought zone—paired with MACD supporting the buying side. However, is this rally truly sustainable?
• Trading Volume Slumps (-19.1%): This is the biggest “sticking point” right now! Price is rising, but liquidity is thinning out. A classic warning signal suggesting new capital inflows are hesitating—the push behind $H shows signs of running out of steam.
• Cash Flow Sentiment & Derivatives: Open Interest (OI) has inched up 0.29%, indicating new positions are still being opened. Notably, the global Long/Short ratio is at 1.59, and Top Trader reaches 2.04 (67.2% Long). In addition, the Taker Buy/Sell Ratio is 0.54 (the sell side is actively dominant in some intervals). When the crowd gets overly enthusiastic and holds Long positions, the risk of getting “liquidated” in a sweep of liquidity is extremely real.
• Critical price levels you must pin down:
- Resistance: 0.08025 (Once it breaks through, new skies open up).
- Support: 0.07638 (If this level is lost, the bulls will pay a steep price).
So what’s the trading strategy right now? Absolutely don’t FOMO into the peak when RSI is high and volume is drying up. Be patient—wait for the price to retest the support zone or break out decisively with massive liquidity. Always set a tight stop-loss to protect your account during this sensitive period.
Where are you standing right now? Are you holding Long, or waiting for a Short entry to catch the pullback? Leave your thoughts in the comments so we can discuss together!
#BinanceSquare #CryptoTrading
The crypto market always knows how to test a trader’s patience. Looking at the chart right now, many of you are excited because it’s green, but is the bulls’ side being overconfident? Let’s break down exclusive data to see what the “whales” are planning with $H !
Below is the most practical technical picture you can’t miss on a mobile chart:
• Trend & Momentum (M15 & H1 Bullish): The short-term price structure is still within an uptrend. The RSI(14) indicator is hovering at 67.6—close to the overbought zone—paired with MACD supporting the buying side. However, is this rally truly sustainable?
• Trading Volume Slumps (-19.1%): This is the biggest “sticking point” right now! Price is rising, but liquidity is thinning out. A classic warning signal suggesting new capital inflows are hesitating—the push behind $H shows signs of running out of steam.
• Cash Flow Sentiment & Derivatives: Open Interest (OI) has inched up 0.29%, indicating new positions are still being opened. Notably, the global Long/Short ratio is at 1.59, and Top Trader reaches 2.04 (67.2% Long). In addition, the Taker Buy/Sell Ratio is 0.54 (the sell side is actively dominant in some intervals). When the crowd gets overly enthusiastic and holds Long positions, the risk of getting “liquidated” in a sweep of liquidity is extremely real.
• Critical price levels you must pin down:
- Resistance: 0.08025 (Once it breaks through, new skies open up).
- Support: 0.07638 (If this level is lost, the bulls will pay a steep price).
So what’s the trading strategy right now? Absolutely don’t FOMO into the peak when RSI is high and volume is drying up. Be patient—wait for the price to retest the support zone or break out decisively with massive liquidity. Always set a tight stop-loss to protect your account during this sensitive period.
Where are you standing right now? Are you holding Long, or waiting for a Short entry to catch the pullback? Leave your thoughts in the comments so we can discuss together!
#BinanceSquare #CryptoTrading
18
·
--
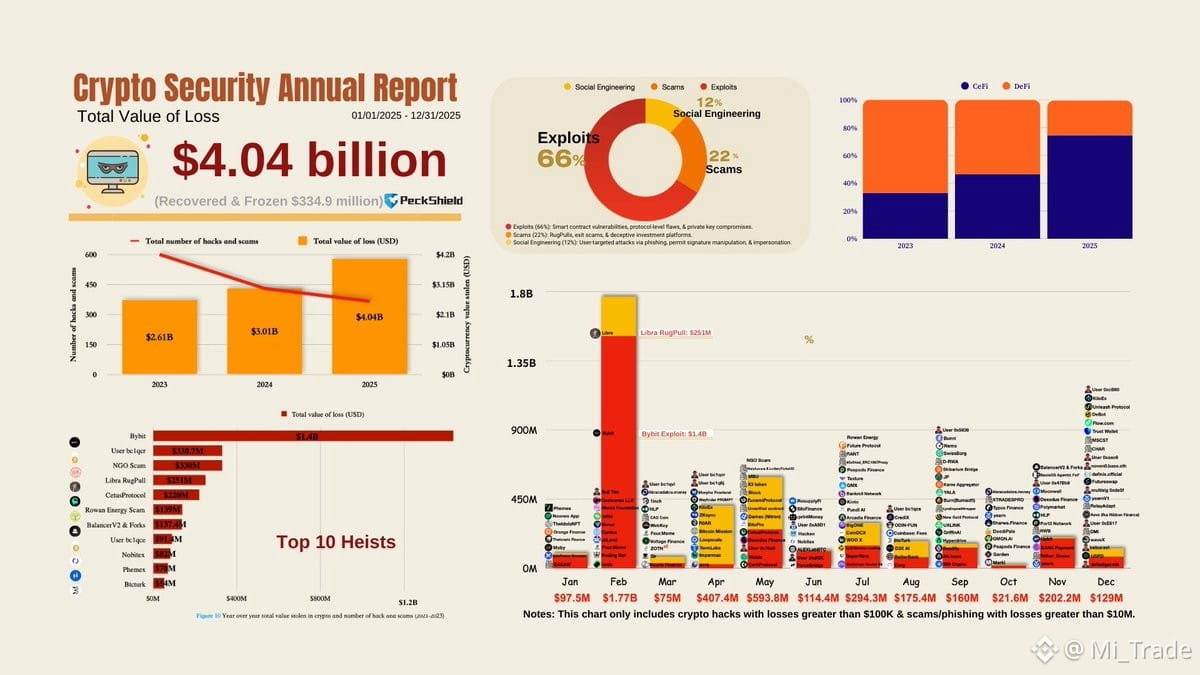
⚠️ Report from #PeckShieldAlert shows that in 2025, record losses were recorded due to hackers and cryptocurrency scams, exceeding 4.04 billion USD (up ~34.2% compared to 2024).
Loss details:
📍 Crypto hacks: 2.67 billion USD (up 24.2%)
📍 Scams: 1.37 billion USD (up 64.2%)
The main cause is vulnerabilities in centralized infrastructure and non-technical attacks (social engineering). About 334.9 million USD has been recovered or frozen.
👀 Market Watch:
#RSSNew #AIStocksWhatNext
⚠️ Report from #PeckShieldAlert shows that in 2025, record losses were recorded due to hackers and cryptocurrency scams, exceeding 4.04 billion USD (up ~34.2% compared to 2024).
Loss details:
📍 Crypto hacks: 2.67 billion USD (up 24.2%)
📍 Scams: 1.37 billion USD (up 64.2%)
The main cause is vulnerabilities in centralized infrastructure and non-technical attacks (social engineering). About 334.9 million USD has been recovered or frozen.
👀 Market Watch:
#RSSNew #AIStocksWhatNext
Loss details:
📍 Crypto hacks: 2.67 billion USD (up 24.2%)
📍 Scams: 1.37 billion USD (up 64.2%)
The main cause is vulnerabilities in centralized infrastructure and non-technical attacks (social engineering). About 334.9 million USD has been recovered or frozen.
👀 Market Watch:
#RSSNew #AIStocksWhatNext
35
·
--
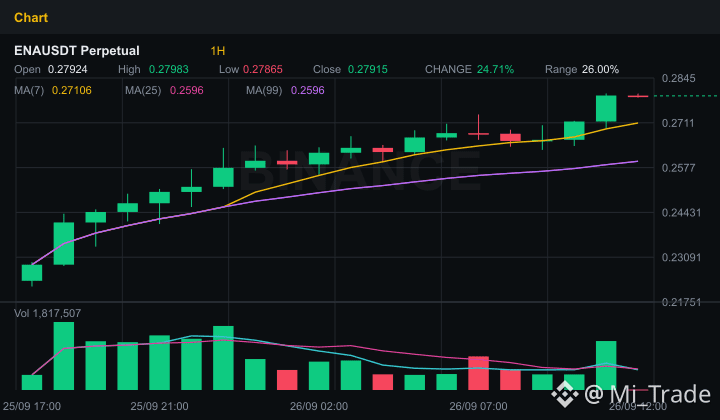
🚨 $ENA Is This Stable or a Price-Increase Trap? A Deep Look Through Derivatives Data! 🚀
The crypto market is always ruthless, and if you’re holding $ENA without clearly understanding the numbers below, chances are you’re trading in the dark. Let’s quickly break down the current fund flow situation to see whether the bulls or the bears are holding the strings!
Technical View & Current Fund Flow:
• Short-term trend: The M15 and H1 charts are both aligned in bright green (bullish), indicating that upward price momentum is still being maintained quite well.
• Momentum (RSI & MACD): RSI-14 is hovering around 67.7—buy pressure is very strong, but it hasn’t yet reached the extremely overbought threshold (> 70). MACD is also supporting the buyers.
• Open Interest (OI) explodes: OI surged to more than 161.5 million USD, while rising 4.45% within just the past hour. Money is pouring aggressively into the derivatives market!
• Trading sentiment: The taker buy/sell ratio is 1.181, meaning buyers are actively executing orders at market prices more than sellers. Whales and the crowd are on the same side—Long—with the global Long ratio dominating at 62.9%.
• Key price levels "make-or-break":
- Nearest resistance: 0.27988
- Hard support: 0.25931
So what’s the trading strategy for $ENA right now? Since RSI is nearing high levels and OI has surged strongly, the risk of a liquidity sweep (long squeeze) is absolutely possible if price touches resistance at 0.27988 but then loses momentum. Don’t chase with FOMO at the top—always split your capital and set your Stop Loss immediately below the support level of 0.25931 to protect your account.
Are you confident $ENA will successfully break above resistance, or will there be a bearish sweep first before it flies higher? Drop your thoughts in the comments below!
#ENA #BinanceSquare
🚨 $ENA Is This Stable or a Price-Increase Trap? A Deep Look Through Derivatives Data! 🚀
The crypto market is always ruthless, and if you’re holding $ENA without clearly understanding the numbers below, chances are you’re trading in the dark. Let’s quickly break down the current fund flow situation to see whether the bulls or the bears are holding the strings!
Technical View & Current Fund Flow:
• Short-term trend: The M15 and H1 charts are both aligned in bright green (bullish), indicating that upward price momentum is still being maintained quite well.
• Momentum (RSI & MACD): RSI-14 is hovering around 67.7—buy pressure is very strong, but it hasn’t yet reached the extremely overbought threshold (> 70). MACD is also supporting the buyers.
• Open Interest (OI) explodes: OI surged to more than 161.5 million USD, while rising 4.45% within just the past hour. Money is pouring aggressively into the derivatives market!
• Trading sentiment: The taker buy/sell ratio is 1.181, meaning buyers are actively executing orders at market prices more than sellers. Whales and the crowd are on the same side—Long—with the global Long ratio dominating at 62.9%.
• Key price levels "make-or-break":
- Nearest resistance: 0.27988
- Hard support: 0.25931
So what’s the trading strategy for $ENA right now? Since RSI is nearing high levels and OI has surged strongly, the risk of a liquidity sweep (long squeeze) is absolutely possible if price touches resistance at 0.27988 but then loses momentum. Don’t chase with FOMO at the top—always split your capital and set your Stop Loss immediately below the support level of 0.25931 to protect your account.
Are you confident $ENA will successfully break above resistance, or will there be a bearish sweep first before it flies higher? Drop your thoughts in the comments below!
#ENA #BinanceSquare
The crypto market is always ruthless, and if you’re holding $ENA without clearly understanding the numbers below, chances are you’re trading in the dark. Let’s quickly break down the current fund flow situation to see whether the bulls or the bears are holding the strings!
Technical View & Current Fund Flow:
• Short-term trend: The M15 and H1 charts are both aligned in bright green (bullish), indicating that upward price momentum is still being maintained quite well.
• Momentum (RSI & MACD): RSI-14 is hovering around 67.7—buy pressure is very strong, but it hasn’t yet reached the extremely overbought threshold (> 70). MACD is also supporting the buyers.
• Open Interest (OI) explodes: OI surged to more than 161.5 million USD, while rising 4.45% within just the past hour. Money is pouring aggressively into the derivatives market!
• Trading sentiment: The taker buy/sell ratio is 1.181, meaning buyers are actively executing orders at market prices more than sellers. Whales and the crowd are on the same side—Long—with the global Long ratio dominating at 62.9%.
• Key price levels "make-or-break":
- Nearest resistance: 0.27988
- Hard support: 0.25931
So what’s the trading strategy for $ENA right now? Since RSI is nearing high levels and OI has surged strongly, the risk of a liquidity sweep (long squeeze) is absolutely possible if price touches resistance at 0.27988 but then loses momentum. Don’t chase with FOMO at the top—always split your capital and set your Stop Loss immediately below the support level of 0.25931 to protect your account.
Are you confident $ENA will successfully break above resistance, or will there be a bearish sweep first before it flies higher? Drop your thoughts in the comments below!
#ENA #BinanceSquare
117
·
--
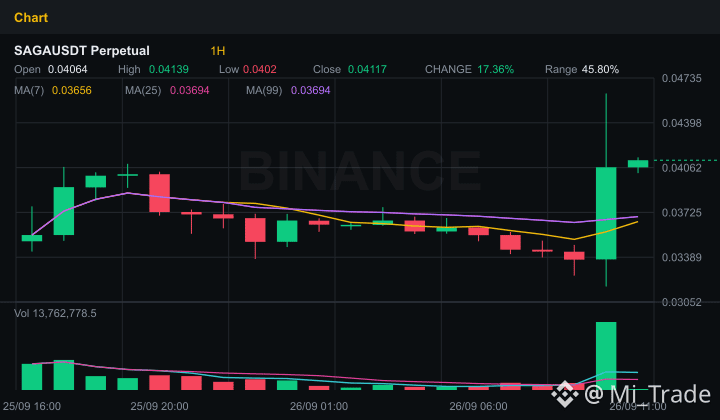
🚨 $SAGAUSDT ALERT: Trading volume explodes 856%! Are whales accumulating—or are they setting a trap to crash?
Traders, don’t look away! $SAGAUSDT is drawing major attention in the market right now, with numbers jumping around at dizzying speed. Is this a million-dollar opportunity or the biggest scam “by whales”? Let’s quickly break down the chart right now!
🔥 Technical & On-chain Data Insights (Hot and Spicy):
- Trading Volume (“rocket”): Skyrocketed to an astonishing 856.7%! Money is flooding into $SAGAUSDT, creating huge buzz across the community.
- Momentum: RSI(14) is at 78.4—overbought territory—but the MACD is still staying bullish with its green. The bulls are very aggressive, yet the risk of “running out of steam” is always there.
- Derivatives Data (Open Interest): OI surged 25.29% within just 1 hour, reaching nearly $20 million. Continuous order flow suggests “big hands” are lining up for a major move.
- “Whales” vs “Kleiner fish” sentiment: Top traders are extremely confident, with 71.2% Long orders (their Long/Short ratio is 2.47). However, the buy/sell ratio from Takers is slightly tilted toward the sell side (0.986), indicating a fierce tug-of-war in the current price zone.
- Key Price Levels: Firm support at 0.03168 and strong resistance right on the heels at 0.04619.
💡 Risk Management Advice:
The market is extremely excited, but the sky-high RSI warns that a liquidity sweep (shakeout) could happen at any moment to shake out leverage. Don’t chase the top with FOMO at any cost! Place a tight Stop Loss below support, and split your capital into multiple parts if you plan to enter.
What do you think about this uptrend in $SAGAUSDT? Will we break above resistance at 0.04619, or will there be a deep correction crash? Leave your thoughts in the comments!
#SAGA #TechnicalAnalysis
🚨 $SAGAUSDT ALERT: Trading volume explodes 856%! Are whales accumulating—or are they setting a trap to crash?
Traders, don’t look away! $SAGAUSDT is drawing major attention in the market right now, with numbers jumping around at dizzying speed. Is this a million-dollar opportunity or the biggest scam “by whales”? Let’s quickly break down the chart right now!
🔥 Technical & On-chain Data Insights (Hot and Spicy):
- Trading Volume (“rocket”): Skyrocketed to an astonishing 856.7%! Money is flooding into $SAGAUSDT, creating huge buzz across the community.
- Momentum: RSI(14) is at 78.4—overbought territory—but the MACD is still staying bullish with its green. The bulls are very aggressive, yet the risk of “running out of steam” is always there.
- Derivatives Data (Open Interest): OI surged 25.29% within just 1 hour, reaching nearly $20 million. Continuous order flow suggests “big hands” are lining up for a major move.
- “Whales” vs “Kleiner fish” sentiment: Top traders are extremely confident, with 71.2% Long orders (their Long/Short ratio is 2.47). However, the buy/sell ratio from Takers is slightly tilted toward the sell side (0.986), indicating a fierce tug-of-war in the current price zone.
- Key Price Levels: Firm support at 0.03168 and strong resistance right on the heels at 0.04619.
💡 Risk Management Advice:
The market is extremely excited, but the sky-high RSI warns that a liquidity sweep (shakeout) could happen at any moment to shake out leverage. Don’t chase the top with FOMO at any cost! Place a tight Stop Loss below support, and split your capital into multiple parts if you plan to enter.
What do you think about this uptrend in $SAGAUSDT? Will we break above resistance at 0.04619, or will there be a deep correction crash? Leave your thoughts in the comments!
#SAGA #TechnicalAnalysis
Traders, don’t look away! $SAGAUSDT is drawing major attention in the market right now, with numbers jumping around at dizzying speed. Is this a million-dollar opportunity or the biggest scam “by whales”? Let’s quickly break down the chart right now!
🔥 Technical & On-chain Data Insights (Hot and Spicy):
- Trading Volume (“rocket”): Skyrocketed to an astonishing 856.7%! Money is flooding into $SAGAUSDT, creating huge buzz across the community.
- Momentum: RSI(14) is at 78.4—overbought territory—but the MACD is still staying bullish with its green. The bulls are very aggressive, yet the risk of “running out of steam” is always there.
- Derivatives Data (Open Interest): OI surged 25.29% within just 1 hour, reaching nearly $20 million. Continuous order flow suggests “big hands” are lining up for a major move.
- “Whales” vs “Kleiner fish” sentiment: Top traders are extremely confident, with 71.2% Long orders (their Long/Short ratio is 2.47). However, the buy/sell ratio from Takers is slightly tilted toward the sell side (0.986), indicating a fierce tug-of-war in the current price zone.
- Key Price Levels: Firm support at 0.03168 and strong resistance right on the heels at 0.04619.
💡 Risk Management Advice:
The market is extremely excited, but the sky-high RSI warns that a liquidity sweep (shakeout) could happen at any moment to shake out leverage. Don’t chase the top with FOMO at any cost! Place a tight Stop Loss below support, and split your capital into multiple parts if you plan to enter.
What do you think about this uptrend in $SAGAUSDT? Will we break above resistance at 0.04619, or will there be a deep correction crash? Leave your thoughts in the comments!
#SAGA #TechnicalAnalysis
159
·
--
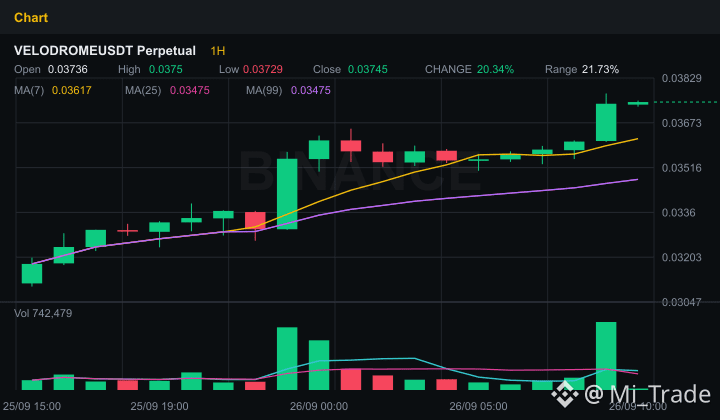
🚨 $VELO Alarm: Wild Pump Surge or the Ultimate FOMO Trap?
The crypto market has never stopped coming up with breathless surprises, and the current spotlight is on $VELODROMEUSDT. If you’re about to go “all-in” on this wave, stop for 2 minutes and read the analysis below right away so you don’t become prey for the sharks!
Looking at the current data table, $VELO is sending out extremely exciting signals—yet it also carries deadly risk:
• Explosive trend: Both the M15 and H1 timeframes are in agreement on a bullish trend (strong bullish momentum). The bulls fully control the short-term game.
• “Crazy” trading volume: Volume has surged massively by 176.3%, indicating a huge wave of capital is pouring into $VELODROMEUSDT.
• Open Interest (OI) spikes 6.09% over the past hour, reaching beyond the 10 million USD mark. New money is still continuously flowing into the derivatives market.
• Overbought momentum: RSI 14 is at 85—an extremely hot zone. MACD still supports the buyers, but the RSI warns that profit-taking pressure could hit at any moment.
• Trading sentiment: The global Long/Short ratio is 1.92 (65.8% long), showing the community is extremely excited and chasing the top. However, notably, the Taker buy/sell ratio is 0.88 (the sell side is actively dumping on pullback moves).
What’s the trading strategy in this murky zone?
• Key resistance to watch: 0.03775 — if it breaks above this level with heavy volume, $VELO could establish a new price baseline.
• Safe support: 0.03505 — this is the bulls’ crucial launchpad; if this zone breaks, a shakeout that sweeps wide liquidity could occur.
Risk management is the lifeline when RSI is already too high. Never FOMO-chase the price in an overbought zone if you don’t want to fall into a shark’s “bull trap” . Always set a clear Stop Loss and allocate capital wisely.
What do you think—will $VELO continue to skyrocket by breaking resistance, or will there be a sudden dump shake that flushes out weak hands before it flies again? Leave a comment below!
#Velodrome #BinanceSquare
🚨 $VELO Alarm: Wild Pump Surge or the Ultimate FOMO Trap?
The crypto market has never stopped coming up with breathless surprises, and the current spotlight is on $VELODROMEUSDT. If you’re about to go “all-in” on this wave, stop for 2 minutes and read the analysis below right away so you don’t become prey for the sharks!
Looking at the current data table, $VELO is sending out extremely exciting signals—yet it also carries deadly risk:
• Explosive trend: Both the M15 and H1 timeframes are in agreement on a bullish trend (strong bullish momentum). The bulls fully control the short-term game.
• “Crazy” trading volume: Volume has surged massively by 176.3%, indicating a huge wave of capital is pouring into $VELODROMEUSDT.
• Open Interest (OI) spikes 6.09% over the past hour, reaching beyond the 10 million USD mark. New money is still continuously flowing into the derivatives market.
• Overbought momentum: RSI 14 is at 85—an extremely hot zone. MACD still supports the buyers, but the RSI warns that profit-taking pressure could hit at any moment.
• Trading sentiment: The global Long/Short ratio is 1.92 (65.8% long), showing the community is extremely excited and chasing the top. However, notably, the Taker buy/sell ratio is 0.88 (the sell side is actively dumping on pullback moves).
What’s the trading strategy in this murky zone?
• Key resistance to watch: 0.03775 — if it breaks above this level with heavy volume, $VELO could establish a new price baseline.
• Safe support: 0.03505 — this is the bulls’ crucial launchpad; if this zone breaks, a shakeout that sweeps wide liquidity could occur.
Risk management is the lifeline when RSI is already too high. Never FOMO-chase the price in an overbought zone if you don’t want to fall into a shark’s “bull trap” . Always set a clear Stop Loss and allocate capital wisely.
What do you think—will $VELO continue to skyrocket by breaking resistance, or will there be a sudden dump shake that flushes out weak hands before it flies again? Leave a comment below!
#Velodrome #BinanceSquare
The crypto market has never stopped coming up with breathless surprises, and the current spotlight is on $VELODROMEUSDT. If you’re about to go “all-in” on this wave, stop for 2 minutes and read the analysis below right away so you don’t become prey for the sharks!
Looking at the current data table, $VELO is sending out extremely exciting signals—yet it also carries deadly risk:
• Explosive trend: Both the M15 and H1 timeframes are in agreement on a bullish trend (strong bullish momentum). The bulls fully control the short-term game.
• “Crazy” trading volume: Volume has surged massively by 176.3%, indicating a huge wave of capital is pouring into $VELODROMEUSDT.
• Open Interest (OI) spikes 6.09% over the past hour, reaching beyond the 10 million USD mark. New money is still continuously flowing into the derivatives market.
• Overbought momentum: RSI 14 is at 85—an extremely hot zone. MACD still supports the buyers, but the RSI warns that profit-taking pressure could hit at any moment.
• Trading sentiment: The global Long/Short ratio is 1.92 (65.8% long), showing the community is extremely excited and chasing the top. However, notably, the Taker buy/sell ratio is 0.88 (the sell side is actively dumping on pullback moves).
What’s the trading strategy in this murky zone?
• Key resistance to watch: 0.03775 — if it breaks above this level with heavy volume, $VELO could establish a new price baseline.
• Safe support: 0.03505 — this is the bulls’ crucial launchpad; if this zone breaks, a shakeout that sweeps wide liquidity could occur.
Risk management is the lifeline when RSI is already too high. Never FOMO-chase the price in an overbought zone if you don’t want to fall into a shark’s “bull trap” . Always set a clear Stop Loss and allocate capital wisely.
What do you think—will $VELO continue to skyrocket by breaking resistance, or will there be a sudden dump shake that flushes out weak hands before it flies again? Leave a comment below!
#Velodrome #BinanceSquare
86
·
--
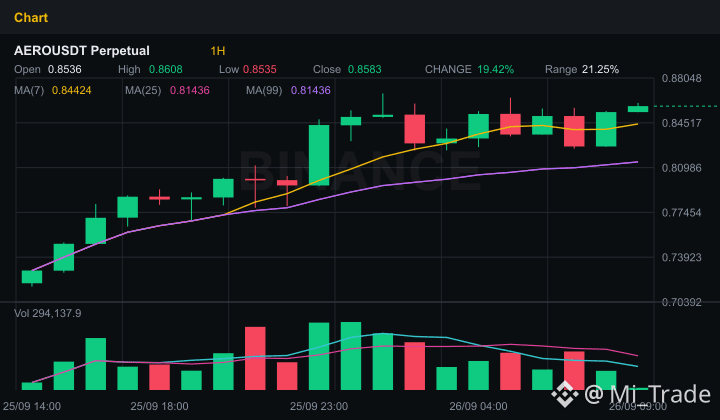
🔥 $AERO Broke Through Well or a Trap in the Making? Insights from a Pro Trader!
The crypto market always knows how to test a trader’s patience, and $AERO is currently at the center of attention with highly unpredictable price movements. Is this a chance to get on board, or a trick from a "whale"? Let’s break down the data right now!
From a technical perspective, $AERO is showing several notable signals:
• Trend & Momentum: The price structure on the M15 and H1 timeframes both align with an upward (bullish) trend. The RSI at 65.6 suggests buyers are in control, but not yet in an excessively dangerous overbought zone—paired with the MACD supporting the bullish outlook.
• Volume Paradox: Trading volume has dropped sharply by 51.6%. This is a point everyone should be extremely careful about—prices are rising, but thinning liquidity may indicate that the bulls are starting to run out of steam.
• Funds Flow & Sentiment: Open Interest (OI) is up 3.05%, suggesting new capital continues to flow into futures contracts. The global Long/Short ratio is 1.56 (61% Long), and the Taker Buy/Sell ratio is 1.27—showing that buyers are still holding control of the battlefield.
• Key Price Zones:
- Strong Support: 0.8233
- Potential Resistance: 0.8683
The trading strategy right now is to be patient and observe how price reacts at the resistance zone. Don’t FOMO into the highs while trading volume is weakening. Place a tight stop-loss below the support zone to protect your account against sudden liquidity sweeps from the market.
What position are you holding with $AERO right now? Share your perspective in the comments!
#AERO #BinanceSquare
🔥 $AERO Broke Through Well or a Trap in the Making? Insights from a Pro Trader!
The crypto market always knows how to test a trader’s patience, and $AERO is currently at the center of attention with highly unpredictable price movements. Is this a chance to get on board, or a trick from a "whale"? Let’s break down the data right now!
From a technical perspective, $AERO is showing several notable signals:
• Trend & Momentum: The price structure on the M15 and H1 timeframes both align with an upward (bullish) trend. The RSI at 65.6 suggests buyers are in control, but not yet in an excessively dangerous overbought zone—paired with the MACD supporting the bullish outlook.
• Volume Paradox: Trading volume has dropped sharply by 51.6%. This is a point everyone should be extremely careful about—prices are rising, but thinning liquidity may indicate that the bulls are starting to run out of steam.
• Funds Flow & Sentiment: Open Interest (OI) is up 3.05%, suggesting new capital continues to flow into futures contracts. The global Long/Short ratio is 1.56 (61% Long), and the Taker Buy/Sell ratio is 1.27—showing that buyers are still holding control of the battlefield.
• Key Price Zones:
- Strong Support: 0.8233
- Potential Resistance: 0.8683
The trading strategy right now is to be patient and observe how price reacts at the resistance zone. Don’t FOMO into the highs while trading volume is weakening. Place a tight stop-loss below the support zone to protect your account against sudden liquidity sweeps from the market.
What position are you holding with $AERO right now? Share your perspective in the comments!
#AERO #BinanceSquare
The crypto market always knows how to test a trader’s patience, and $AERO is currently at the center of attention with highly unpredictable price movements. Is this a chance to get on board, or a trick from a "whale"? Let’s break down the data right now!
From a technical perspective, $AERO is showing several notable signals:
• Trend & Momentum: The price structure on the M15 and H1 timeframes both align with an upward (bullish) trend. The RSI at 65.6 suggests buyers are in control, but not yet in an excessively dangerous overbought zone—paired with the MACD supporting the bullish outlook.
• Volume Paradox: Trading volume has dropped sharply by 51.6%. This is a point everyone should be extremely careful about—prices are rising, but thinning liquidity may indicate that the bulls are starting to run out of steam.
• Funds Flow & Sentiment: Open Interest (OI) is up 3.05%, suggesting new capital continues to flow into futures contracts. The global Long/Short ratio is 1.56 (61% Long), and the Taker Buy/Sell ratio is 1.27—showing that buyers are still holding control of the battlefield.
• Key Price Zones:
- Strong Support: 0.8233
- Potential Resistance: 0.8683
The trading strategy right now is to be patient and observe how price reacts at the resistance zone. Don’t FOMO into the highs while trading volume is weakening. Place a tight stop-loss below the support zone to protect your account against sudden liquidity sweeps from the market.
What position are you holding with $AERO right now? Share your perspective in the comments!
#AERO #BinanceSquare
67
·
--
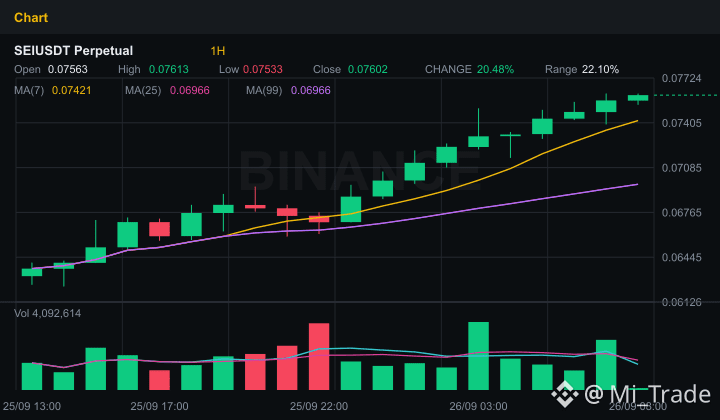
🔥 $SEI Is It a Price Pump or a Trap? The Whales Are Planning Something—What Is It? 🔥
The crypto market never runs out of excitement, and all eyes right now are on $SEI as capital begins to rush in. Is this a golden opportunity or a major scheme from the exchange house? Let’s quickly break down the on-chain and technical data right now!
Looking at the bigger picture of $SEI, the indicators are sending out some extremely interesting signals:
• Trend & Momentum: Both the M15 and H1 timeframes are turning a strong bullish green. MACD supports the buy side, but RSI-14 has jumped to 77.2—an overbought zone. The bulls are very excited, but they’re also starting to breathe hard.
• Flow of Funds & Volume: Trading volume has surged up by 20.8%, together with Open Interest (OI) rising 4.73% over the past hour (nearing 19.2 million USD). This shows that fresh money is truly flowing into the market, not just old positions getting closed.
• Trading Sentiment: The global Long/Short ratio is 2.24 (69.2% Long orders), and Top Traders hold up to 72.3% of Long positions (ratio 2.61). However, one detail worth pondering is that the Taker Buy/Sell Ratio is 0.79—suggesting that active sell pressure from the Short side is still quietly blocking the way up.
• Key Price Zones: Stubborn support at 0.06861 and resistance close by at 0.07614. Breaking through this resistance, $SEI will open up a whole new sky.
Trading strategy right now requires a cool head. RSI being too high warns of the risk of an unexpected liquidity sweep (a long squeeze) before any further upside. Don’t FOMO into the top at any cost—either split your capital or wait for a retest of support. Always set a clean stop-loss (SL) to protect your account before thinking about profits.
Brothers, are you holding any $SEI Long positions—or have you silently taken profit already? Drop your thoughts in the comments!
#SEIUSDT #BinanceSquare
🔥 $SEI Is It a Price Pump or a Trap? The Whales Are Planning Something—What Is It? 🔥
The crypto market never runs out of excitement, and all eyes right now are on $SEI as capital begins to rush in. Is this a golden opportunity or a major scheme from the exchange house? Let’s quickly break down the on-chain and technical data right now!
Looking at the bigger picture of $SEI , the indicators are sending out some extremely interesting signals:
• Trend & Momentum: Both the M15 and H1 timeframes are turning a strong bullish green. MACD supports the buy side, but RSI-14 has jumped to 77.2—an overbought zone. The bulls are very excited, but they’re also starting to breathe hard.
• Flow of Funds & Volume: Trading volume has surged up by 20.8%, together with Open Interest (OI) rising 4.73% over the past hour (nearing 19.2 million USD). This shows that fresh money is truly flowing into the market, not just old positions getting closed.
• Trading Sentiment: The global Long/Short ratio is 2.24 (69.2% Long orders), and Top Traders hold up to 72.3% of Long positions (ratio 2.61). However, one detail worth pondering is that the Taker Buy/Sell Ratio is 0.79—suggesting that active sell pressure from the Short side is still quietly blocking the way up.
• Key Price Zones: Stubborn support at 0.06861 and resistance close by at 0.07614. Breaking through this resistance, $SEI will open up a whole new sky.
Trading strategy right now requires a cool head. RSI being too high warns of the risk of an unexpected liquidity sweep (a long squeeze) before any further upside. Don’t FOMO into the top at any cost—either split your capital or wait for a retest of support. Always set a clean stop-loss (SL) to protect your account before thinking about profits.
Brothers, are you holding any $SEI Long positions—or have you silently taken profit already? Drop your thoughts in the comments!
#SEIUSDT #BinanceSquare
The crypto market never runs out of excitement, and all eyes right now are on $SEI as capital begins to rush in. Is this a golden opportunity or a major scheme from the exchange house? Let’s quickly break down the on-chain and technical data right now!
Looking at the bigger picture of $SEI , the indicators are sending out some extremely interesting signals:
• Trend & Momentum: Both the M15 and H1 timeframes are turning a strong bullish green. MACD supports the buy side, but RSI-14 has jumped to 77.2—an overbought zone. The bulls are very excited, but they’re also starting to breathe hard.
• Flow of Funds & Volume: Trading volume has surged up by 20.8%, together with Open Interest (OI) rising 4.73% over the past hour (nearing 19.2 million USD). This shows that fresh money is truly flowing into the market, not just old positions getting closed.
• Trading Sentiment: The global Long/Short ratio is 2.24 (69.2% Long orders), and Top Traders hold up to 72.3% of Long positions (ratio 2.61). However, one detail worth pondering is that the Taker Buy/Sell Ratio is 0.79—suggesting that active sell pressure from the Short side is still quietly blocking the way up.
• Key Price Zones: Stubborn support at 0.06861 and resistance close by at 0.07614. Breaking through this resistance, $SEI will open up a whole new sky.
Trading strategy right now requires a cool head. RSI being too high warns of the risk of an unexpected liquidity sweep (a long squeeze) before any further upside. Don’t FOMO into the top at any cost—either split your capital or wait for a retest of support. Always set a clean stop-loss (SL) to protect your account before thinking about profits.
Brothers, are you holding any $SEI Long positions—or have you silently taken profit already? Drop your thoughts in the comments!
#SEIUSDT #BinanceSquare
120
·
--
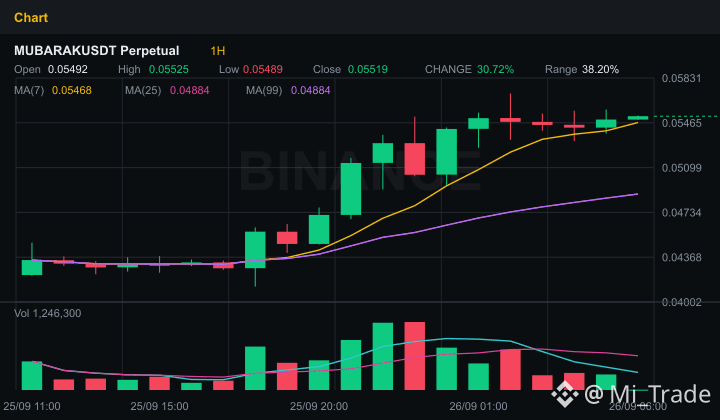
🔥 Is the Whale Accumulating Orders? Big Waves Are About to Sweep Through $MUBARAK !
Hello traders on Binance Square! The market has been moving sideways in a frustrating way on the H1 timeframe, making many of you feel discouraged and ready to leave the battlefield. But be careful—those “boring” moments can actually be the perfect cover for last-minute order flips. Is $MUBARAK preparing for an outstanding breakout?
Let’s break down the latest technical numbers right now to find clues about smart money flows:
• Trend & Momentum: The M15 timeframe is sending a bullish signal quite smoothly, even though H1 is still ranging/accumulating sideways. RSI 14 is at 55.6, and MACD supports the buyers, showing that the rebound strength is still in control.
• Volume & Derivatives: Trading volume is down slightly by -11.6, indicating that selling pressure has run out and both sides are temporarily holding their ground. The notable point is that Open Interest (OI) is up 1.17%, suggesting new money is still quietly flowing into positions.
• “Whales” vs “Crowd” Sentiment: The whole market is split into two sides, with a globally balanced Long/Short ratio (Long 49.6% - Short 50.4%). However, the “Whales” (Top Traders) are holding as much as 77% of the Long positions (ratio 3.34). Clearly, smart money is placing a very strong bet on the upside door of $MUBARAK!
• Key Price Zone:
- Hard support: 0.04921 (a safe foothold for the buyers).
- Near resistance: 0.05705 (the wall that needs to be broken to trigger a strong upward wave).
The market isn’t for the impatient. With whales accumulating in this price area, a liquidity sweep up to resistance could happen at any time.
Brothers and sisters, always follow risk-management principles—set a tight stoploss just below the 0.04921 support zone to avoid unexpected shakeouts.
According to you, will $MUBARAK break above resistance 0.05705 this week, or will there be a dump/shakeout first before takeoff? Leave your thoughts in the comments!
#MUBARAK #TechnicalAnalysis
🔥 Is the Whale Accumulating Orders? Big Waves Are About to Sweep Through $MUBARAK !
Hello traders on Binance Square! The market has been moving sideways in a frustrating way on the H1 timeframe, making many of you feel discouraged and ready to leave the battlefield. But be careful—those “boring” moments can actually be the perfect cover for last-minute order flips. Is $MUBARAK preparing for an outstanding breakout?
Let’s break down the latest technical numbers right now to find clues about smart money flows:
• Trend & Momentum: The M15 timeframe is sending a bullish signal quite smoothly, even though H1 is still ranging/accumulating sideways. RSI 14 is at 55.6, and MACD supports the buyers, showing that the rebound strength is still in control.
• Volume & Derivatives: Trading volume is down slightly by -11.6, indicating that selling pressure has run out and both sides are temporarily holding their ground. The notable point is that Open Interest (OI) is up 1.17%, suggesting new money is still quietly flowing into positions.
• “Whales” vs “Crowd” Sentiment: The whole market is split into two sides, with a globally balanced Long/Short ratio (Long 49.6% - Short 50.4%). However, the “Whales” (Top Traders) are holding as much as 77% of the Long positions (ratio 3.34). Clearly, smart money is placing a very strong bet on the upside door of $MUBARAK !
• Key Price Zone:
- Hard support: 0.04921 (a safe foothold for the buyers).
- Near resistance: 0.05705 (the wall that needs to be broken to trigger a strong upward wave).
The market isn’t for the impatient. With whales accumulating in this price area, a liquidity sweep up to resistance could happen at any time.
Brothers and sisters, always follow risk-management principles—set a tight stoploss just below the 0.04921 support zone to avoid unexpected shakeouts.
According to you, will $MUBARAK break above resistance 0.05705 this week, or will there be a dump/shakeout first before takeoff? Leave your thoughts in the comments!
#MUBARAK #TechnicalAnalysis
Hello traders on Binance Square! The market has been moving sideways in a frustrating way on the H1 timeframe, making many of you feel discouraged and ready to leave the battlefield. But be careful—those “boring” moments can actually be the perfect cover for last-minute order flips. Is $MUBARAK preparing for an outstanding breakout?
Let’s break down the latest technical numbers right now to find clues about smart money flows:
• Trend & Momentum: The M15 timeframe is sending a bullish signal quite smoothly, even though H1 is still ranging/accumulating sideways. RSI 14 is at 55.6, and MACD supports the buyers, showing that the rebound strength is still in control.
• Volume & Derivatives: Trading volume is down slightly by -11.6, indicating that selling pressure has run out and both sides are temporarily holding their ground. The notable point is that Open Interest (OI) is up 1.17%, suggesting new money is still quietly flowing into positions.
• “Whales” vs “Crowd” Sentiment: The whole market is split into two sides, with a globally balanced Long/Short ratio (Long 49.6% - Short 50.4%). However, the “Whales” (Top Traders) are holding as much as 77% of the Long positions (ratio 3.34). Clearly, smart money is placing a very strong bet on the upside door of $MUBARAK !
• Key Price Zone:
- Hard support: 0.04921 (a safe foothold for the buyers).
- Near resistance: 0.05705 (the wall that needs to be broken to trigger a strong upward wave).
The market isn’t for the impatient. With whales accumulating in this price area, a liquidity sweep up to resistance could happen at any time.
Brothers and sisters, always follow risk-management principles—set a tight stoploss just below the 0.04921 support zone to avoid unexpected shakeouts.
According to you, will $MUBARAK break above resistance 0.05705 this week, or will there be a dump/shakeout first before takeoff? Leave your thoughts in the comments!
#MUBARAK #TechnicalAnalysis
72
·
--
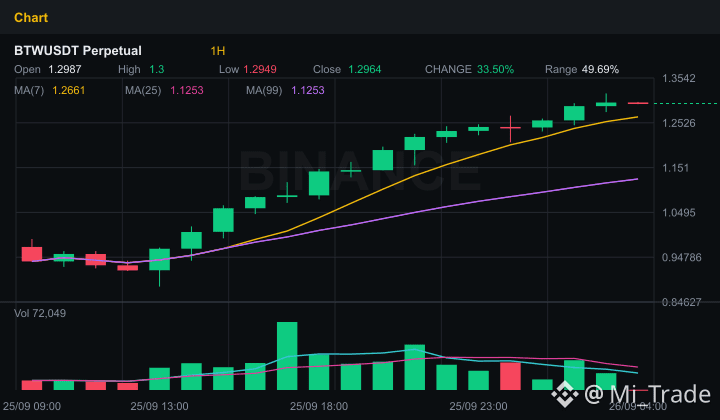
🚨 Alarm for $BTWUSDT: RSI Overbought—Will There Be a “Rug Pull” Record?
Fellow traders holding $BTWUSDT, you’re probably sitting on a pile of fire, right? The chart looks great, but the data behind it is whispering extremely dangerous warnings. Let’s break down the market situation right now so you don’t become “liquidity” for the sharks!
Looking at the technical picture and current money flow, here are the points you absolutely need to remember:
• Trend & Momentum: The M15 and H1 timeframes are still pointing up (bullish), with MACD supporting the buyers. However, RSI(14) has surged to 95.5—a terrifying “overbought” level. It’s like a race car going 300 km/h, but it’s about to run out of fuel; the pulling force is very unstable.
• Liquidity & Volume: Trading volume has unexpectedly dropped miserably by -64.8%. Price is rising without volume behind it—that’s a classic sign of an obvious “pump and dump.”
• Long/Short Battle:
- Retail Traders (Global): They’re afraid to short, with 65.7% of orders on the Short side; the Long/Short ratio is only 0.52.
- “Whales” (Top Trader): Completely the opposite—they’re confident and accumulating, with 66.2% holding Long positions (ratio 1.96). Looks like “smart money” still wants to push the price a bit more to wipe out the crowd’s liquidity.
• Key Price Zones: Hard support is at 1.1506, and important resistance is at 1.3192. If $BTWUSDT breaks this zone, the volatility will get extremely wild.
My sincere advice right now: RSI 95.5 is not the place to FOMO-buy. Be extremely careful with Long positions near the top price area, and be ready with SL (stop-loss) if the market suddenly flips. Capital management is the only key that helps traders survive in this brutal crypto market.
What do you think, will $BTWUSDT break the resistance at 1.31$ , or will there be a drop that sweeps out the Long crowd before a real crash happens? Leave your thoughts in the comments!
#BTWUSDT #BinanceSquare
🚨 Alarm for $BTWUSDT: RSI Overbought—Will There Be a “Rug Pull” Record?
Fellow traders holding $BTWUSDT, you’re probably sitting on a pile of fire, right? The chart looks great, but the data behind it is whispering extremely dangerous warnings. Let’s break down the market situation right now so you don’t become “liquidity” for the sharks!
Looking at the technical picture and current money flow, here are the points you absolutely need to remember:
• Trend & Momentum: The M15 and H1 timeframes are still pointing up (bullish), with MACD supporting the buyers. However, RSI(14) has surged to 95.5—a terrifying “overbought” level. It’s like a race car going 300 km/h, but it’s about to run out of fuel; the pulling force is very unstable.
• Liquidity & Volume: Trading volume has unexpectedly dropped miserably by -64.8%. Price is rising without volume behind it—that’s a classic sign of an obvious “pump and dump.”
• Long/Short Battle:
- Retail Traders (Global): They’re afraid to short, with 65.7% of orders on the Short side; the Long/Short ratio is only 0.52.
- “Whales” (Top Trader): Completely the opposite—they’re confident and accumulating, with 66.2% holding Long positions (ratio 1.96). Looks like “smart money” still wants to push the price a bit more to wipe out the crowd’s liquidity.
• Key Price Zones: Hard support is at 1.1506, and important resistance is at 1.3192. If $BTWUSDT breaks this zone, the volatility will get extremely wild.
My sincere advice right now: RSI 95.5 is not the place to FOMO-buy. Be extremely careful with Long positions near the top price area, and be ready with SL (stop-loss) if the market suddenly flips. Capital management is the only key that helps traders survive in this brutal crypto market.
What do you think, will $BTWUSDT break the resistance at 1.31$ , or will there be a drop that sweeps out the Long crowd before a real crash happens? Leave your thoughts in the comments!
#BTWUSDT #BinanceSquare
Fellow traders holding $BTWUSDT, you’re probably sitting on a pile of fire, right? The chart looks great, but the data behind it is whispering extremely dangerous warnings. Let’s break down the market situation right now so you don’t become “liquidity” for the sharks!
Looking at the technical picture and current money flow, here are the points you absolutely need to remember:
• Trend & Momentum: The M15 and H1 timeframes are still pointing up (bullish), with MACD supporting the buyers. However, RSI(14) has surged to 95.5—a terrifying “overbought” level. It’s like a race car going 300 km/h, but it’s about to run out of fuel; the pulling force is very unstable.
• Liquidity & Volume: Trading volume has unexpectedly dropped miserably by -64.8%. Price is rising without volume behind it—that’s a classic sign of an obvious “pump and dump.”
• Long/Short Battle:
- Retail Traders (Global): They’re afraid to short, with 65.7% of orders on the Short side; the Long/Short ratio is only 0.52.
- “Whales” (Top Trader): Completely the opposite—they’re confident and accumulating, with 66.2% holding Long positions (ratio 1.96). Looks like “smart money” still wants to push the price a bit more to wipe out the crowd’s liquidity.
• Key Price Zones: Hard support is at 1.1506, and important resistance is at 1.3192. If $BTWUSDT breaks this zone, the volatility will get extremely wild.
My sincere advice right now: RSI 95.5 is not the place to FOMO-buy. Be extremely careful with Long positions near the top price area, and be ready with SL (stop-loss) if the market suddenly flips. Capital management is the only key that helps traders survive in this brutal crypto market.
What do you think, will $BTWUSDT break the resistance at 1.31$ , or will there be a drop that sweeps out the Long crowd before a real crash happens? Leave your thoughts in the comments!
#BTWUSDT #BinanceSquare
34
·
--
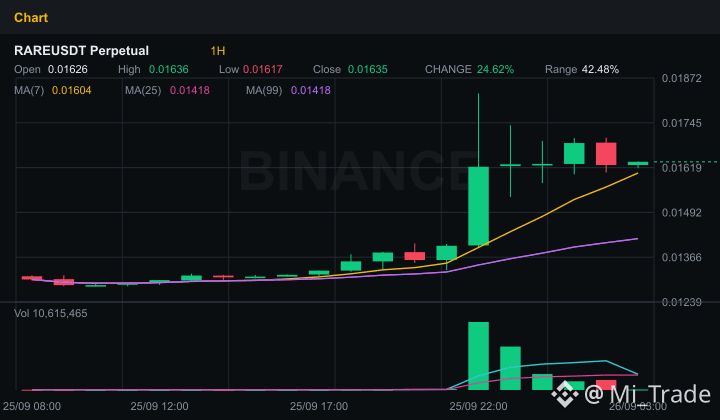
🚨 RARE “Hidden Current” ALERT $RARE: Liquidity trap or a chance for a maximum breakout?
The crypto market is always full of visual tricks that can leave traders disoriented. Looking at the chart of $RARE right now, do you see any underlying instability behind that refreshing green?
Let’s “dissect” the key numbers from on-chain and technical data so you don’t fall into a whale trap:
• Trend & Momentum: The M15 and H1 timeframes both flip bullish signals, with RSI at 54.7 and MACD supporting the buyers. The short-term trend is clearly favoring the bulls.
• Volume Paradox: Trading volume unexpectedly plunges by as much as 41.6%. This is an extremely suspicious sign that big money hasn’t truly stepped in—so the current uptrend might just be a trap to lure and then dump (bull trap).
• Derivatives Data & Open Interest: Open Interest rises slightly by 3.4% (to over 3.23 million USD), suggesting speculative funds are still probing the market. Notably, the funding rate is deeply negative (-0.46%)—a dangerous weapon that whales are using to “pluck” the stubborn Short side.
• Crowd Sentiment: The global Long/Short ratio is heavily tilted toward longs, with 69.5% being Long orders (Global L/S Ratio at 2.28). However, the Top Traders are extremely cautious since this ratio is almost balanced (51% Long vs 49% Short), showing that the “whales” haven’t fully revealed their hand.
📍 The “life-or-death” price levels to pin right away:
- Hard Support: 0.01329
- Potential Resistance: 0.01828
While other altcoins like PHA or LYN are surging hard, $RARE is lagging in liquidity. Don’t let greed blind you with seemingly green numbers and a red-empty heart. Always set your Stop Loss carefully below the support zone to protect your capital before the market flips.
Are you holding any Long positions of $RARE right now, or are you ready to short against the current? Leave your thoughts in the comments below!
#RARE #BinanceSquare
🚨 RARE “Hidden Current” ALERT $RARE : Liquidity trap or a chance for a maximum breakout?
The crypto market is always full of visual tricks that can leave traders disoriented. Looking at the chart of $RARE right now, do you see any underlying instability behind that refreshing green?
Let’s “dissect” the key numbers from on-chain and technical data so you don’t fall into a whale trap:
• Trend & Momentum: The M15 and H1 timeframes both flip bullish signals, with RSI at 54.7 and MACD supporting the buyers. The short-term trend is clearly favoring the bulls.
• Volume Paradox: Trading volume unexpectedly plunges by as much as 41.6%. This is an extremely suspicious sign that big money hasn’t truly stepped in—so the current uptrend might just be a trap to lure and then dump (bull trap).
• Derivatives Data & Open Interest: Open Interest rises slightly by 3.4% (to over 3.23 million USD), suggesting speculative funds are still probing the market. Notably, the funding rate is deeply negative (-0.46%)—a dangerous weapon that whales are using to “pluck” the stubborn Short side.
• Crowd Sentiment: The global Long/Short ratio is heavily tilted toward longs, with 69.5% being Long orders (Global L/S Ratio at 2.28). However, the Top Traders are extremely cautious since this ratio is almost balanced (51% Long vs 49% Short), showing that the “whales” haven’t fully revealed their hand.
📍 The “life-or-death” price levels to pin right away:
- Hard Support: 0.01329
- Potential Resistance: 0.01828
While other altcoins like PHA or LYN are surging hard, $RARE is lagging in liquidity. Don’t let greed blind you with seemingly green numbers and a red-empty heart. Always set your Stop Loss carefully below the support zone to protect your capital before the market flips.
Are you holding any Long positions of $RARE right now, or are you ready to short against the current? Leave your thoughts in the comments below!
#RARE #BinanceSquare
The crypto market is always full of visual tricks that can leave traders disoriented. Looking at the chart of $RARE right now, do you see any underlying instability behind that refreshing green?
Let’s “dissect” the key numbers from on-chain and technical data so you don’t fall into a whale trap:
• Trend & Momentum: The M15 and H1 timeframes both flip bullish signals, with RSI at 54.7 and MACD supporting the buyers. The short-term trend is clearly favoring the bulls.
• Volume Paradox: Trading volume unexpectedly plunges by as much as 41.6%. This is an extremely suspicious sign that big money hasn’t truly stepped in—so the current uptrend might just be a trap to lure and then dump (bull trap).
• Derivatives Data & Open Interest: Open Interest rises slightly by 3.4% (to over 3.23 million USD), suggesting speculative funds are still probing the market. Notably, the funding rate is deeply negative (-0.46%)—a dangerous weapon that whales are using to “pluck” the stubborn Short side.
• Crowd Sentiment: The global Long/Short ratio is heavily tilted toward longs, with 69.5% being Long orders (Global L/S Ratio at 2.28). However, the Top Traders are extremely cautious since this ratio is almost balanced (51% Long vs 49% Short), showing that the “whales” haven’t fully revealed their hand.
📍 The “life-or-death” price levels to pin right away:
- Hard Support: 0.01329
- Potential Resistance: 0.01828
While other altcoins like PHA or LYN are surging hard, $RARE is lagging in liquidity. Don’t let greed blind you with seemingly green numbers and a red-empty heart. Always set your Stop Loss carefully below the support zone to protect your capital before the market flips.
Are you holding any Long positions of $RARE right now, or are you ready to short against the current? Leave your thoughts in the comments below!
#RARE #BinanceSquare
16
·
--
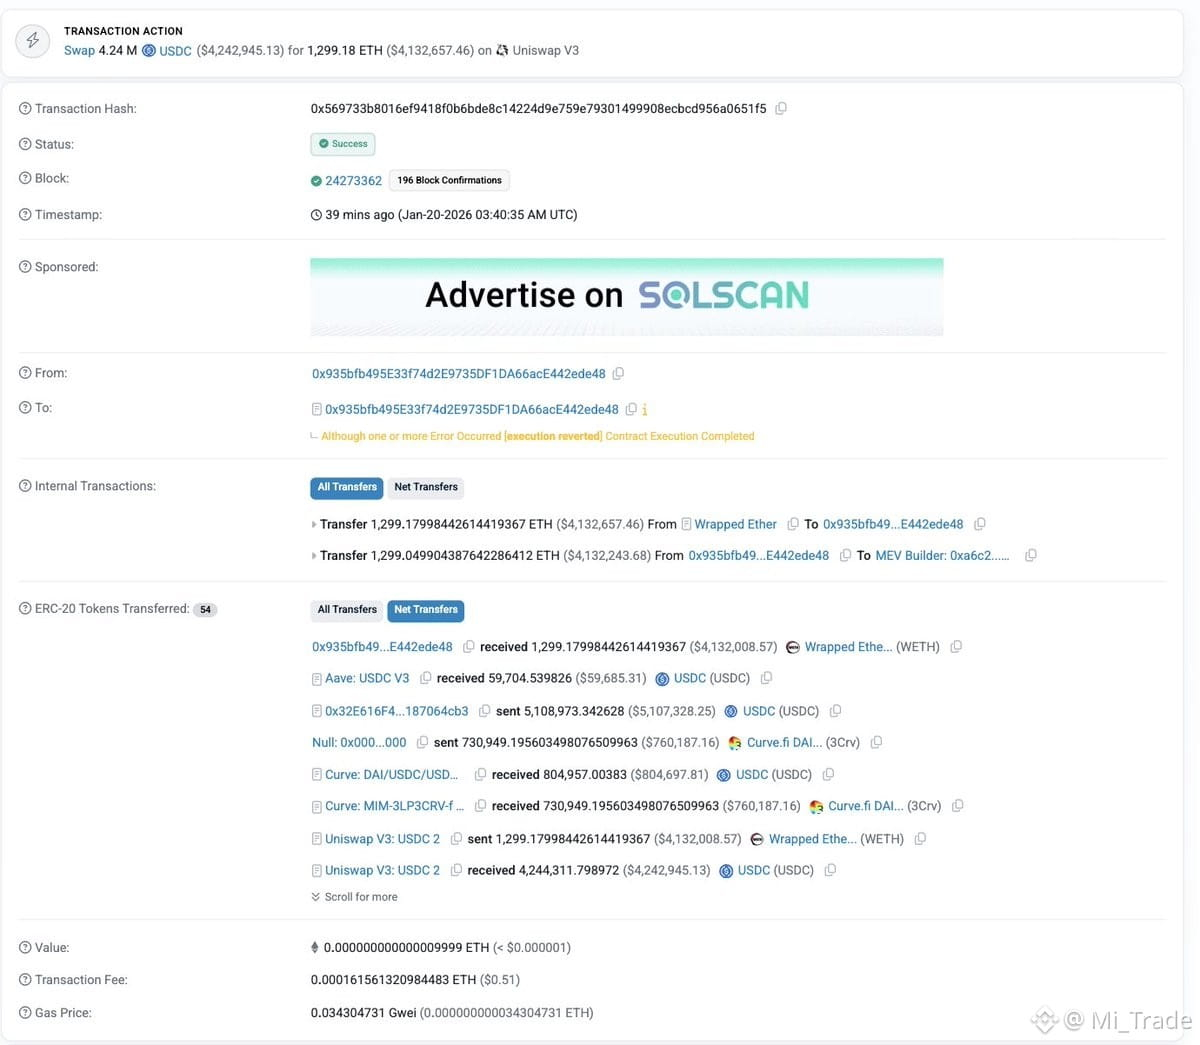
The @makinafi protocol has just recorded a security incident in which approximately 1,299 #ETH (equivalent to 4.13 million USD) was stolen. The hacker’s transaction was blocked by the MEV Builder beforehand (frontrun). The amount of assets stolen is currently held in two different wallet addresses, valued at 3.3 million USD and 880K USD respectively.
👀 Market Watch: #ETH
#RSSNew #AIStocksWhatNext
The @makinafi protocol has just recorded a security incident in which approximately 1,299 #ETH (equivalent to 4.13 million USD) was stolen. The hacker’s transaction was blocked by the MEV Builder beforehand (frontrun). The amount of assets stolen is currently held in two different wallet addresses, valued at 3.3 million USD and 880K USD respectively.
👀 Market Watch: #ETH
#RSSNew #AIStocksWhatNext
👀 Market Watch: #ETH
#RSSNew #AIStocksWhatNext
79
·
--
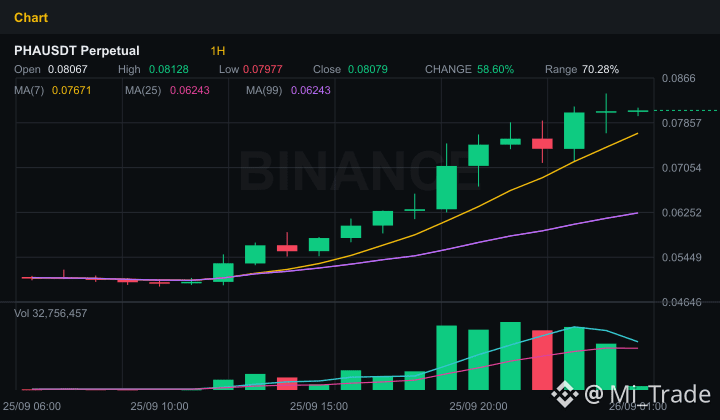
🚨 Are whales accumulating orders? An exclusive look at $PHA’s turnaround!
The crypto market is always ruthless to those who lack patience, and the recent fluctuations of $PHA are creating a so-called "psychological trap" that’s leaving many traders scratching their heads. Are you feeling restless right now?
Let’s break down how the real money is moving through the technical data below:
• Trend: The M15 and H1 timeframes are both aligned in bright green "bullish". Buyers currently hold short-term control, pushing the price toward key resistance zones.
• Momentum: RSI at 62.2 is just right for growth without being overbought, supported by MACD pushing the uptrend. However, trading volume has dropped sharply to -45.7%. This is a warning sign—"the bulls are slightly running out of steam" in terms of liquidity. A strong volume surge is needed to break through resistance.
• Derivatives: Open Interest (OI) remains stable, but the interesting part is the negative Funding Rate (-0.0533%). This suggests Shorts are paying fees to Longs—an classic signal that selling pressure may be running out, and whales might be quietly accumulating ahead of a potential "short squeeze."
• Crowd Sentiment (Positioning): The global Long/Short ratio leans toward Short (57.8% short orders), while Top Traders are split fairly evenly (48.9% Long vs 51.1% Short). The crowd is fearful—and that’s often when opportunities appear!
Trading strategy for $PHA right now:
• Hard support zone: 0.05907
• Resistance zone to conquer: 0.08383
Risk management advice: Even though the short-term trend favors buyers, the drop in volume means you must absolutely not "fomo" and chase the top. Split your capital, place a tight Stop Loss below the support zone to protect your account against unexpected liquidity sweeps from whales.
What do you think about $PHA ’s current move? Is this a strong breakout—or just a classic Long trap? Leave your thoughts in the comments below!
#PHA #CryptoAnalysis
🚨 Are whales accumulating orders? An exclusive look at $PHA ’s turnaround!
The crypto market is always ruthless to those who lack patience, and the recent fluctuations of $PHA are creating a so-called "psychological trap" that’s leaving many traders scratching their heads. Are you feeling restless right now?
Let’s break down how the real money is moving through the technical data below:
• Trend: The M15 and H1 timeframes are both aligned in bright green "bullish". Buyers currently hold short-term control, pushing the price toward key resistance zones.
• Momentum: RSI at 62.2 is just right for growth without being overbought, supported by MACD pushing the uptrend. However, trading volume has dropped sharply to -45.7%. This is a warning sign—"the bulls are slightly running out of steam" in terms of liquidity. A strong volume surge is needed to break through resistance.
• Derivatives: Open Interest (OI) remains stable, but the interesting part is the negative Funding Rate (-0.0533%). This suggests Shorts are paying fees to Longs—an classic signal that selling pressure may be running out, and whales might be quietly accumulating ahead of a potential "short squeeze."
• Crowd Sentiment (Positioning): The global Long/Short ratio leans toward Short (57.8% short orders), while Top Traders are split fairly evenly (48.9% Long vs 51.1% Short). The crowd is fearful—and that’s often when opportunities appear!
Trading strategy for $PHA right now:
• Hard support zone: 0.05907
• Resistance zone to conquer: 0.08383
Risk management advice: Even though the short-term trend favors buyers, the drop in volume means you must absolutely not "fomo" and chase the top. Split your capital, place a tight Stop Loss below the support zone to protect your account against unexpected liquidity sweeps from whales.
What do you think about $PHA ’s current move? Is this a strong breakout—or just a classic Long trap? Leave your thoughts in the comments below!
#PHA #CryptoAnalysis
The crypto market is always ruthless to those who lack patience, and the recent fluctuations of $PHA are creating a so-called "psychological trap" that’s leaving many traders scratching their heads. Are you feeling restless right now?
Let’s break down how the real money is moving through the technical data below:
• Trend: The M15 and H1 timeframes are both aligned in bright green "bullish". Buyers currently hold short-term control, pushing the price toward key resistance zones.
• Momentum: RSI at 62.2 is just right for growth without being overbought, supported by MACD pushing the uptrend. However, trading volume has dropped sharply to -45.7%. This is a warning sign—"the bulls are slightly running out of steam" in terms of liquidity. A strong volume surge is needed to break through resistance.
• Derivatives: Open Interest (OI) remains stable, but the interesting part is the negative Funding Rate (-0.0533%). This suggests Shorts are paying fees to Longs—an classic signal that selling pressure may be running out, and whales might be quietly accumulating ahead of a potential "short squeeze."
• Crowd Sentiment (Positioning): The global Long/Short ratio leans toward Short (57.8% short orders), while Top Traders are split fairly evenly (48.9% Long vs 51.1% Short). The crowd is fearful—and that’s often when opportunities appear!
Trading strategy for $PHA right now:
• Hard support zone: 0.05907
• Resistance zone to conquer: 0.08383
Risk management advice: Even though the short-term trend favors buyers, the drop in volume means you must absolutely not "fomo" and chase the top. Split your capital, place a tight Stop Loss below the support zone to protect your account against unexpected liquidity sweeps from whales.
What do you think about $PHA ’s current move? Is this a strong breakout—or just a classic Long trap? Leave your thoughts in the comments below!
#PHA #CryptoAnalysis
2
44
·
--
🔥 $LYN ALERT: Are Max Buying Orders the Breakout Opportunity or a Liquidity Trap Waiting to Happen?
Hey traders, the market is extremely euphoric right now, but it’s also packed with risks. If you’ve been eyeing $LYN, pause for 2 minutes and read this hot analysis before you put in any money!
On-chain and technical data from $LYN are sending out highly explosive signals—yet they come with a blazing red warning:
- Trend & Momentum: The M15 and H1 timeframes are both extremely bullish (strong price increases). MACD is in agreement with the uptrend. However, RSI 14 has surged to 92.2—an iconic “overbought” zone—suggesting the bulls have pushed the price too far and could run out of steam at any moment.
- Flow of Funds & Volume: Trading volume has exploded, rising by 193.8%. Open Interest (OI) jumped 92.7% in just 1 hour, proving that speculative capital is rushing in very aggressively.
- Market Sentiment: The global Long/Short ratio is at 2.9 (74.4% Long orders). The Taker Buy/Sell ratio is 1.53, indicating the buy side dominates overwhelmingly, but profit-taking pressure is hovering overhead.
- Key Price Levels: Solid support around 0.0395 and strong resistance at 0.0715.
The surge of $LYN right now is like a “final sprint” at the end of the race. Whales might be accumulating—but they may also be ready to trigger sudden liquidation sweeps to shake out overly stretched Long positions.
Risk management is the key to survival right now: Absolutely don’t FOMO chase at the top when RSI is already too high. Either split your capital into multiple parts or wait for the price to retest safer support zones.
What do you think? Will $LYN break the 0.0715 resistance to set a new high—or will there be a deep pullback that wipes out the Long side? Drop your thoughts in the comments below!
#LYN #BinanceSquare
🔥 $LYN ALERT: Are Max Buying Orders the Breakout Opportunity or a Liquidity Trap Waiting to Happen?
Hey traders, the market is extremely euphoric right now, but it’s also packed with risks. If you’ve been eyeing $LYN , pause for 2 minutes and read this hot analysis before you put in any money!
On-chain and technical data from $LYN are sending out highly explosive signals—yet they come with a blazing red warning:
- Trend & Momentum: The M15 and H1 timeframes are both extremely bullish (strong price increases). MACD is in agreement with the uptrend. However, RSI 14 has surged to 92.2—an iconic “overbought” zone—suggesting the bulls have pushed the price too far and could run out of steam at any moment.
- Flow of Funds & Volume: Trading volume has exploded, rising by 193.8%. Open Interest (OI) jumped 92.7% in just 1 hour, proving that speculative capital is rushing in very aggressively.
- Market Sentiment: The global Long/Short ratio is at 2.9 (74.4% Long orders). The Taker Buy/Sell ratio is 1.53, indicating the buy side dominates overwhelmingly, but profit-taking pressure is hovering overhead.
- Key Price Levels: Solid support around 0.0395 and strong resistance at 0.0715.
The surge of $LYN right now is like a “final sprint” at the end of the race. Whales might be accumulating—but they may also be ready to trigger sudden liquidation sweeps to shake out overly stretched Long positions.
Risk management is the key to survival right now: Absolutely don’t FOMO chase at the top when RSI is already too high. Either split your capital into multiple parts or wait for the price to retest safer support zones.
What do you think? Will $LYN break the 0.0715 resistance to set a new high—or will there be a deep pullback that wipes out the Long side? Drop your thoughts in the comments below!
#LYN #BinanceSquare
Hey traders, the market is extremely euphoric right now, but it’s also packed with risks. If you’ve been eyeing $LYN , pause for 2 minutes and read this hot analysis before you put in any money!
On-chain and technical data from $LYN are sending out highly explosive signals—yet they come with a blazing red warning:
- Trend & Momentum: The M15 and H1 timeframes are both extremely bullish (strong price increases). MACD is in agreement with the uptrend. However, RSI 14 has surged to 92.2—an iconic “overbought” zone—suggesting the bulls have pushed the price too far and could run out of steam at any moment.
- Flow of Funds & Volume: Trading volume has exploded, rising by 193.8%. Open Interest (OI) jumped 92.7% in just 1 hour, proving that speculative capital is rushing in very aggressively.
- Market Sentiment: The global Long/Short ratio is at 2.9 (74.4% Long orders). The Taker Buy/Sell ratio is 1.53, indicating the buy side dominates overwhelmingly, but profit-taking pressure is hovering overhead.
- Key Price Levels: Solid support around 0.0395 and strong resistance at 0.0715.
The surge of $LYN right now is like a “final sprint” at the end of the race. Whales might be accumulating—but they may also be ready to trigger sudden liquidation sweeps to shake out overly stretched Long positions.
Risk management is the key to survival right now: Absolutely don’t FOMO chase at the top when RSI is already too high. Either split your capital into multiple parts or wait for the price to retest safer support zones.
What do you think? Will $LYN break the 0.0715 resistance to set a new high—or will there be a deep pullback that wipes out the Long side? Drop your thoughts in the comments below!
#LYN #BinanceSquare
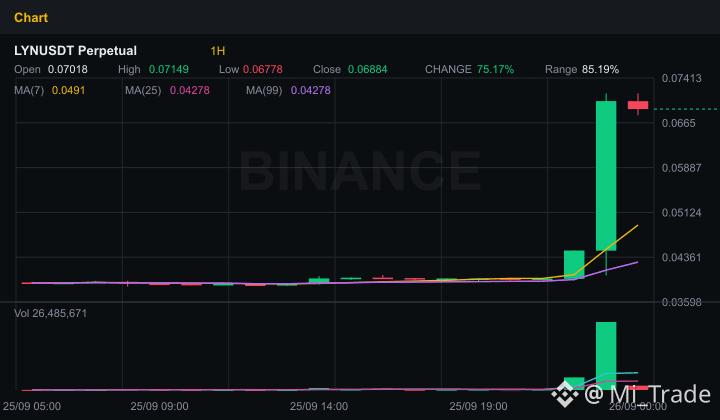
213
·
--
🔥 Rare Alert: Trading Volume Explodes by Nearly 5000% - What Are the Whales Planning?
The crypto market is never short of surprise “turnarounds,” and attention is currently focused on $RARE. If you’re sitting on the sidelines waiting or you might have “hit the top,” take a moment to break down the key numbers below!
On-chain data and technical signals from $RARE are emitting extremely hot signals that traders who “surf the waves” can’t ignore:
• Liquidity explosion: Trading volume has surged by an astonishing +4893%. Money is pouring into $RARE like a raging flood!
• Derivatives stream swirling: Open Interest (OI) in the past 1 hour jumped sharply by 58.16%, nearing the 3 million USD mark. Someone big is definitely setting up behind the scenes.
• Momentum & Trend: RSI-14 is hovering in the overbought zone (70.1), paired with bullish MACD and bullish trends on both the M15 and H1 timeframes. The buyers are fully controlling the short-term game.
• Mixed trading sentiment: Although the global Long/Short ratio leans toward Long (62.9%), the Taker Buy/Sell ratio is at 0.945 (selling pressure is slightly stronger at certain times). This suggests liquidity “shake-outs” (sweeping stops) could happen at any moment.
• Key price zones to watch: Strong support sits at magnh 0.01309, with the nearest resistance at 0.01828. If resistance breaks, $RARE has plenty of room ahead to soar alongside big names like $PHA and $ARK , who are leading the wave.
Surfing during an overbought RSI phase is like swinging a blade on the edge of a sword. High profits always come with extremely high risk. Always set a tight Stop Loss below the support zone and absolutely don’t “all-in” based on emotional FOMO.
What do you think about $RARE’s rally? Is this a real breakout—or just a sophisticated “bull trap” set by the whales? Leave your thoughts in the comments!
#RARE #BinanceSquare
🔥 Rare Alert: Trading Volume Explodes by Nearly 5000% - What Are the Whales Planning?
The crypto market is never short of surprise “turnarounds,” and attention is currently focused on $RARE . If you’re sitting on the sidelines waiting or you might have “hit the top,” take a moment to break down the key numbers below!
On-chain data and technical signals from $RARE are emitting extremely hot signals that traders who “surf the waves” can’t ignore:
• Liquidity explosion: Trading volume has surged by an astonishing +4893%. Money is pouring into $RARE like a raging flood!
• Derivatives stream swirling: Open Interest (OI) in the past 1 hour jumped sharply by 58.16%, nearing the 3 million USD mark. Someone big is definitely setting up behind the scenes.
• Momentum & Trend: RSI-14 is hovering in the overbought zone (70.1), paired with bullish MACD and bullish trends on both the M15 and H1 timeframes. The buyers are fully controlling the short-term game.
• Mixed trading sentiment: Although the global Long/Short ratio leans toward Long (62.9%), the Taker Buy/Sell ratio is at 0.945 (selling pressure is slightly stronger at certain times). This suggests liquidity “shake-outs” (sweeping stops) could happen at any moment.
• Key price zones to watch: Strong support sits at magnh 0.01309, with the nearest resistance at 0.01828. If resistance breaks, $RARE has plenty of room ahead to soar alongside big names like $PHA and $ARK , who are leading the wave.
Surfing during an overbought RSI phase is like swinging a blade on the edge of a sword. High profits always come with extremely high risk. Always set a tight Stop Loss below the support zone and absolutely don’t “all-in” based on emotional FOMO.
What do you think about $RARE ’s rally? Is this a real breakout—or just a sophisticated “bull trap” set by the whales? Leave your thoughts in the comments!
#RARE #BinanceSquare
The crypto market is never short of surprise “turnarounds,” and attention is currently focused on $RARE . If you’re sitting on the sidelines waiting or you might have “hit the top,” take a moment to break down the key numbers below!
On-chain data and technical signals from $RARE are emitting extremely hot signals that traders who “surf the waves” can’t ignore:
• Liquidity explosion: Trading volume has surged by an astonishing +4893%. Money is pouring into $RARE like a raging flood!
• Derivatives stream swirling: Open Interest (OI) in the past 1 hour jumped sharply by 58.16%, nearing the 3 million USD mark. Someone big is definitely setting up behind the scenes.
• Momentum & Trend: RSI-14 is hovering in the overbought zone (70.1), paired with bullish MACD and bullish trends on both the M15 and H1 timeframes. The buyers are fully controlling the short-term game.
• Mixed trading sentiment: Although the global Long/Short ratio leans toward Long (62.9%), the Taker Buy/Sell ratio is at 0.945 (selling pressure is slightly stronger at certain times). This suggests liquidity “shake-outs” (sweeping stops) could happen at any moment.
• Key price zones to watch: Strong support sits at magnh 0.01309, with the nearest resistance at 0.01828. If resistance breaks, $RARE has plenty of room ahead to soar alongside big names like $PHA and $ARK , who are leading the wave.
Surfing during an overbought RSI phase is like swinging a blade on the edge of a sword. High profits always come with extremely high risk. Always set a tight Stop Loss below the support zone and absolutely don’t “all-in” based on emotional FOMO.
What do you think about $RARE ’s rally? Is this a real breakout—or just a sophisticated “bull trap” set by the whales? Leave your thoughts in the comments!
#RARE #BinanceSquare
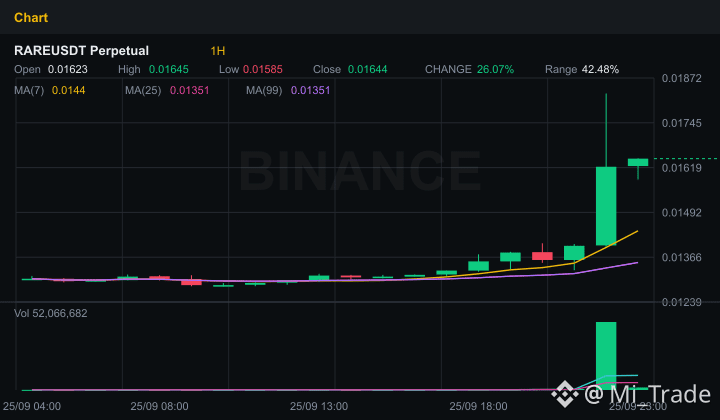
30
·
--
🔥 RED ALERT OR GOLDEN OPPORTUNITY? UNLOCK THE HOT SIGNAL—$KMNO RIGHT NOW! 🚀
The crypto market is always harsh, and anyone holding $KMNO is definitely unable to sit still while watching the current technical indicators. Is this the strong breakout that’s next—or a perfect liquidity trap set by the sharks? Let’s break it down right now!
Technical analysis and on-chain data don’t lie:
• Main trend: The bulls are in absolute control on both the M15 and H1 timeframes. MACD momentum supports the uptrend, opening the expectation of conquering fresh new highs.
• RSI(14) is at 77.1—an extremely sensitive overbought zone. This is when the bulls show signs of losing steam, profit-taking pressure is close at hand, and the risk of a liquidity sweep that flushes out margin is very high.
• Trading volume is down 26.2%, combined with Open Interest slightly decreasing by 2.45%, suggests new capital is slowing down; caution dominates as price approaches the resistance zone.
• Market sentiment: The overall Long/Short ratio is 1.53 (60.6% Long orders), meaning the crowd is extremely optimistic. However, top traders are split on the front lines (50.4% Long vs 49.6% Short), indicating intense indecision in this price area.
• “Life-or-death” price levels: Strong support is at 0.03689, and the major resistance that needs to be broken is 0.044.
A practical trading strategy for everyone on Binance Square:
Absolutely do not FOMO chase the top when RSI is already too high and volume is declining. Be patient and wait for a retest of the support zone, or wait for a clean breakout above resistance 0.044 with a surge in liquidity—then enter the trade. Always set a tight stop-loss to protect your capital during this final push phase.
What do you think about $KMNO right now? Will the bulls break the high, or are the sharks about to unload and trigger a deeper crash? Leave your comments below!
#KMNO #BinanceSquare
🔥 RED ALERT OR GOLDEN OPPORTUNITY? UNLOCK THE HOT SIGNAL—$KMNO RIGHT NOW! 🚀
The crypto market is always harsh, and anyone holding $KMNO is definitely unable to sit still while watching the current technical indicators. Is this the strong breakout that’s next—or a perfect liquidity trap set by the sharks? Let’s break it down right now!
Technical analysis and on-chain data don’t lie:
• Main trend: The bulls are in absolute control on both the M15 and H1 timeframes. MACD momentum supports the uptrend, opening the expectation of conquering fresh new highs.
• RSI(14) is at 77.1—an extremely sensitive overbought zone. This is when the bulls show signs of losing steam, profit-taking pressure is close at hand, and the risk of a liquidity sweep that flushes out margin is very high.
• Trading volume is down 26.2%, combined with Open Interest slightly decreasing by 2.45%, suggests new capital is slowing down; caution dominates as price approaches the resistance zone.
• Market sentiment: The overall Long/Short ratio is 1.53 (60.6% Long orders), meaning the crowd is extremely optimistic. However, top traders are split on the front lines (50.4% Long vs 49.6% Short), indicating intense indecision in this price area.
• “Life-or-death” price levels: Strong support is at 0.03689, and the major resistance that needs to be broken is 0.044.
A practical trading strategy for everyone on Binance Square:
Absolutely do not FOMO chase the top when RSI is already too high and volume is declining. Be patient and wait for a retest of the support zone, or wait for a clean breakout above resistance 0.044 with a surge in liquidity—then enter the trade. Always set a tight stop-loss to protect your capital during this final push phase.
What do you think about $KMNO right now? Will the bulls break the high, or are the sharks about to unload and trigger a deeper crash? Leave your comments below!
#KMNO #BinanceSquare
The crypto market is always harsh, and anyone holding $KMNO is definitely unable to sit still while watching the current technical indicators. Is this the strong breakout that’s next—or a perfect liquidity trap set by the sharks? Let’s break it down right now!
Technical analysis and on-chain data don’t lie:
• Main trend: The bulls are in absolute control on both the M15 and H1 timeframes. MACD momentum supports the uptrend, opening the expectation of conquering fresh new highs.
• RSI(14) is at 77.1—an extremely sensitive overbought zone. This is when the bulls show signs of losing steam, profit-taking pressure is close at hand, and the risk of a liquidity sweep that flushes out margin is very high.
• Trading volume is down 26.2%, combined with Open Interest slightly decreasing by 2.45%, suggests new capital is slowing down; caution dominates as price approaches the resistance zone.
• Market sentiment: The overall Long/Short ratio is 1.53 (60.6% Long orders), meaning the crowd is extremely optimistic. However, top traders are split on the front lines (50.4% Long vs 49.6% Short), indicating intense indecision in this price area.
• “Life-or-death” price levels: Strong support is at 0.03689, and the major resistance that needs to be broken is 0.044.
A practical trading strategy for everyone on Binance Square:
Absolutely do not FOMO chase the top when RSI is already too high and volume is declining. Be patient and wait for a retest of the support zone, or wait for a clean breakout above resistance 0.044 with a surge in liquidity—then enter the trade. Always set a tight stop-loss to protect your capital during this final push phase.
What do you think about $KMNO right now? Will the bulls break the high, or are the sharks about to unload and trigger a deeper crash? Leave your comments below!
#KMNO #BinanceSquare
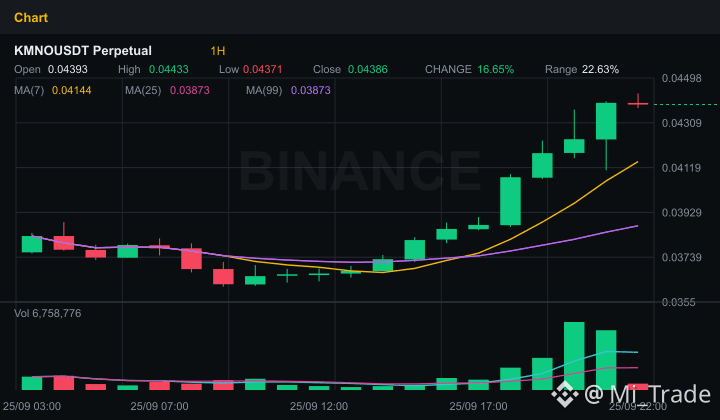
40
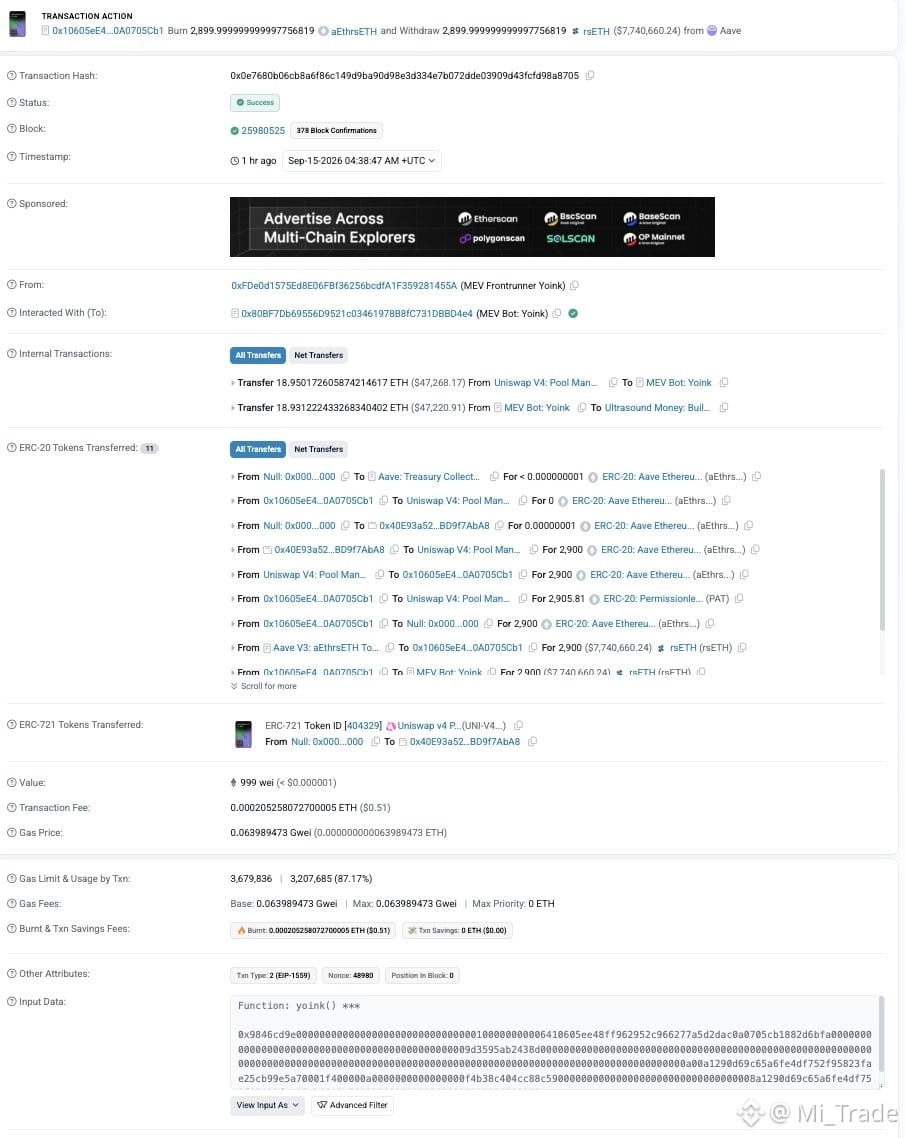
·
--
🔥 A GREAT OPPORTUNITY OR A PRICE-RISE TRAP WITH $AERO ? WHAT MOVE FOR BROTHERS?
The crypto market is always harsh, and anyone holding $AERO is definitely restless seeing the unpredictable swings of the current chart. Will the buyers keep their ground, or will a flip from a whale be waiting right around the corner?
Let’s quickly break down the technical picture of $AERO to find the most accurate battle coordinates!
📊 TECHNICAL SIGNALS & CURRENT FLOW
• Trend: Both the M15 and H1 timeframes are in strong green “bullish” alignment. The bulls are holding the line, building momentum to push the price toward key resistance zones.
• Momentum: RSI is at 62.4 — a neutral-to-upward level, suggesting buying pressure is still present but not yet in an overbought state. MACD continues to show strong bullish signals.
• Liquidity & Volume: Trading volume has dipped slightly (-31.1%), which is a signal worth noting, as it suggests caution from the larger capital flow. If there isn’t enough support, unexpected volatility can easily occur.
• Open Interest & Positioning: Open Interest has inched up +0.27% (to over 31.8 million USD), indicating that new money is still cautiously being injected into the market. The global Long/Short ratio is 1.54 (60.7% Long), showing the crowd is clearly leaning toward the upside. However, the Taker Buy/Sell Ratio is 0.68 — a contradictory point, as sellers are more active in short-term market orders.
• Price Map: The solid support zone sits at 0.7052, while the nearest resistance wall is at about 0.7927.
💡 TRADING STRATEGY
Given the current situation, this is not the time for reckless FOMO chasing the top. Most likely, price will test the support zone again before deciding whether to break through resistance.
- Risk Management: Always place your Stop Loss just below the 0.7052 support zone to protect your account from sudden liquidity sweeps caused by whales. Don’t use excessively high leverage during a period when trading volume is contracting.
So where are you standing on the front line? Are you holding a Long position waiting to take profit at resistance, or waiting for a Short to scoop up the bears? Leave a comment below!
#AERO #BinanceSquare
🔥 A GREAT OPPORTUNITY OR A PRICE-RISE TRAP WITH $AERO ? WHAT MOVE FOR BROTHERS?
The crypto market is always harsh, and anyone holding $AERO is definitely restless seeing the unpredictable swings of the current chart. Will the buyers keep their ground, or will a flip from a whale be waiting right around the corner?
Let’s quickly break down the technical picture of $AERO to find the most accurate battle coordinates!
📊 TECHNICAL SIGNALS & CURRENT FLOW
• Trend: Both the M15 and H1 timeframes are in strong green “bullish” alignment. The bulls are holding the line, building momentum to push the price toward key resistance zones.
• Momentum: RSI is at 62.4 — a neutral-to-upward level, suggesting buying pressure is still present but not yet in an overbought state. MACD continues to show strong bullish signals.
• Liquidity & Volume: Trading volume has dipped slightly (-31.1%), which is a signal worth noting, as it suggests caution from the larger capital flow. If there isn’t enough support, unexpected volatility can easily occur.
• Open Interest & Positioning: Open Interest has inched up +0.27% (to over 31.8 million USD), indicating that new money is still cautiously being injected into the market. The global Long/Short ratio is 1.54 (60.7% Long), showing the crowd is clearly leaning toward the upside. However, the Taker Buy/Sell Ratio is 0.68 — a contradictory point, as sellers are more active in short-term market orders.
• Price Map: The solid support zone sits at 0.7052, while the nearest resistance wall is at about 0.7927.
💡 TRADING STRATEGY
Given the current situation, this is not the time for reckless FOMO chasing the top. Most likely, price will test the support zone again before deciding whether to break through resistance.
- Risk Management: Always place your Stop Loss just below the 0.7052 support zone to protect your account from sudden liquidity sweeps caused by whales. Don’t use excessively high leverage during a period when trading volume is contracting.
So where are you standing on the front line? Are you holding a Long position waiting to take profit at resistance, or waiting for a Short to scoop up the bears? Leave a comment below!
#AERO #BinanceSquare
The crypto market is always harsh, and anyone holding $AERO is definitely restless seeing the unpredictable swings of the current chart. Will the buyers keep their ground, or will a flip from a whale be waiting right around the corner?
Let’s quickly break down the technical picture of $AERO to find the most accurate battle coordinates!
📊 TECHNICAL SIGNALS & CURRENT FLOW
• Trend: Both the M15 and H1 timeframes are in strong green “bullish” alignment. The bulls are holding the line, building momentum to push the price toward key resistance zones.
• Momentum: RSI is at 62.4 — a neutral-to-upward level, suggesting buying pressure is still present but not yet in an overbought state. MACD continues to show strong bullish signals.
• Liquidity & Volume: Trading volume has dipped slightly (-31.1%), which is a signal worth noting, as it suggests caution from the larger capital flow. If there isn’t enough support, unexpected volatility can easily occur.
• Open Interest & Positioning: Open Interest has inched up +0.27% (to over 31.8 million USD), indicating that new money is still cautiously being injected into the market. The global Long/Short ratio is 1.54 (60.7% Long), showing the crowd is clearly leaning toward the upside. However, the Taker Buy/Sell Ratio is 0.68 — a contradictory point, as sellers are more active in short-term market orders.
• Price Map: The solid support zone sits at 0.7052, while the nearest resistance wall is at about 0.7927.
💡 TRADING STRATEGY
Given the current situation, this is not the time for reckless FOMO chasing the top. Most likely, price will test the support zone again before deciding whether to break through resistance.
- Risk Management: Always place your Stop Loss just below the 0.7052 support zone to protect your account from sudden liquidity sweeps caused by whales. Don’t use excessively high leverage during a period when trading volume is contracting.
So where are you standing on the front line? Are you holding a Long position waiting to take profit at resistance, or waiting for a Short to scoop up the bears? Leave a comment below!
#AERO #BinanceSquare
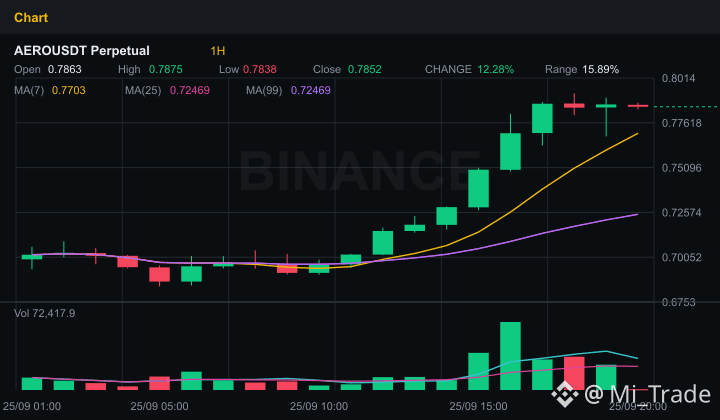
4
Log in to explore more content
Join global crypto users on Binance Square
⚡️ Get latest and useful information about crypto.
💬 Trusted by the world’s largest crypto exchange.
👍 Discover real insights from verified creators.
Email / Phone number
Trending Topics
CircleMints500MUSDCOnSolana
3,181 views
227 Discussing
💰 MASSIVE: Circle Mints $500M $USDC on Solana!
Circle just minted 500 Million $USDC on Solana in 2 transactions ($250M + $250M) on Sept 25, in just 5.5 hours! 🚀
Solana now holds $7.48B+ $USDC dominance - over 50% of its $14.7B stablecoin supply.
Why Solana?
⚡️ Speed: 65k TPS
💸 Low Fees: $0.00025
🔥 DeFi Hub: Jupiter, Raydium pumping
This is one of the largest single-day mints & signals HUGE institutional demand for Solana ecosystem.
Bullish for $SOL? 👇
#Circle #USDC #Solana #Stablecoin #DeFi#circlemints500musdconsolana
True News
·8 Likes
·2.9k views
PolymarketBankFailureBetsDrawFDICConcern
15,125 views
477 Discussing
BlackRockBuildsTokenizedPortfoliosForOndo
11,696 views
328 Discussing