
桀-1688
3.8k Posts

桀-1688
 Square Verified
Report
Block User
盯盘不追高,数据说人话。关注我,用数据拆行情,用白话讲市场。
High-Frequency Trader
9.1 Years
106 Following
11.3K+ Followers
2.4K+ Liked
Posts
·
--
There’s a lot of intraday buzz—only something that can hold onto the volume is worth taking another look.
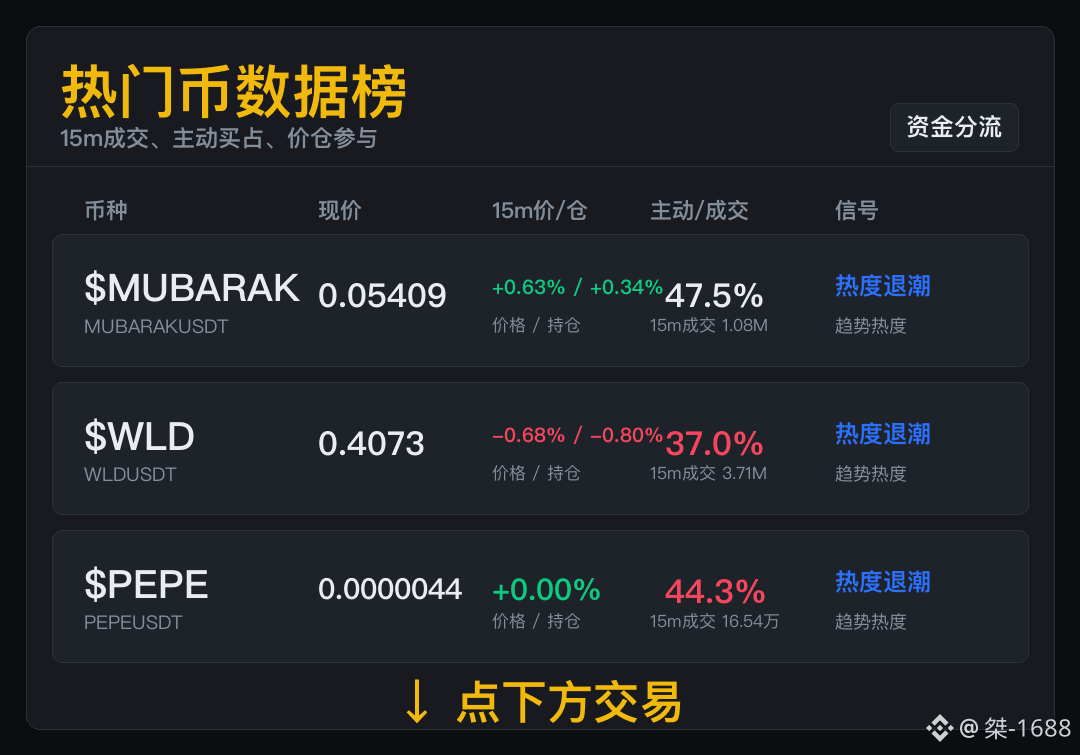
For $MUBARAK , look at the short-term trade first:成交 1.08M, with buy-side orders accounting for 47.5%. Then check the price/position: 价仓 +0.63% / +0.34%. If you want to bottom-fish, go slower—when the buzz starts to fade, it most likes to trick the first batch of bottom-fishers. When the buzz fades, it most easily tricks people who just want to get a bargain.
For $WLD 15m, the成交 is 3.71M, with buy-side orders at 37.0%. Then check 价仓: -0.68% / -0.80%. If you’re planning to take the shares, don’t grab the first move—once turnover/rotation comes out, the positioning will be easier to judge. Don’t rush to scoop; first see whether the rebound has real volume.
For $PEPE , look at the short-term trade first:成交 16.54万, with buy-side orders at 44.3%. Then check the 15m price: +0.00%. After the buzz fades, patience is more valuable than speed. The excitement hasn’t completely dispersed, but the urge to chase is already weakening.
There’s a lot of intraday buzz—only something that can hold onto the volume is worth taking another look.
For $MUBARAK , look at the short-term trade first:成交 1.08M, with buy-side orders accounting for 47.5%. Then check the price/position: 价仓 +0.63% / +0.34%. If you want to bottom-fish, go slower—when the buzz starts to fade, it most likes to trick the first batch of bottom-fishers. When the buzz fades, it most easily tricks people who just want to get a bargain.
For $WLD 15m, the成交 is 3.71M, with buy-side orders at 37.0%. Then check 价仓: -0.68% / -0.80%. If you’re planning to take the shares, don’t grab the first move—once turnover/rotation comes out, the positioning will be easier to judge. Don’t rush to scoop; first see whether the rebound has real volume.
For $PEPE , look at the short-term trade first:成交 16.54万, with buy-side orders at 44.3%. Then check the 15m price: +0.00%. After the buzz fades, patience is more valuable than speed. The excitement hasn’t completely dispersed, but the urge to chase is already weakening.
For $MUBARAK , look at the short-term trade first:成交 1.08M, with buy-side orders accounting for 47.5%. Then check the price/position: 价仓 +0.63% / +0.34%. If you want to bottom-fish, go slower—when the buzz starts to fade, it most likes to trick the first batch of bottom-fishers. When the buzz fades, it most easily tricks people who just want to get a bargain.
For $WLD 15m, the成交 is 3.71M, with buy-side orders at 37.0%. Then check 价仓: -0.68% / -0.80%. If you’re planning to take the shares, don’t grab the first move—once turnover/rotation comes out, the positioning will be easier to judge. Don’t rush to scoop; first see whether the rebound has real volume.
For $PEPE , look at the short-term trade first:成交 16.54万, with buy-side orders at 44.3%. Then check the 15m price: +0.00%. After the buzz fades, patience is more valuable than speed. The excitement hasn’t completely dispersed, but the urge to chase is already weakening.
4
·
--
Before entering, first look for an exit route.
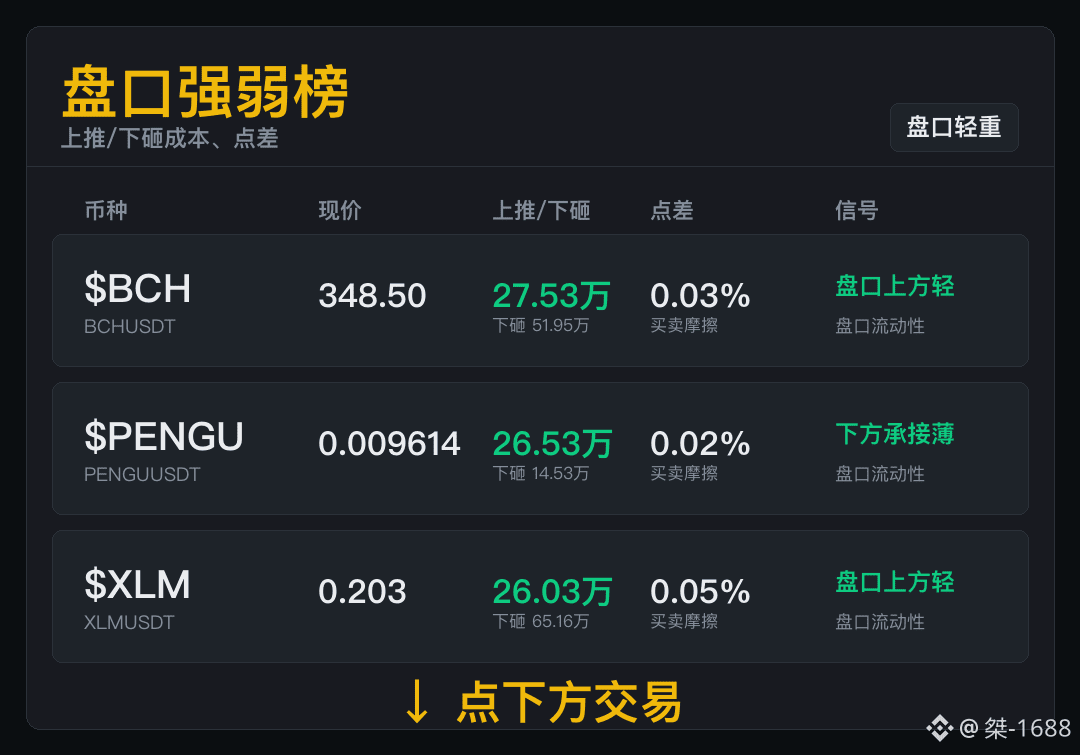
$BCH spot trades成交 124.46M. The push up / smash down costs are 275,300 / 519,500. With this kind of structure, once the trade connects and you can link up, things will move quickly; if it doesn’t connect, then just watch for short-term, range-bound fluctuations. Being able to push is only enough for the opening—what matters is whether there’s still volume after it pauses.
$PENGU push up 265,300, and smash down 145,300; spread is 0.02%. People who chase after a rise should think through their exit first—don’t wait until one smash happens and then realize there’s no one there to take you. It looks hot, but after one smash, you might find no one is waiting for you.
$XLM push up 260,300, and smash down 651,600; spread is 0.05%. Don’t rush to chase. Wait for the next segment where active sweeping orders come through. The level above isn’t that blocked, but you still need to see whether the active buy orders are willing to keep pushing.
Before entering, first look for an exit route.
$BCH spot trades成交 124.46M. The push up / smash down costs are 275,300 / 519,500. With this kind of structure, once the trade connects and you can link up, things will move quickly; if it doesn’t connect, then just watch for short-term, range-bound fluctuations. Being able to push is only enough for the opening—what matters is whether there’s still volume after it pauses.
$PENGU push up 265,300, and smash down 145,300; spread is 0.02%. People who chase after a rise should think through their exit first—don’t wait until one smash happens and then realize there’s no one there to take you. It looks hot, but after one smash, you might find no one is waiting for you.
$XLM push up 260,300, and smash down 651,600; spread is 0.05%. Don’t rush to chase. Wait for the next segment where active sweeping orders come through. The level above isn’t that blocked, but you still need to see whether the active buy orders are willing to keep pushing.
$BCH spot trades成交 124.46M. The push up / smash down costs are 275,300 / 519,500. With this kind of structure, once the trade connects and you can link up, things will move quickly; if it doesn’t connect, then just watch for short-term, range-bound fluctuations. Being able to push is only enough for the opening—what matters is whether there’s still volume after it pauses.
$PENGU push up 265,300, and smash down 145,300; spread is 0.02%. People who chase after a rise should think through their exit first—don’t wait until one smash happens and then realize there’s no one there to take you. It looks hot, but after one smash, you might find no one is waiting for you.
$XLM push up 260,300, and smash down 651,600; spread is 0.05%. Don’t rush to chase. Wait for the next segment where active sweeping orders come through. The level above isn’t that blocked, but you still need to see whether the active buy orders are willing to keep pushing.
1
215
·
--
First look at the order book’s in-and-out costs—whether it can be pushed up and whether you can exit if you’re wrong are equally important.
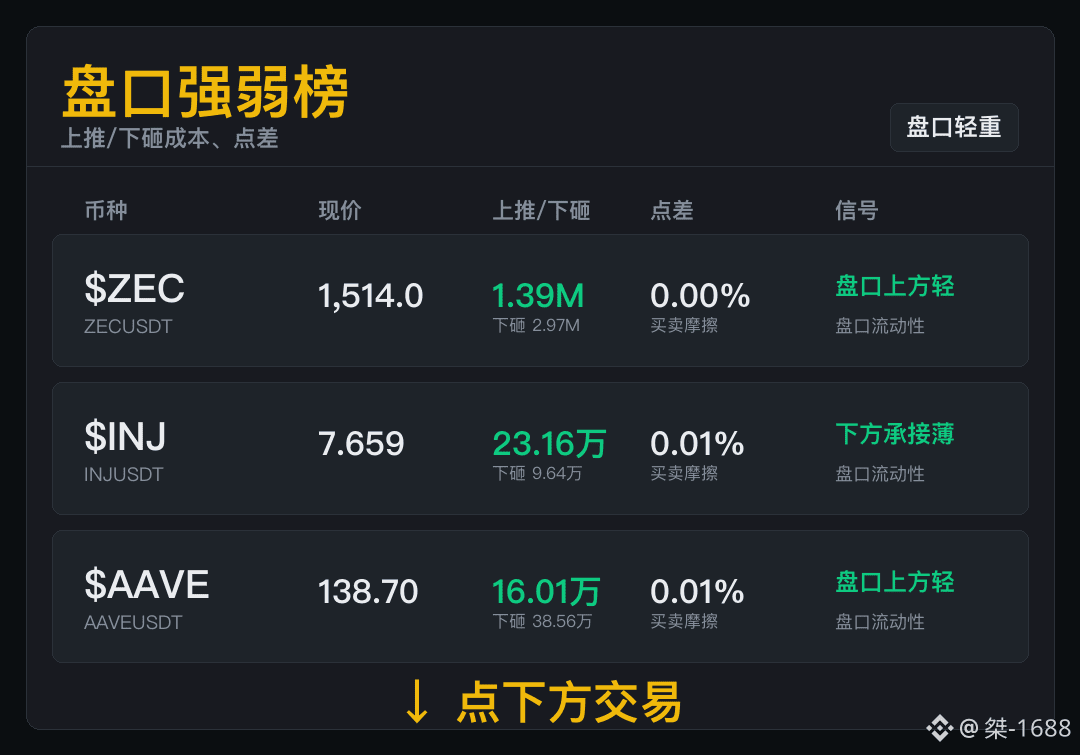
$ZEC : push up 1.39M, sell down 2.97M, spread 0.00%. The order book offers opportunities; the trades provide the answer. Resistance above may seem light—that’s only the route. It’s the execution and follow-through that determines how far it can go.
$INJ : for execution, first assess the upper and lower costs—push up 231,600, sell down 96,400, spread 0.01%. This kind of order book isn’t meant to scare you; it’s a reminder not to treat exit costs as trivial. If the downside pickup isn’t thick, people who chase price higher should think about an exit path first.
$AAVE : spot trades 37.14M; push-up/down-sell costs are 160,100 / 385,600. If you want to go long, watch the active buy orders—don’t just stare at the orders resting above. Light overhead path is only a prerequisite; if the execution breaks, it won’t go far.
First look at the order book’s in-and-out costs—whether it can be pushed up and whether you can exit if you’re wrong are equally important.
$ZEC : push up 1.39M, sell down 2.97M, spread 0.00%. The order book offers opportunities; the trades provide the answer. Resistance above may seem light—that’s only the route. It’s the execution and follow-through that determines how far it can go.
$INJ : for execution, first assess the upper and lower costs—push up 231,600, sell down 96,400, spread 0.01%. This kind of order book isn’t meant to scare you; it’s a reminder not to treat exit costs as trivial. If the downside pickup isn’t thick, people who chase price higher should think about an exit path first.
$AAVE : spot trades 37.14M; push-up/down-sell costs are 160,100 / 385,600. If you want to go long, watch the active buy orders—don’t just stare at the orders resting above. Light overhead path is only a prerequisite; if the execution breaks, it won’t go far.
$ZEC : push up 1.39M, sell down 2.97M, spread 0.00%. The order book offers opportunities; the trades provide the answer. Resistance above may seem light—that’s only the route. It’s the execution and follow-through that determines how far it can go.
$INJ : for execution, first assess the upper and lower costs—push up 231,600, sell down 96,400, spread 0.01%. This kind of order book isn’t meant to scare you; it’s a reminder not to treat exit costs as trivial. If the downside pickup isn’t thick, people who chase price higher should think about an exit path first.
$AAVE : spot trades 37.14M; push-up/down-sell costs are 160,100 / 385,600. If you want to go long, watch the active buy orders—don’t just stare at the orders resting above. Light overhead path is only a prerequisite; if the execution breaks, it won’t go far.
315
·
--
Hot coins are updated every day—only the ones that can move volume are worth a second glance.
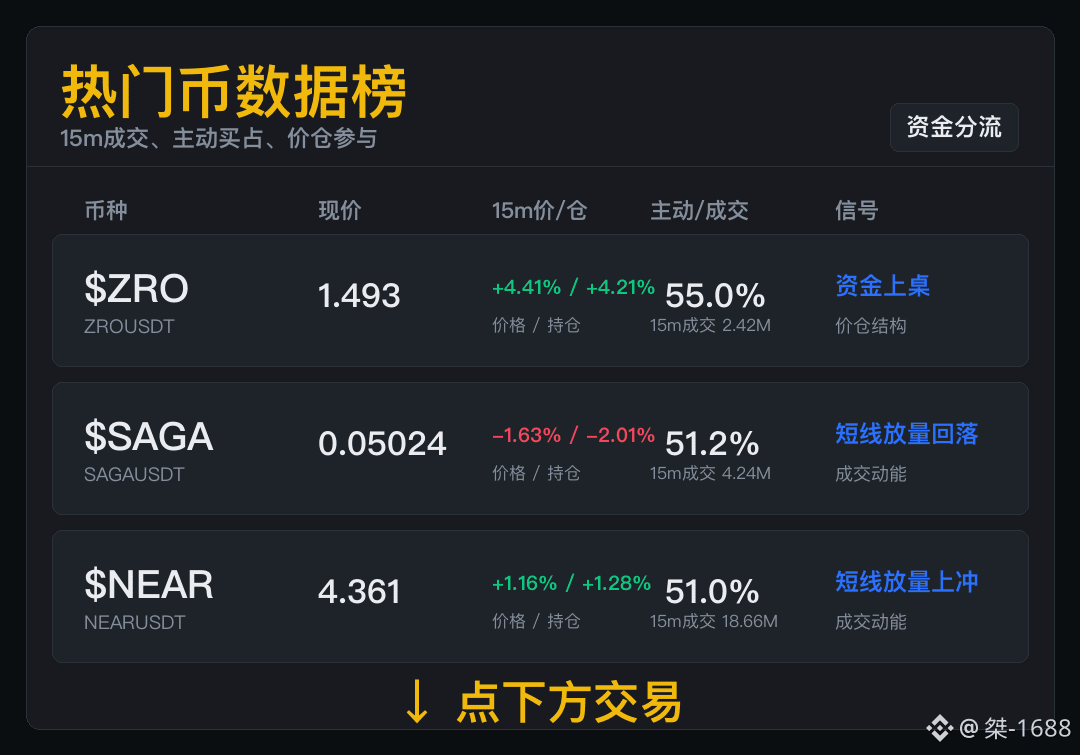
In this round, $ZRO focuses on 15m participation: volume 2.42M, active buy ratio 55.0%, price-to-carry +4.41% / +4.21%. If you already have a position, don’t rush to add—pullbacks that get absorbed matter more than continuing to rush forward. Someone has taken a seat at the table; now we’ll see whether volume can hold up and absorb after that.
For $SAGA , first look at short-term volume: 4.24M, active buy ratio 51.2%, then the price-to-carry -1.63% / -2.01%. If you want to find an opportunity, you can watch—but don’t treat the words “hot” or “popular” as a direction. This setup is meant to be watched; it’s not meant to jump in just because it feels hot.
$NEAR 15m has volume of 18.66M, price-to-carry +1.16% / +1.28%. For the short term, participation matters more than just whether it’s up or down. Having momentum inside the venue is an advantage—what really matters is who can take the next move. The hotter the plaza is, the more you need to check whether the volume is still in the front ranks.
Hot coins are updated every day—only the ones that can move volume are worth a second glance.
In this round, $ZRO focuses on 15m participation: volume 2.42M, active buy ratio 55.0%, price-to-carry +4.41% / +4.21%. If you already have a position, don’t rush to add—pullbacks that get absorbed matter more than continuing to rush forward. Someone has taken a seat at the table; now we’ll see whether volume can hold up and absorb after that.
For $SAGA , first look at short-term volume: 4.24M, active buy ratio 51.2%, then the price-to-carry -1.63% / -2.01%. If you want to find an opportunity, you can watch—but don’t treat the words “hot” or “popular” as a direction. This setup is meant to be watched; it’s not meant to jump in just because it feels hot.
$NEAR 15m has volume of 18.66M, price-to-carry +1.16% / +1.28%. For the short term, participation matters more than just whether it’s up or down. Having momentum inside the venue is an advantage—what really matters is who can take the next move. The hotter the plaza is, the more you need to check whether the volume is still in the front ranks.
In this round, $ZRO focuses on 15m participation: volume 2.42M, active buy ratio 55.0%, price-to-carry +4.41% / +4.21%. If you already have a position, don’t rush to add—pullbacks that get absorbed matter more than continuing to rush forward. Someone has taken a seat at the table; now we’ll see whether volume can hold up and absorb after that.
For $SAGA , first look at short-term volume: 4.24M, active buy ratio 51.2%, then the price-to-carry -1.63% / -2.01%. If you want to find an opportunity, you can watch—but don’t treat the words “hot” or “popular” as a direction. This setup is meant to be watched; it’s not meant to jump in just because it feels hot.
$NEAR 15m has volume of 18.66M, price-to-carry +1.16% / +1.28%. For the short term, participation matters more than just whether it’s up or down. Having momentum inside the venue is an advantage—what really matters is who can take the next move. The hotter the plaza is, the more you need to check whether the volume is still in the front ranks.
471
·
--
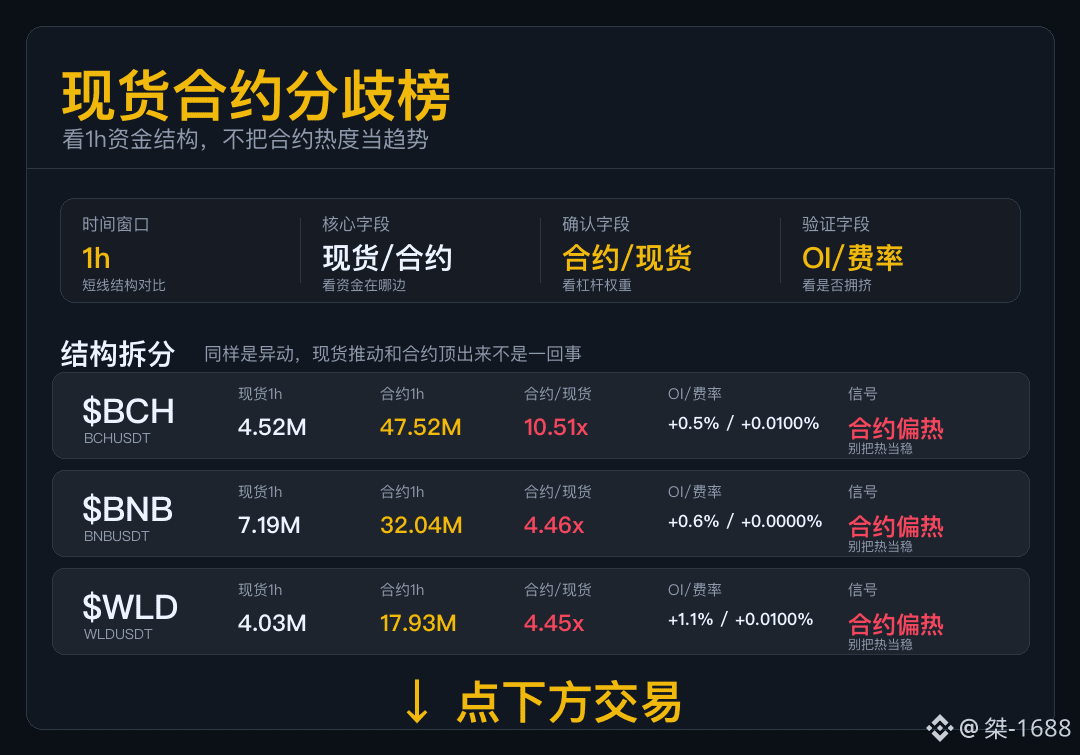
Spot Contract Discord Rankings
In the last 1 hour, first to identify where the funds are coming from: is the spot market following, or are futures contracts racing to seize the momentum?
$BCH The spot hasn’t synchronously increased in size; the current changes look more like the contract market first carving out room.
$BNB The leverage side has pushed sentiment up, but spot hasn’t yet provided enough confidence—don’t confuse “fast” with “stable.”
$WLD Leveraged trades have taken the lead. If open positions continue to expand, the pressure to deleverage when the market moves the other way will also increase.
If contracts heat up first, the market may move faster, but without spot participation, the speed is likely to turn into back-and-forth whipping.
Spot Contract Discord Rankings
In the last 1 hour, first to identify where the funds are coming from: is the spot market following, or are futures contracts racing to seize the momentum?
$BCH The spot hasn’t synchronously increased in size; the current changes look more like the contract market first carving out room.
$BNB The leverage side has pushed sentiment up, but spot hasn’t yet provided enough confidence—don’t confuse “fast” with “stable.”
$WLD Leveraged trades have taken the lead. If open positions continue to expand, the pressure to deleverage when the market moves the other way will also increase.
If contracts heat up first, the market may move faster, but without spot participation, the speed is likely to turn into back-and-forth whipping.
In the last 1 hour, first to identify where the funds are coming from: is the spot market following, or are futures contracts racing to seize the momentum?
$BCH The spot hasn’t synchronously increased in size; the current changes look more like the contract market first carving out room.
$BNB The leverage side has pushed sentiment up, but spot hasn’t yet provided enough confidence—don’t confuse “fast” with “stable.”
$WLD Leveraged trades have taken the lead. If open positions continue to expand, the pressure to deleverage when the market moves the other way will also increase.
If contracts heat up first, the market may move faster, but without spot participation, the speed is likely to turn into back-and-forth whipping.
3
1.3k
·
--
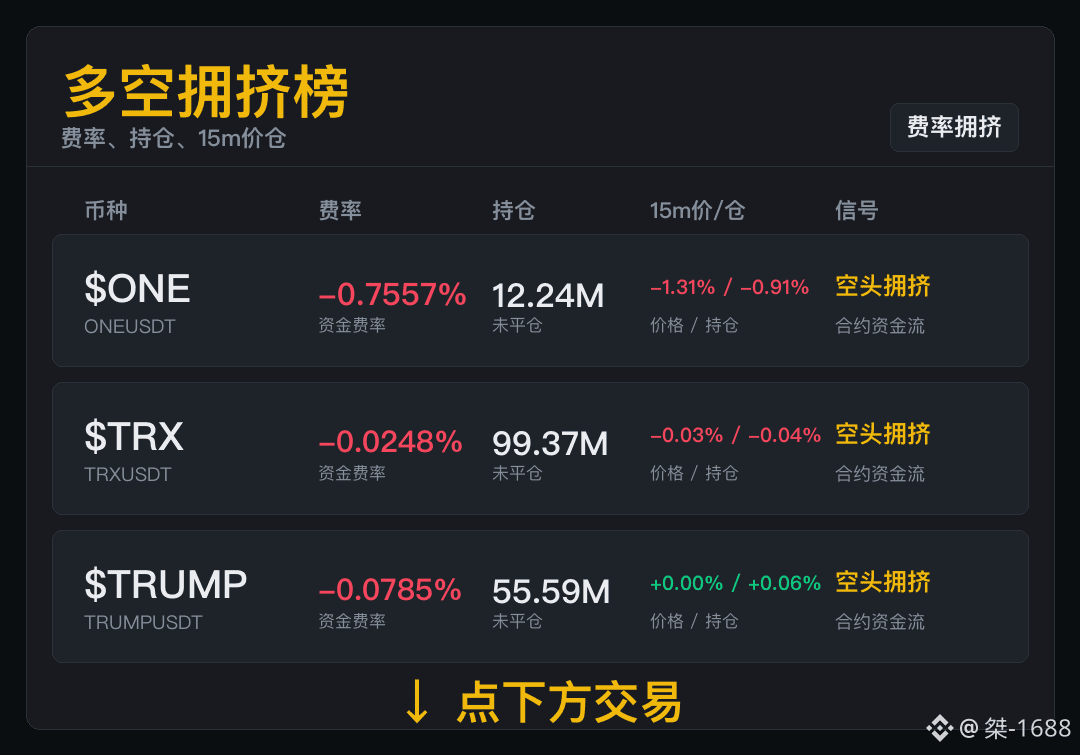
When positions are squeezed tightly, volatility gets easily “dirty.”
[$ONE ] fee rate -0.7557%, 15m contract volume 1.80M—first see whether the crowding will continue to expand. If you’re trying to catch a rebound, check the trading volume first; don’t use a negative fee rate as the only reason. The more crowded the shorts are, the less you should look only at the surface-level upward move when it bounces back.
[$TRX ] fee rate -0.0248%, with open interest 99.37M. For this kind, focus on whether the position is still being piled up. If you’re chasing shorts, first calculate your cost—once crowding builds up, tolerance gets smaller. There are plenty of shorts, but if they can’t push it down, things will start to feel awkward.
[$TRUMP ] fee rate -0.0785%, with open interest 55.59M. 15m price-position +0.00% / +0.06%. This kind of market is most likely to let shorts make small profits but lose big in terms of emotions. A negative fee rate is a reminder that shorts are crowded—not a direct “bottom-picking” answer for you.
When positions are squeezed tightly, volatility gets easily “dirty.”
[$ONE ] fee rate -0.7557%, 15m contract volume 1.80M—first see whether the crowding will continue to expand. If you’re trying to catch a rebound, check the trading volume first; don’t use a negative fee rate as the only reason. The more crowded the shorts are, the less you should look only at the surface-level upward move when it bounces back.
[$TRX ] fee rate -0.0248%, with open interest 99.37M. For this kind, focus on whether the position is still being piled up. If you’re chasing shorts, first calculate your cost—once crowding builds up, tolerance gets smaller. There are plenty of shorts, but if they can’t push it down, things will start to feel awkward.
[$TRUMP ] fee rate -0.0785%, with open interest 55.59M. 15m price-position +0.00% / +0.06%. This kind of market is most likely to let shorts make small profits but lose big in terms of emotions. A negative fee rate is a reminder that shorts are crowded—not a direct “bottom-picking” answer for you.
[$ONE ] fee rate -0.7557%, 15m contract volume 1.80M—first see whether the crowding will continue to expand. If you’re trying to catch a rebound, check the trading volume first; don’t use a negative fee rate as the only reason. The more crowded the shorts are, the less you should look only at the surface-level upward move when it bounces back.
[$TRX ] fee rate -0.0248%, with open interest 99.37M. For this kind, focus on whether the position is still being piled up. If you’re chasing shorts, first calculate your cost—once crowding builds up, tolerance gets smaller. There are plenty of shorts, but if they can’t push it down, things will start to feel awkward.
[$TRUMP ] fee rate -0.0785%, with open interest 55.59M. 15m price-position +0.00% / +0.06%. This kind of market is most likely to let shorts make small profits but lose big in terms of emotions. A negative fee rate is a reminder that shorts are crowded—not a direct “bottom-picking” answer for you.
470
·
--
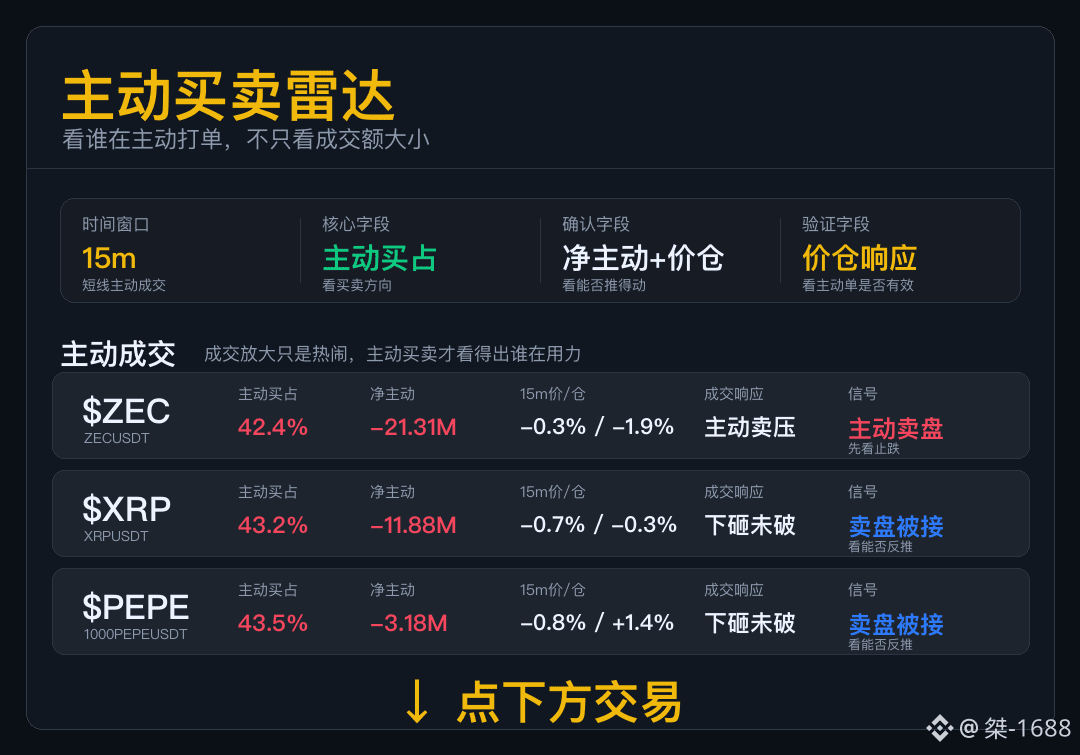
Active Buy/Sell Radar
Don’t just look at the traded amount; today’s focus is whether the active orders can push the order book.
$ZEC : The active sell orders are dominant, and the price is being pushed down as well. The market sell orders are effectively pressuring the price.
$XRP : The seller put in the effort, but didn’t break through the level. For the short term, first look for consolidation and absorption; don’t rush to treat a breakdown as confirmed.
$PEPE : The seller put in the effort but didn’t get the breakdown. The price action looks more like it’s absorbing the sell pressure.
This set shows relatively heavier sell pressure, but some orders are being taken while others are being pushed through. Going forward, watch them separately when assessing where the selling stops.
Active Buy/Sell Radar
Don’t just look at the traded amount; today’s focus is whether the active orders can push the order book.
$ZEC : The active sell orders are dominant, and the price is being pushed down as well. The market sell orders are effectively pressuring the price.
$XRP : The seller put in the effort, but didn’t break through the level. For the short term, first look for consolidation and absorption; don’t rush to treat a breakdown as confirmed.
$PEPE : The seller put in the effort but didn’t get the breakdown. The price action looks more like it’s absorbing the sell pressure.
This set shows relatively heavier sell pressure, but some orders are being taken while others are being pushed through. Going forward, watch them separately when assessing where the selling stops.
Don’t just look at the traded amount; today’s focus is whether the active orders can push the order book.
$ZEC : The active sell orders are dominant, and the price is being pushed down as well. The market sell orders are effectively pressuring the price.
$XRP : The seller put in the effort, but didn’t break through the level. For the short term, first look for consolidation and absorption; don’t rush to treat a breakdown as confirmed.
$PEPE : The seller put in the effort but didn’t get the breakdown. The price action looks more like it’s absorbing the sell pressure.
This set shows relatively heavier sell pressure, but some orders are being taken while others are being pushed through. Going forward, watch them separately when assessing where the selling stops.
733
·
--
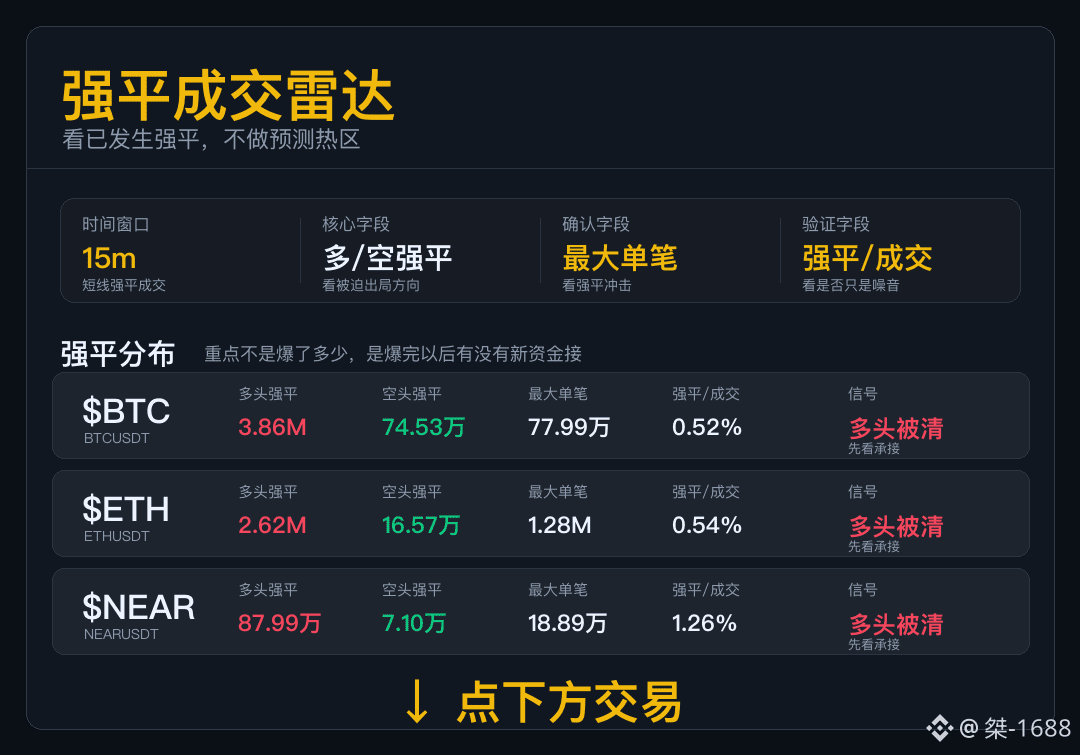
Strong Trend Moving Liquidation Radar
For data like this, first see who is being forced out.
In $BTC , the long side being cleared is even more obvious. A rebound isn’t impossible to look at, but you should first check whether, after the liquidation, there is any new buying order taking over.
In $ETH 15m, the long liquidation is clearly higher than the short side, and leveraged long positions are being forced to exit.
In $NEAR , this section mainly shows longs being passively forced out. After the drop, whether it can be repaired depends on whether there is follow-through and whether support comes in afterwards.
When liquidation accounts for a low share of trading volume, the event is more like a local cleanup, and the usual impact on price is limited.
Strong Trend Moving Liquidation Radar
For data like this, first see who is being forced out.
In $BTC , the long side being cleared is even more obvious. A rebound isn’t impossible to look at, but you should first check whether, after the liquidation, there is any new buying order taking over.
In $ETH 15m, the long liquidation is clearly higher than the short side, and leveraged long positions are being forced to exit.
In $NEAR , this section mainly shows longs being passively forced out. After the drop, whether it can be repaired depends on whether there is follow-through and whether support comes in afterwards.
When liquidation accounts for a low share of trading volume, the event is more like a local cleanup, and the usual impact on price is limited.
For data like this, first see who is being forced out.
In $BTC , the long side being cleared is even more obvious. A rebound isn’t impossible to look at, but you should first check whether, after the liquidation, there is any new buying order taking over.
In $ETH 15m, the long liquidation is clearly higher than the short side, and leveraged long positions are being forced to exit.
In $NEAR , this section mainly shows longs being passively forced out. After the drop, whether it can be repaired depends on whether there is follow-through and whether support comes in afterwards.
When liquidation accounts for a low share of trading volume, the event is more like a local cleanup, and the usual impact on price is limited.
487
·
--
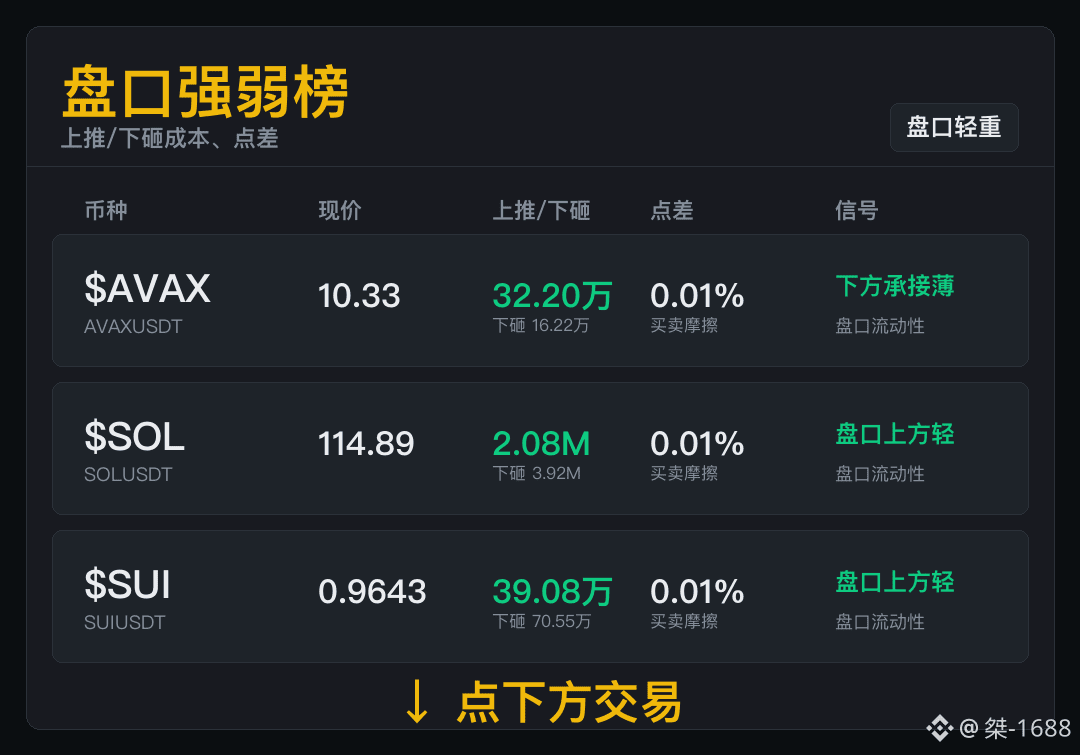
Light overhead doesn’t necessarily mean prices will rise, and thin depth below doesn’t necessarily mean they will fall—but both will change the difficulty of trading.
$AVAX spot trades: 67.75M. The cost of pushing up / smashing down is 320,200 / 162,200. Before chasing higher, think about an exit route first; otherwise, if it drops, it will be messy and ugly. For those going long, don’t stubbornly hold on—when the depth is thin below, don’t pretend you can’t see it.
$SOL from the order book, look at three factors: pushing up is 2.08M, smashing down is 3.92M, and the spread is 0.01%. If you’re already in, look for a retest and see if you can catch it—only then can the advantage from the order book actually land. Resistance being “light” just means the door is open; if nobody enters, you won’t get very far.
$SUI spread 0.01%, push-up cost 390,800. First, see whether the trades can get picked up. The order book gives you a window, not the answer. A light order book is easy to lure people into reacting quickly, but only continuous trading volume gives you a reason to keep watching.
Light overhead doesn’t necessarily mean prices will rise, and thin depth below doesn’t necessarily mean they will fall—but both will change the difficulty of trading.
$AVAX spot trades: 67.75M. The cost of pushing up / smashing down is 320,200 / 162,200. Before chasing higher, think about an exit route first; otherwise, if it drops, it will be messy and ugly. For those going long, don’t stubbornly hold on—when the depth is thin below, don’t pretend you can’t see it.
$SOL from the order book, look at three factors: pushing up is 2.08M, smashing down is 3.92M, and the spread is 0.01%. If you’re already in, look for a retest and see if you can catch it—only then can the advantage from the order book actually land. Resistance being “light” just means the door is open; if nobody enters, you won’t get very far.
$SUI spread 0.01%, push-up cost 390,800. First, see whether the trades can get picked up. The order book gives you a window, not the answer. A light order book is easy to lure people into reacting quickly, but only continuous trading volume gives you a reason to keep watching.
$AVAX spot trades: 67.75M. The cost of pushing up / smashing down is 320,200 / 162,200. Before chasing higher, think about an exit route first; otherwise, if it drops, it will be messy and ugly. For those going long, don’t stubbornly hold on—when the depth is thin below, don’t pretend you can’t see it.
$SOL from the order book, look at three factors: pushing up is 2.08M, smashing down is 3.92M, and the spread is 0.01%. If you’re already in, look for a retest and see if you can catch it—only then can the advantage from the order book actually land. Resistance being “light” just means the door is open; if nobody enters, you won’t get very far.
$SUI spread 0.01%, push-up cost 390,800. First, see whether the trades can get picked up. The order book gives you a window, not the answer. A light order book is easy to lure people into reacting quickly, but only continuous trading volume gives you a reason to keep watching.
650
·
--
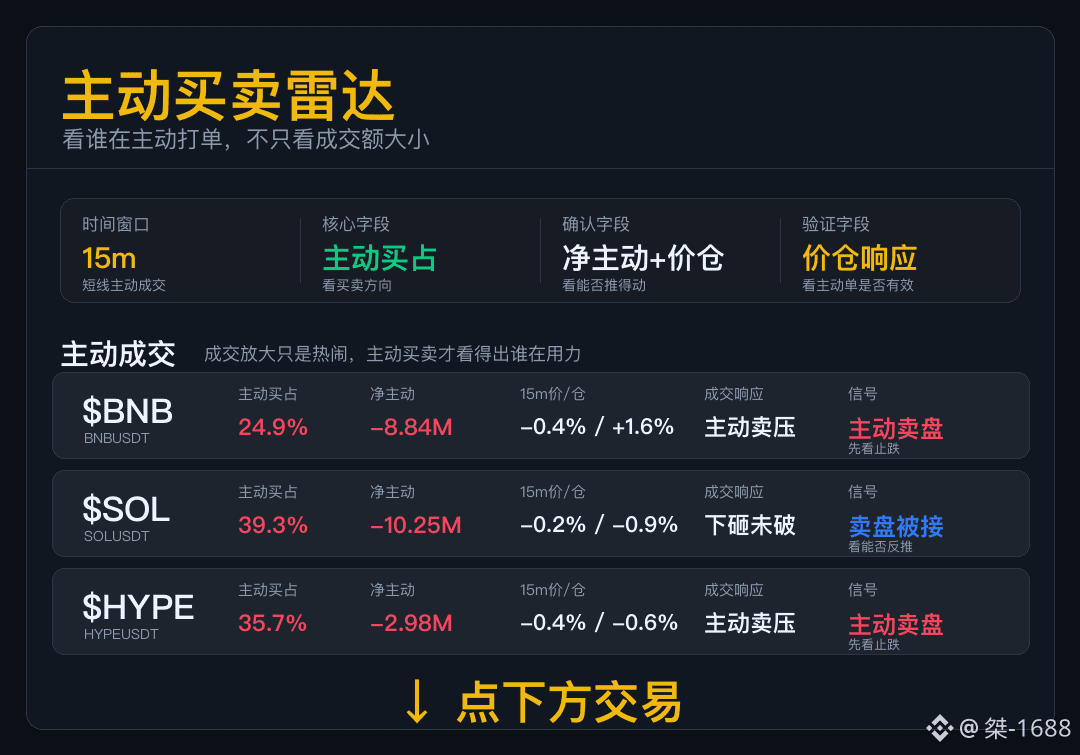
Active Buy/Sell Radar
Don’t just look at the trading volume. Today, this set mainly focuses on whether the aggressive orders can push the order book.
$BNB net aggressive selling. The price also wasn’t able to hold up against it. For this kind of market, before any rebound, first check whether the support/"sustaining" orders come back.
$SOL sell orders were posted and it still held. This indicates there’s support below. Don’t rush to short; wait for the next segment to confirm.
$HYPE aggressive sell orders are dominant, and the price is also being pushed down. Market sell-side liquidity is currently effectively hitting the bids.
The weakness is the sell pressure. The key question is: who is the first to stop it, and who is still getting continuously hammered.
Active Buy/Sell Radar
Don’t just look at the trading volume. Today, this set mainly focuses on whether the aggressive orders can push the order book.
$BNB net aggressive selling. The price also wasn’t able to hold up against it. For this kind of market, before any rebound, first check whether the support/"sustaining" orders come back.
$SOL sell orders were posted and it still held. This indicates there’s support below. Don’t rush to short; wait for the next segment to confirm.
$HYPE aggressive sell orders are dominant, and the price is also being pushed down. Market sell-side liquidity is currently effectively hitting the bids.
The weakness is the sell pressure. The key question is: who is the first to stop it, and who is still getting continuously hammered.
Don’t just look at the trading volume. Today, this set mainly focuses on whether the aggressive orders can push the order book.
$BNB net aggressive selling. The price also wasn’t able to hold up against it. For this kind of market, before any rebound, first check whether the support/"sustaining" orders come back.
$SOL sell orders were posted and it still held. This indicates there’s support below. Don’t rush to short; wait for the next segment to confirm.
$HYPE aggressive sell orders are dominant, and the price is also being pushed down. Market sell-side liquidity is currently effectively hitting the bids.
The weakness is the sell pressure. The key question is: who is the first to stop it, and who is still getting continuously hammered.
713
·
--
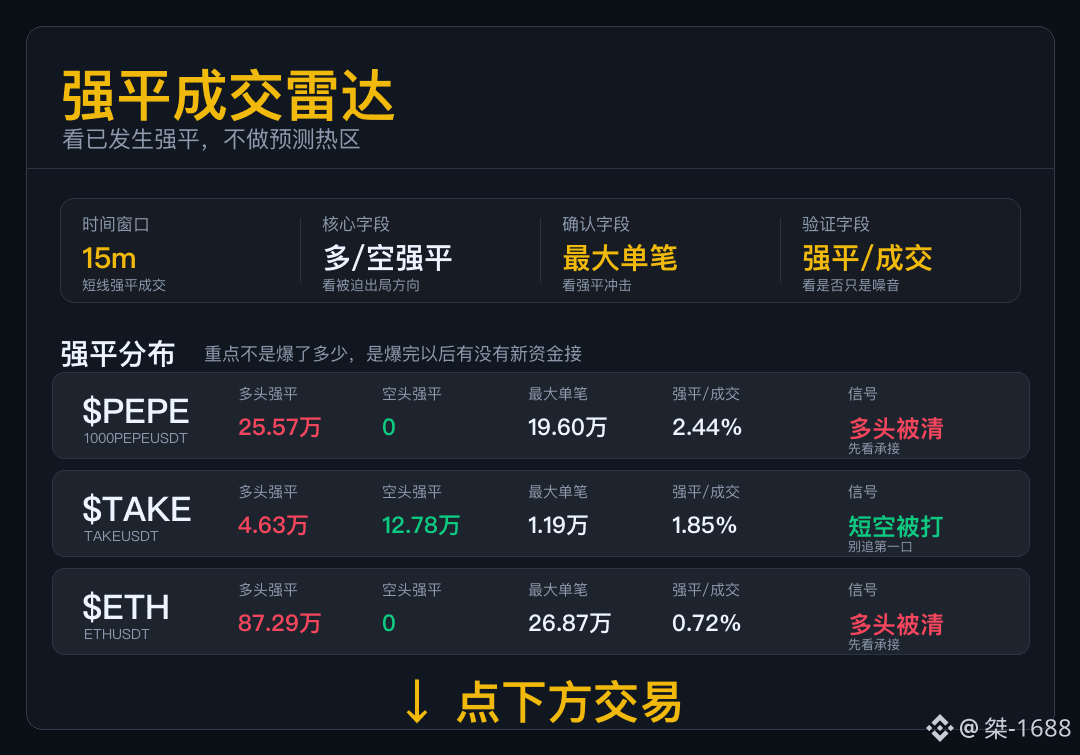
Strong liquidation intersecting radar
For data like this, first see who is being forced out.
$PEPE refers to longs being liquidated first; later, if incoming trades can’t connect smoothly, rebounds are likely to turn into a weak “repair.”
$TAKE shows shorts being liquidated in a concentrated way. What can be confirmed is that a squeeze is happening, but you can’t directly write it off as a trend-start.
$ETH 15m Long liquidation is clearly higher than short liquidation; leveraged long positions are being forced to exit.
When the liquidation structure splits, afterward you need to look at each side’s trade-based repair. It’s not suitable to summarize it in one sentence.
Strong liquidation intersecting radar
For data like this, first see who is being forced out.
$PEPE refers to longs being liquidated first; later, if incoming trades can’t connect smoothly, rebounds are likely to turn into a weak “repair.”
$TAKE shows shorts being liquidated in a concentrated way. What can be confirmed is that a squeeze is happening, but you can’t directly write it off as a trend-start.
$ETH 15m Long liquidation is clearly higher than short liquidation; leveraged long positions are being forced to exit.
When the liquidation structure splits, afterward you need to look at each side’s trade-based repair. It’s not suitable to summarize it in one sentence.
For data like this, first see who is being forced out.
$PEPE refers to longs being liquidated first; later, if incoming trades can’t connect smoothly, rebounds are likely to turn into a weak “repair.”
$TAKE shows shorts being liquidated in a concentrated way. What can be confirmed is that a squeeze is happening, but you can’t directly write it off as a trend-start.
$ETH 15m Long liquidation is clearly higher than short liquidation; leveraged long positions are being forced to exit.
When the liquidation structure splits, afterward you need to look at each side’s trade-based repair. It’s not suitable to summarize it in one sentence.
819
·
--
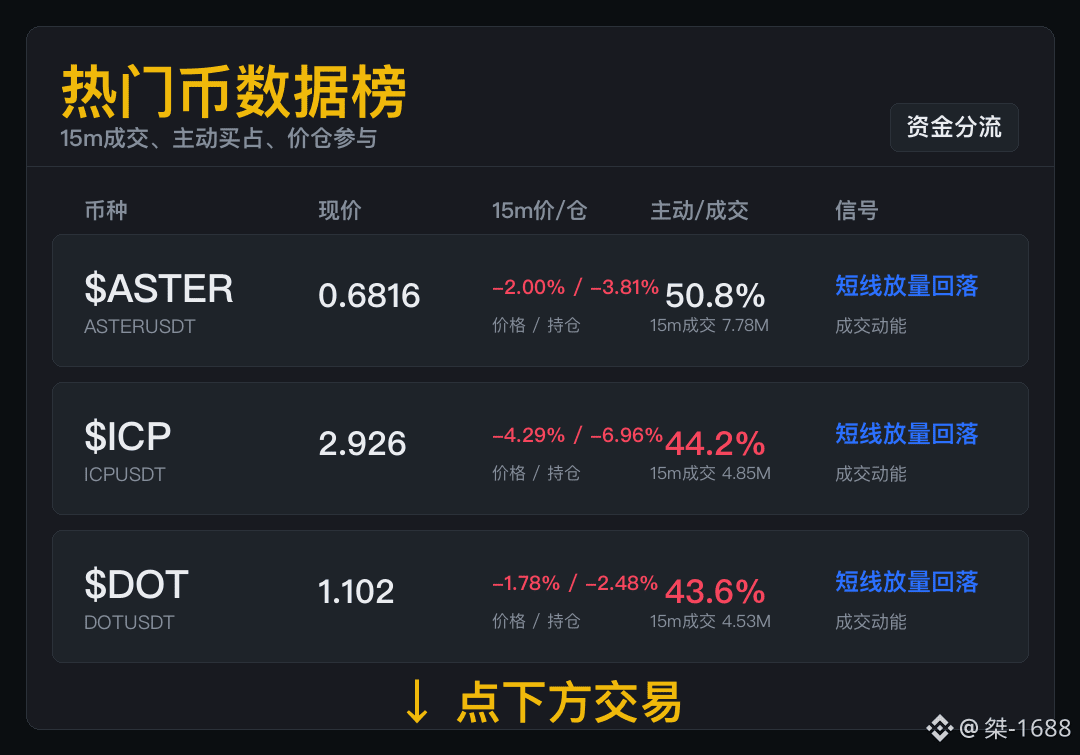
Opportunities are not lacking—what’s missing is data that can hold its ground.
$ASTER 15m volume traded 7.78M, price position -2.00% / -3.81%. For the short term, how actively participants engage matters more than just looking at whether the price is bullish or bearish. Being in the front of the order flow is your ticket; next, you still need to see whether the capital continues. Popularity is only the entry point—only when trading activity can keep you engaged is it worth continuing to watch.
$ICP 15m volume traded 4.85M, price position -4.29% / -6.96%. For the short term, active participation matters more than single-direction bullish/bearish signals. You can keep an eye on hot names, but don’t let the plaza’s sentiment make decisions for you. These are suitable for monitoring on the screen, not for jumping to conclusions based solely on hype.
$DOT short-term first look at volume traded: 4.53M. Active buying accounts for 43.6%, then check price position -1.78% / -2.48%. Where there are more people, there are more opportunities—and also more chances of misjudgment. Don’t just chase the lively scene. Hype is only for filtering entries, not the trading answer.
Opportunities are not lacking—what’s missing is data that can hold its ground.
$ASTER 15m volume traded 7.78M, price position -2.00% / -3.81%. For the short term, how actively participants engage matters more than just looking at whether the price is bullish or bearish. Being in the front of the order flow is your ticket; next, you still need to see whether the capital continues. Popularity is only the entry point—only when trading activity can keep you engaged is it worth continuing to watch.
$ICP 15m volume traded 4.85M, price position -4.29% / -6.96%. For the short term, active participation matters more than single-direction bullish/bearish signals. You can keep an eye on hot names, but don’t let the plaza’s sentiment make decisions for you. These are suitable for monitoring on the screen, not for jumping to conclusions based solely on hype.
$DOT short-term first look at volume traded: 4.53M. Active buying accounts for 43.6%, then check price position -1.78% / -2.48%. Where there are more people, there are more opportunities—and also more chances of misjudgment. Don’t just chase the lively scene. Hype is only for filtering entries, not the trading answer.
$ASTER 15m volume traded 7.78M, price position -2.00% / -3.81%. For the short term, how actively participants engage matters more than just looking at whether the price is bullish or bearish. Being in the front of the order flow is your ticket; next, you still need to see whether the capital continues. Popularity is only the entry point—only when trading activity can keep you engaged is it worth continuing to watch.
$ICP 15m volume traded 4.85M, price position -4.29% / -6.96%. For the short term, active participation matters more than single-direction bullish/bearish signals. You can keep an eye on hot names, but don’t let the plaza’s sentiment make decisions for you. These are suitable for monitoring on the screen, not for jumping to conclusions based solely on hype.
$DOT short-term first look at volume traded: 4.53M. Active buying accounts for 43.6%, then check price position -1.78% / -2.48%. Where there are more people, there are more opportunities—and also more chances of misjudgment. Don’t just chase the lively scene. Hype is only for filtering entries, not the trading answer.
1
1
1.5k
·
--
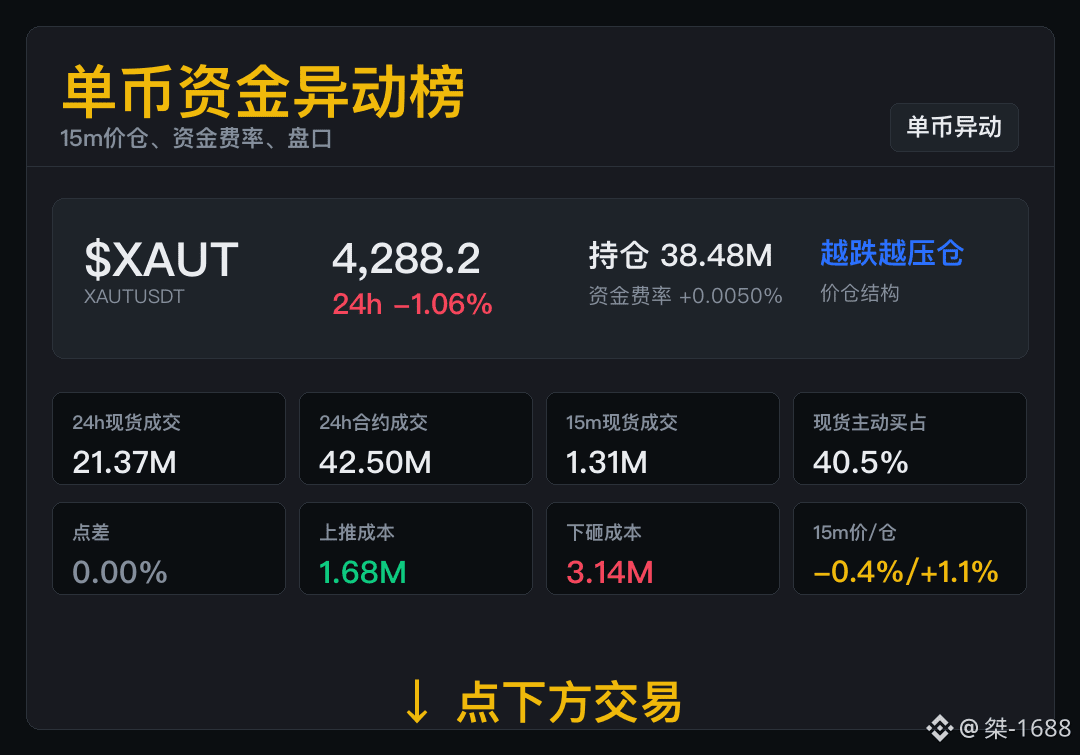
$XAUT This decline is accompanied by position expansion; short-term fluctuations may amplify.
Current price 4,288.2, 15m price -0.41%, 15m position +1.07%.
When the price faces downward pressure, position expansion continues, and the current disagreement is still deepening.
After the increase in positions slows down, continue to monitor whether the price shows signs of stabilization.
$XAUT This decline is accompanied by position expansion; short-term fluctuations may amplify.
Current price 4,288.2, 15m price -0.41%, 15m position +1.07%.
When the price faces downward pressure, position expansion continues, and the current disagreement is still deepening.
After the increase in positions slows down, continue to monitor whether the price shows signs of stabilization.
Current price 4,288.2, 15m price -0.41%, 15m position +1.07%.
When the price faces downward pressure, position expansion continues, and the current disagreement is still deepening.
After the increase in positions slows down, continue to monitor whether the price shows signs of stabilization.
467
·
--
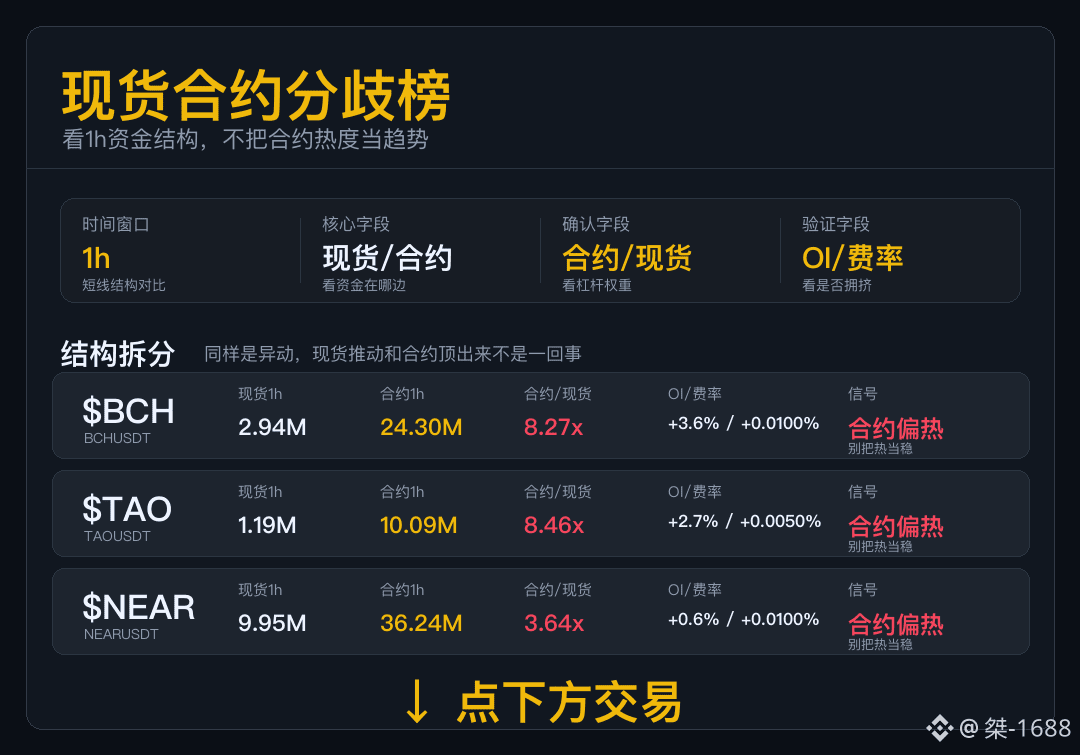
Spot Contract Dispute Leaderboard
In the last 1 hour, sources of capital appear split: is it the spot moving, or are the contracts抢ing the rhythm?
$BCH leveraged funds are moving first, while the spot hasn’t provided sufficient confirmation yet—this kind of market often moves quickly up and down.
$TAO contract trades are clearly heavier; OI and funding rates are also rising—short-term action looks more like leveraged capital is抢ing the rhythm. Whether it can continue depends on whether spot trading can catch up.
$NEAR right now it’s mainly contracts setting the pace; there’s enough heat, but it’s also easier to swing back and forth—when spot can’t keep up, don’t treat volatility as a trend.
Once spot trading volume is filled in, the source of funds shifts from one-sided leverage to a more complete picture.
Spot Contract Dispute Leaderboard
In the last 1 hour, sources of capital appear split: is it the spot moving, or are the contracts抢ing the rhythm?
$BCH leveraged funds are moving first, while the spot hasn’t provided sufficient confirmation yet—this kind of market often moves quickly up and down.
$TAO contract trades are clearly heavier; OI and funding rates are also rising—short-term action looks more like leveraged capital is抢ing the rhythm. Whether it can continue depends on whether spot trading can catch up.
$NEAR right now it’s mainly contracts setting the pace; there’s enough heat, but it’s also easier to swing back and forth—when spot can’t keep up, don’t treat volatility as a trend.
Once spot trading volume is filled in, the source of funds shifts from one-sided leverage to a more complete picture.
In the last 1 hour, sources of capital appear split: is it the spot moving, or are the contracts抢ing the rhythm?
$BCH leveraged funds are moving first, while the spot hasn’t provided sufficient confirmation yet—this kind of market often moves quickly up and down.
$TAO contract trades are clearly heavier; OI and funding rates are also rising—short-term action looks more like leveraged capital is抢ing the rhythm. Whether it can continue depends on whether spot trading can catch up.
$NEAR right now it’s mainly contracts setting the pace; there’s enough heat, but it’s also easier to swing back and forth—when spot can’t keep up, don’t treat volatility as a trend.
Once spot trading volume is filled in, the source of funds shifts from one-sided leverage to a more complete picture.
449
·
--
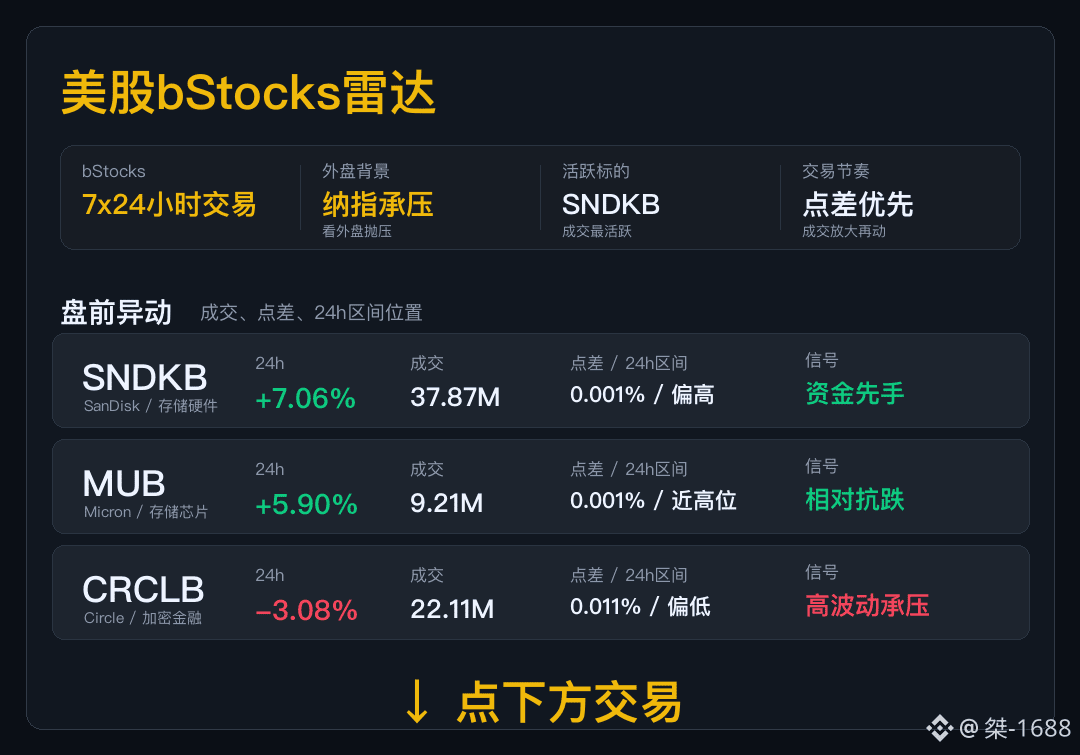
US stocks bStocks radar
Macro first: Nasdaq futures -0.20%, VIX 14.3, and the 10Y US Treasury is around 4.99%. Tonight the overall market tone is relatively cautious; with interest rates, volatility, and potential pressure on the index still in play, any rebound will first need to see whether trading volume can hold up.
Trading main line: The tech hardware theme is seeing money flow first. Tonight’s key focus is whether trading volume continues to stay near the front.
Before $SNDKB , some people have already been checking it out. Next, we need to see whether the price can be held. High volume at the front is just the entry point—the real question is whether the first wave of buy orders can hold.
Before $MUB , it has shown relatively less downside, but its current position is already not low. With a relatively high position and relatively strong volume at the front, before chasing higher prices you should first check whether the bid-ask spread has widened.
Before $CRCLB , momentum is strong enough, but the price hasn’t given a clear answer yet. The position is relatively low and volume is not small. At present, treat it as high-participation in a weak market; wait for the price to move away from the low zone before expecting a repair.
US stocks bStocks radar
Macro first: Nasdaq futures -0.20%, VIX 14.3, and the 10Y US Treasury is around 4.99%. Tonight the overall market tone is relatively cautious; with interest rates, volatility, and potential pressure on the index still in play, any rebound will first need to see whether trading volume can hold up.
Trading main line: The tech hardware theme is seeing money flow first. Tonight’s key focus is whether trading volume continues to stay near the front.
Before $SNDKB , some people have already been checking it out. Next, we need to see whether the price can be held. High volume at the front is just the entry point—the real question is whether the first wave of buy orders can hold.
Before $MUB , it has shown relatively less downside, but its current position is already not low. With a relatively high position and relatively strong volume at the front, before chasing higher prices you should first check whether the bid-ask spread has widened.
Before $CRCLB , momentum is strong enough, but the price hasn’t given a clear answer yet. The position is relatively low and volume is not small. At present, treat it as high-participation in a weak market; wait for the price to move away from the low zone before expecting a repair.
Macro first: Nasdaq futures -0.20%, VIX 14.3, and the 10Y US Treasury is around 4.99%. Tonight the overall market tone is relatively cautious; with interest rates, volatility, and potential pressure on the index still in play, any rebound will first need to see whether trading volume can hold up.
Trading main line: The tech hardware theme is seeing money flow first. Tonight’s key focus is whether trading volume continues to stay near the front.
Before $SNDKB , some people have already been checking it out. Next, we need to see whether the price can be held. High volume at the front is just the entry point—the real question is whether the first wave of buy orders can hold.
Before $MUB , it has shown relatively less downside, but its current position is already not low. With a relatively high position and relatively strong volume at the front, before chasing higher prices you should first check whether the bid-ask spread has widened.
Before $CRCLB , momentum is strong enough, but the price hasn’t given a clear answer yet. The position is relatively low and volume is not small. At present, treat it as high-participation in a weak market; wait for the price to move away from the low zone before expecting a repair.
355
·
--
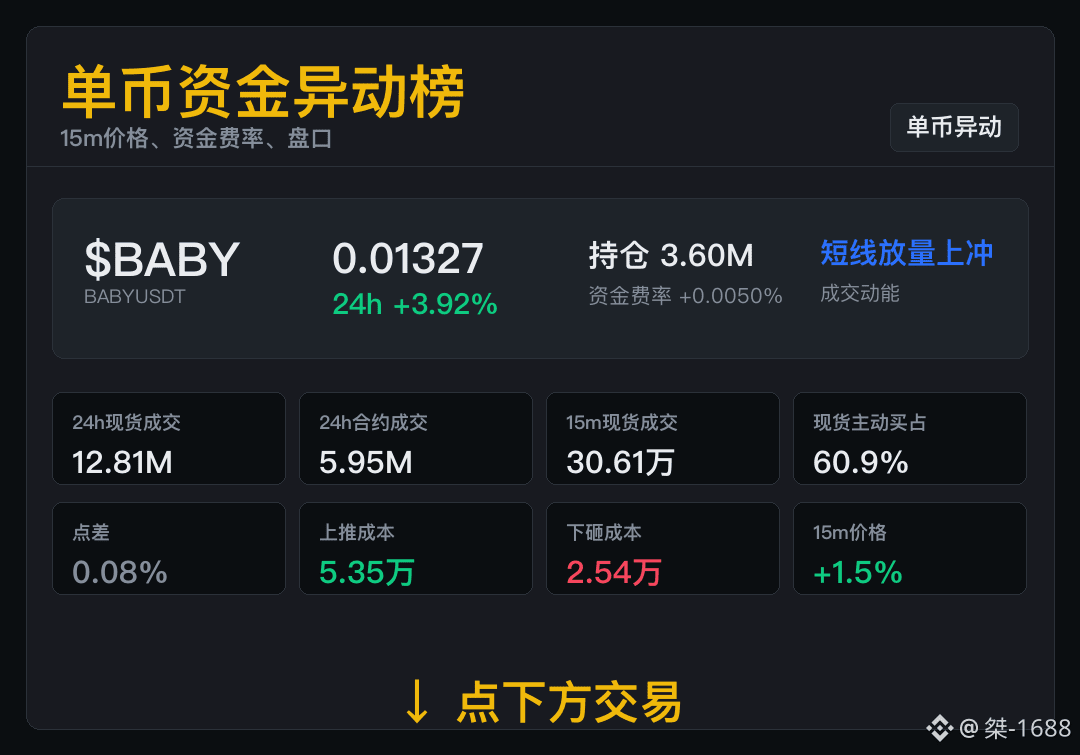
$BABY There is trading heat in this segment. Please confirm the allocation to settlement afterwards.
Current price is 0.01327. Spot成交 is 12.81M, and contract成交 is 5.95M.
The contract payment is close to neutral; the price and volume are the main things to watch currently.
In the next round, first verify the volume/energy, then see whether the spread has widened.
$BABY There is trading heat in this segment. Please confirm the allocation to settlement afterwards.
Current price is 0.01327. Spot成交 is 12.81M, and contract成交 is 5.95M.
The contract payment is close to neutral; the price and volume are the main things to watch currently.
In the next round, first verify the volume/energy, then see whether the spread has widened.
Current price is 0.01327. Spot成交 is 12.81M, and contract成交 is 5.95M.
The contract payment is close to neutral; the price and volume are the main things to watch currently.
In the next round, first verify the volume/energy, then see whether the spread has widened.
85
·
--
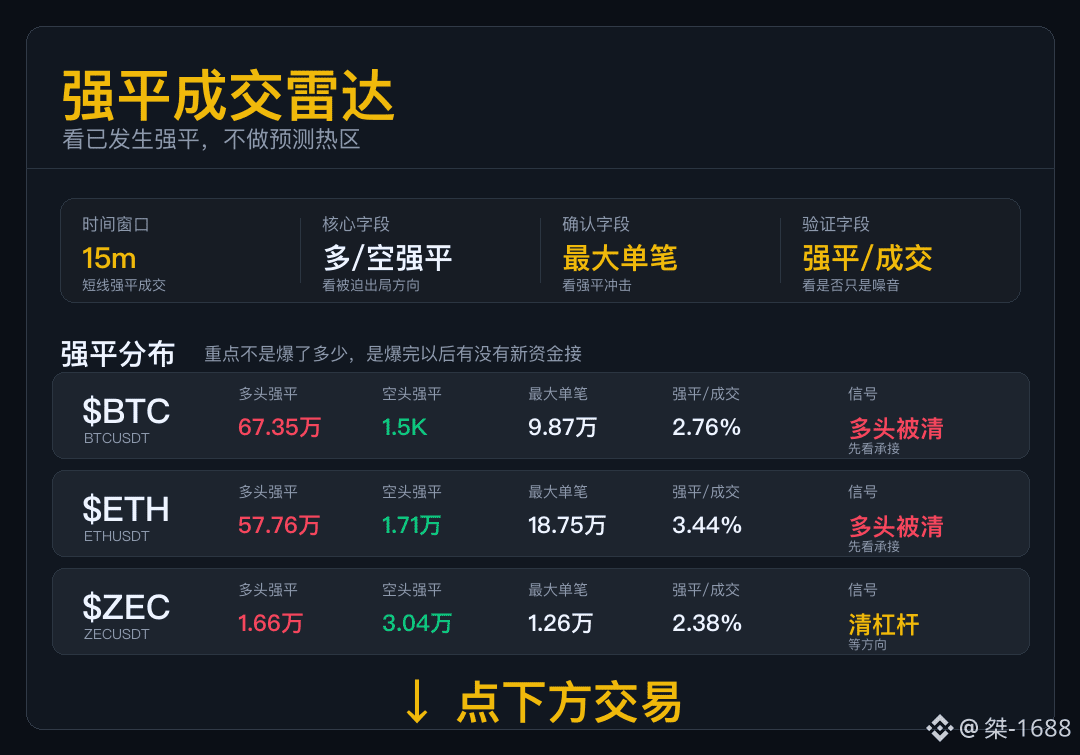
Strong liquidation turnover radar
For data like this, first see who is being forced out.
$BTC long positions are cleared more obviously on the side; the rebound is not impossible to look at, but first check whether, after the forced liquidation, there is a new bid that steps in.
$ETH 15m The long forced liquidation is clearly higher than the short side; leveraged long positions are being forced to exit.
$ZEC This kind of forced liquidation doesn’t directly give direction; it mainly serves as a reminder that the upcoming volatility will be more selective about follow-through.
Overall, it leans toward long-side deleveraging, but each individual has different order replenishment; later, watch which one repairs the trades first.
Strong liquidation turnover radar
For data like this, first see who is being forced out.
$BTC long positions are cleared more obviously on the side; the rebound is not impossible to look at, but first check whether, after the forced liquidation, there is a new bid that steps in.
$ETH 15m The long forced liquidation is clearly higher than the short side; leveraged long positions are being forced to exit.
$ZEC This kind of forced liquidation doesn’t directly give direction; it mainly serves as a reminder that the upcoming volatility will be more selective about follow-through.
Overall, it leans toward long-side deleveraging, but each individual has different order replenishment; later, watch which one repairs the trades first.
For data like this, first see who is being forced out.
$BTC long positions are cleared more obviously on the side; the rebound is not impossible to look at, but first check whether, after the forced liquidation, there is a new bid that steps in.
$ETH 15m The long forced liquidation is clearly higher than the short side; leveraged long positions are being forced to exit.
$ZEC This kind of forced liquidation doesn’t directly give direction; it mainly serves as a reminder that the upcoming volatility will be more selective about follow-through.
Overall, it leans toward long-side deleveraging, but each individual has different order replenishment; later, watch which one repairs the trades first.
371
·
--
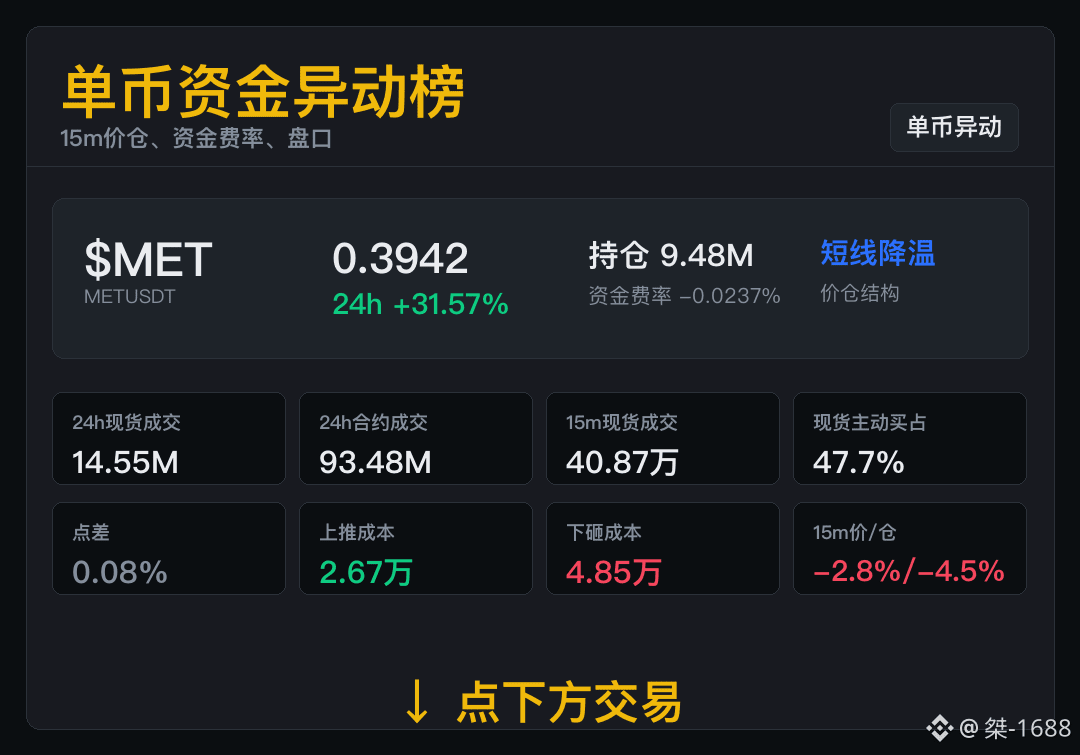
$MET positions are reducing amid a pullback; for now, track according to the cooling structure.
Current price 0.3942, 15m price -2.76%, 15m positions -4.47%.
Price and positions are both declining in sync; the next move needs fresh trading to recover.
When both price and positions continue to fall, maintain a relatively low level of attention.
$MET positions are reducing amid a pullback; for now, track according to the cooling structure.
Current price 0.3942, 15m price -2.76%, 15m positions -4.47%.
Price and positions are both declining in sync; the next move needs fresh trading to recover.
When both price and positions continue to fall, maintain a relatively low level of attention.
Current price 0.3942, 15m price -2.76%, 15m positions -4.47%.
Price and positions are both declining in sync; the next move needs fresh trading to recover.
When both price and positions continue to fall, maintain a relatively low level of attention.
147
·
--
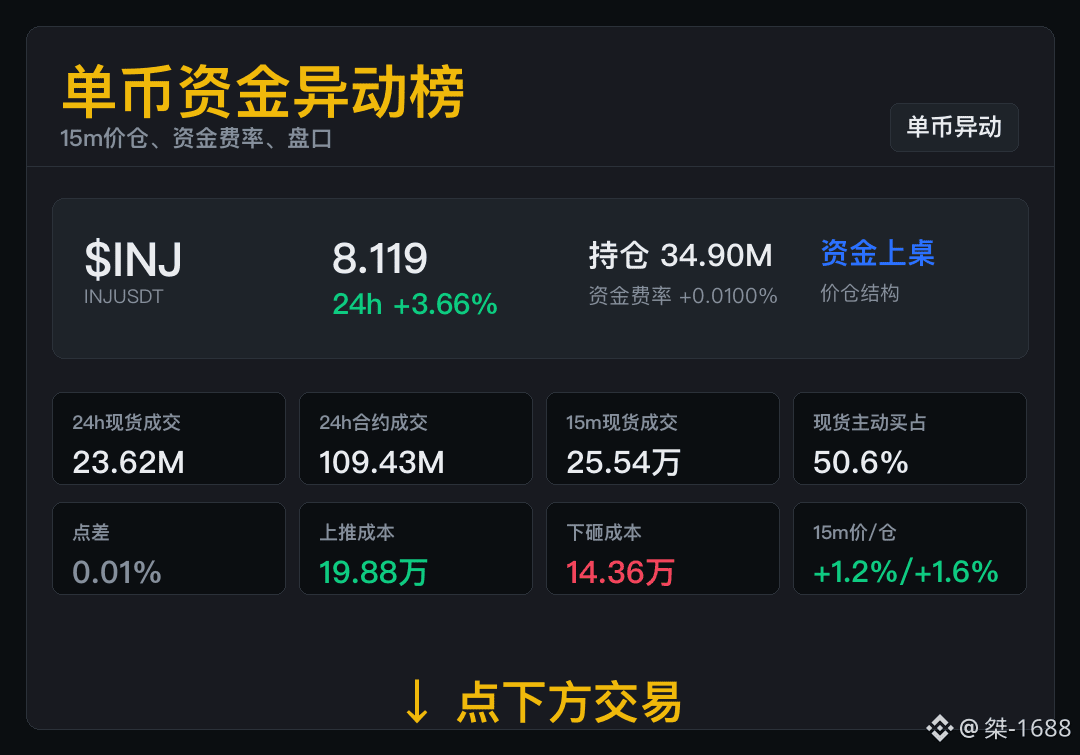
$INJ price and open interest both rising, short-term participation is increasing.
15m spot trading volume 255,400, 15m price +1.17%, 15m open interest +1.62%.
As price moves higher, open interest expands, and short-term participation is strengthening.
In the next stage, compare the price positions and volume; if the readings are out of sync, slow down tracking.
$INJ price and open interest both rising, short-term participation is increasing.
15m spot trading volume 255,400, 15m price +1.17%, 15m open interest +1.62%.
As price moves higher, open interest expands, and short-term participation is strengthening.
In the next stage, compare the price positions and volume; if the readings are out of sync, slow down tracking.
15m spot trading volume 255,400, 15m price +1.17%, 15m open interest +1.62%.
As price moves higher, open interest expands, and short-term participation is strengthening.
In the next stage, compare the price positions and volume; if the readings are out of sync, slow down tracking.
44
·
--
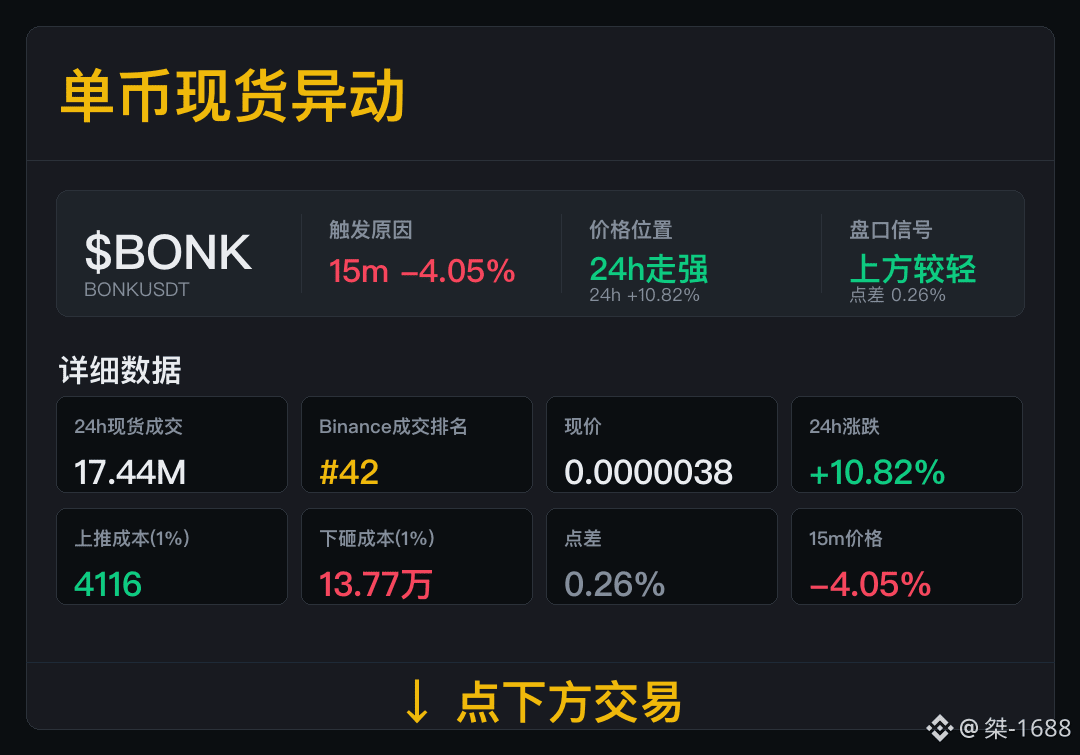
$BONK First, look at the execution costs for this segment.
Spot trades: 17.44M, Binance trade ranking #42. Note the trade size for now; in the next section, see whether turnover can be maintained.
Now, over the last 24h: price change +10.82%; bid-ask spread 0.26%. Upward pushing cost: 4116; downward dumping cost: 137,700. For now, continue tracking to confirm whether you still want to look at the next round of trades.
Next, focus on the spread and trading activity. Once the spread holds steady and trading continues, we’ll discuss the next section.
$BONK First, look at the execution costs for this segment.
Spot trades: 17.44M, Binance trade ranking #42. Note the trade size for now; in the next section, see whether turnover can be maintained.
Now, over the last 24h: price change +10.82%; bid-ask spread 0.26%. Upward pushing cost: 4116; downward dumping cost: 137,700. For now, continue tracking to confirm whether you still want to look at the next round of trades.
Next, focus on the spread and trading activity. Once the spread holds steady and trading continues, we’ll discuss the next section.
Spot trades: 17.44M, Binance trade ranking #42. Note the trade size for now; in the next section, see whether turnover can be maintained.
Now, over the last 24h: price change +10.82%; bid-ask spread 0.26%. Upward pushing cost: 4116; downward dumping cost: 137,700. For now, continue tracking to confirm whether you still want to look at the next round of trades.
Next, focus on the spread and trading activity. Once the spread holds steady and trading continues, we’ll discuss the next section.
109
Log in to explore more content
Join global crypto users on Binance Square
⚡️ Get latest and useful information about crypto.
💬 Trusted by the world’s largest crypto exchange.
👍 Discover real insights from verified creators.
Email / Phone number
Trending Topics
AIStocksWhatNext
838,309 views
6,402 Discussing
Share & Win Traffic Reward in our Trending Hashtag Campaign
✨Topic: What Other Investment Opportunities Remain as AI Stocks Keep Rising?
👉How to Join:
Publish a short post or article with hashtag #AIStocksWhatNext
Share whether you’re bullish or bearish, and post your AI stock holdings or trade — using the trade widget may improve your eligibility.
You can also strengthen your post by sharing data or charts, and avoiding AI-generated images.
✍️Create content based on the below angles:
- Nvidia says chip sales will double next year, and top AI companies keep hitting record revenue, the compute spend behind it is just as staggering. Is AI demand really taking off? And how long can it last? AI stocks are up across the board. Is this a real breakout, or just a short-term bounce?
- Industry leaders are calling to slow down AI development, while Trump plans to build an “AI Force”, claiming AI could account for 25% of U.S. GDP in the future. Whose side are you on? Will state-level backing be a long-term win for AI stocks?
- Are you buying AI stocks? Share your AI-related trade/holdings with our trade sharing widget.
⏰Campaign Period:
- 2026-09-22 7:00 - 2026-09-24 4:00 UTC
🎁Reward:
- Qualified posts that comply with the above guidelines and contain more than 100 words will be reviewed and may receive a random traffic boost of 500 to 3,000 views. You will receive a notification from your feed secretary if your post is selected.
- Get a chance to have your article featured on Binance Square Official
Need ideas for your post? Visit the topic page #AIStocksWhatNext or the Square Guide on How to Post for Better Reach.
Binance Square Official
·575 Likes
·1.6M views
BitcoinRejectedAt$87,300Twice
0 views
0 Discussing
BCHJumps28%OnCMEFuturesListing
5,980 views
418 Discussing