
Bit_Guru
42.3k Posts

Bit_Guru
 Square Verified+
Report
Block User
Only Live Trader on Binance Square 💛 // Binance, CMC & X kols handle @bitgu_ru // PnL is always Live

Live Trader

Creator Awards 2024
Open Trade
Frequent Trader
2.6 Years
63 Following
156.6K+ Followers
300.4K+ Liked
3 Badges
Posts
Portfolio
All
Quotes
Videos
Live
PINNED
·
--
Article
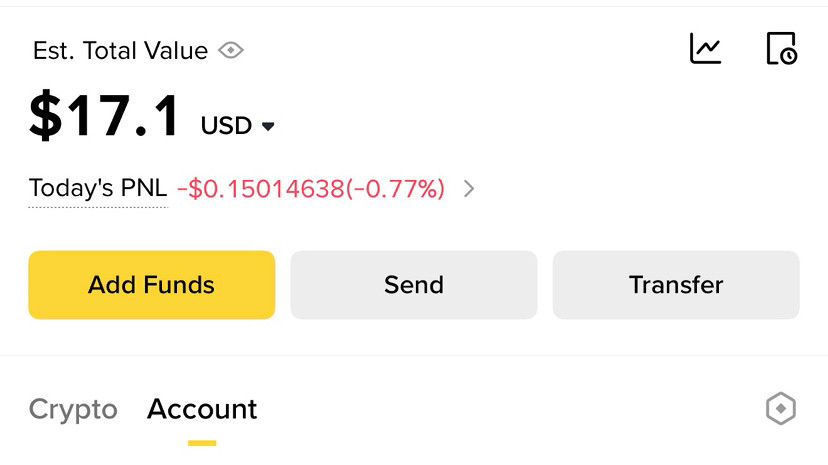
Is it possible to make $100 with only $17Many people think you need a big account to make real money in trading. That’s not true. The truth is simple it’s not about how much you start with, it’s about how you manage what you have.
Yes, it is absolutely possible to turn $17 into $100. But not by luck, not by gambling, and definitely not by chasing every pump you see. It requires discipline, patience, and a clear plan.
First, you need to understand one thing: small capital requires smart execution. You can’t afford big mistakes. One bad trade with high risk can wipe out your account. That’s why risk management becomes your strongest weapon.
Set a daily target. It doesn’t need to be huge. Even 3%–5% per day is enough. It may sound small, but consistency compounds faster than you think. If you stay disciplined, those small wins start building into something big.
Second, patience is everything. You don’t need to trade every day or every setup. Wait for clear opportunities strong support and resistance, clean breakouts, or obvious rejection zones. The market always gives chances, but only patient traders take the right ones.
Third, control your emotions. With a small account, people often overtrade because they want fast results. That’s where most fail. They increase leverage, take random entries, and ignore their plan. You have to do the opposite stay calm, follow your setup, and accept slow growth.
Another important point is consistency over hype. You don’t need one big win. You need many small correct decisions. That’s what builds your account. Even if you grow your account from $17 to $20, then $25, then $35 you are already winning.
Also, protect your capital at all costs. If you lose your account, the journey ends. If you protect it, you always have another chance.
In simple terms:
You don’t grow a small account by rushing
You grow it by repeating a disciplined process again and again
So yes, turning $17 into $100 is possible. But only for those who are willing to stay patient, follow a plan, and trade with control instead of emotion.
The market rewards consistency, not desperation
Start small
Stay focused
And let your discipline do the work
Trade Only coins Like $ETH , $BNB & $SOL
#cryptotradingpro #RiskManagementMastery
{future}(ETHUSDT)
{future}(BNBUSDT)
{future}(SOLUSDT)
Is it possible to make $100 with only $17
Many people think you need a big account to make real money in trading. That’s not true. The truth is simple it’s not about how much you start with, it’s about how you manage what you have.
Yes, it is absolutely possible to turn $17 into $100. But not by luck, not by gambling, and definitely not by chasing every pump you see. It requires discipline, patience, and a clear plan.
First, you need to understand one thing: small capital requires smart execution. You can’t afford big mistakes. One bad trade with high risk can wipe out your account. That’s why risk management becomes your strongest weapon.
Set a daily target. It doesn’t need to be huge. Even 3%–5% per day is enough. It may sound small, but consistency compounds faster than you think. If you stay disciplined, those small wins start building into something big.
Second, patience is everything. You don’t need to trade every day or every setup. Wait for clear opportunities strong support and resistance, clean breakouts, or obvious rejection zones. The market always gives chances, but only patient traders take the right ones.
Third, control your emotions. With a small account, people often overtrade because they want fast results. That’s where most fail. They increase leverage, take random entries, and ignore their plan. You have to do the opposite stay calm, follow your setup, and accept slow growth.
Another important point is consistency over hype. You don’t need one big win. You need many small correct decisions. That’s what builds your account. Even if you grow your account from $17 to $20, then $25, then $35 you are already winning.
Also, protect your capital at all costs. If you lose your account, the journey ends. If you protect it, you always have another chance.
In simple terms:
You don’t grow a small account by rushing
You grow it by repeating a disciplined process again and again
So yes, turning $17 into $100 is possible. But only for those who are willing to stay patient, follow a plan, and trade with control instead of emotion.
The market rewards consistency, not desperation
Start small
Stay focused
And let your discipline do the work
Trade Only coins Like $ETH , $BNB & $SOL
#cryptotradingpro #RiskManagementMastery
Yes, it is absolutely possible to turn $17 into $100. But not by luck, not by gambling, and definitely not by chasing every pump you see. It requires discipline, patience, and a clear plan.
First, you need to understand one thing: small capital requires smart execution. You can’t afford big mistakes. One bad trade with high risk can wipe out your account. That’s why risk management becomes your strongest weapon.
Set a daily target. It doesn’t need to be huge. Even 3%–5% per day is enough. It may sound small, but consistency compounds faster than you think. If you stay disciplined, those small wins start building into something big.
Second, patience is everything. You don’t need to trade every day or every setup. Wait for clear opportunities strong support and resistance, clean breakouts, or obvious rejection zones. The market always gives chances, but only patient traders take the right ones.
Third, control your emotions. With a small account, people often overtrade because they want fast results. That’s where most fail. They increase leverage, take random entries, and ignore their plan. You have to do the opposite stay calm, follow your setup, and accept slow growth.
Another important point is consistency over hype. You don’t need one big win. You need many small correct decisions. That’s what builds your account. Even if you grow your account from $17 to $20, then $25, then $35 you are already winning.
Also, protect your capital at all costs. If you lose your account, the journey ends. If you protect it, you always have another chance.
In simple terms:
You don’t grow a small account by rushing
You grow it by repeating a disciplined process again and again
So yes, turning $17 into $100 is possible. But only for those who are willing to stay patient, follow a plan, and trade with control instead of emotion.
The market rewards consistency, not desperation
Start small
Stay focused
And let your discipline do the work
Trade Only coins Like $ETH , $BNB & $SOL
#cryptotradingpro #RiskManagementMastery
312
55
744
689k
PINNED
·
--
Bullish
It took me 4 years in the crypto market to realize these things & you only need 2 minutes to read: 🤏
1. No matter the market condition, one thing stays the same: 8% of people will own 21 million Bitcoin.
2. Financial, capital, and risk management skills are 100 times more important than technical analysis or crypto research.
3. Earning while you sleep: There are many ways to make money in the crypto market without actively trading.
On average, #Bitcoin has increased more than 100% per year over the past 15 years. Yet, why do so few people make money? Because getting rich quickly is a common mentality. If you can't dedicate at least 4 hours a day to crypto, stick to Bitcoin and ETH—70% in BTC and 30% in ETH.
Trust no one: Trust leads to hope, disappointment, and errors. Learn independently and take responsibility for your actions. This is how to gain automatic minting experience!
The ultimate goal of investing: Make life more meaningful. If crypto investing can achieve that, do it. If not, reconsider.
Crypto is now a financial market: Originally born from technology, it's now influenced by macroeconomics and connected to mainstream financial markets.
People may discourage you from buying Bitcoin, but remember, once something is widely accepted, the opportunity might be gone. Seize your chance now!
Invest wisely, make meaningful choices, and let crypto pave the way to a better future.
#CryptoInvesting #ethbeta #Write2Earn! #BinanceTurns7 $BTC $ETH $SOL
{spot}(SOLUSDT)
{spot}(ETHUSDT)
{spot}(BTCUSDT)
It took me 4 years in the crypto market to realize these things & you only need 2 minutes to read: 🤏
1. No matter the market condition, one thing stays the same: 8% of people will own 21 million Bitcoin.
2. Financial, capital, and risk management skills are 100 times more important than technical analysis or crypto research.
3. Earning while you sleep: There are many ways to make money in the crypto market without actively trading.
On average, #Bitcoin has increased more than 100% per year over the past 15 years. Yet, why do so few people make money? Because getting rich quickly is a common mentality. If you can't dedicate at least 4 hours a day to crypto, stick to Bitcoin and ETH—70% in BTC and 30% in ETH.
Trust no one: Trust leads to hope, disappointment, and errors. Learn independently and take responsibility for your actions. This is how to gain automatic minting experience!
The ultimate goal of investing: Make life more meaningful. If crypto investing can achieve that, do it. If not, reconsider.
Crypto is now a financial market: Originally born from technology, it's now influenced by macroeconomics and connected to mainstream financial markets.
People may discourage you from buying Bitcoin, but remember, once something is widely accepted, the opportunity might be gone. Seize your chance now!
Invest wisely, make meaningful choices, and let crypto pave the way to a better future.
#CryptoInvesting #ethbeta #Write2Earn! #BinanceTurns7 $BTC $ETH $SOL
1. No matter the market condition, one thing stays the same: 8% of people will own 21 million Bitcoin.
2. Financial, capital, and risk management skills are 100 times more important than technical analysis or crypto research.
3. Earning while you sleep: There are many ways to make money in the crypto market without actively trading.
On average, #Bitcoin has increased more than 100% per year over the past 15 years. Yet, why do so few people make money? Because getting rich quickly is a common mentality. If you can't dedicate at least 4 hours a day to crypto, stick to Bitcoin and ETH—70% in BTC and 30% in ETH.
Trust no one: Trust leads to hope, disappointment, and errors. Learn independently and take responsibility for your actions. This is how to gain automatic minting experience!
The ultimate goal of investing: Make life more meaningful. If crypto investing can achieve that, do it. If not, reconsider.
Crypto is now a financial market: Originally born from technology, it's now influenced by macroeconomics and connected to mainstream financial markets.
People may discourage you from buying Bitcoin, but remember, once something is widely accepted, the opportunity might be gone. Seize your chance now!
Invest wisely, make meaningful choices, and let crypto pave the way to a better future.
#CryptoInvesting #ethbeta #Write2Earn! #BinanceTurns7 $BTC $ETH $SOL

302
102
2.2k
1.1M
·
--
$STABLE is in focus… ✅🚨 DOWN!
Entry: 0.027634 - 0.027661
SL: 0.02773
TP1: 0.02751 | TP2: 0.027447 | TP3: 0.027385
$STABLE is in focus… ✅🚨 DOWN!
Entry: 0.027634 - 0.027661
SL: 0.02773
TP1: 0.02751 | TP2: 0.027447 | TP3: 0.027385
Entry: 0.027634 - 0.027661
SL: 0.02773
TP1: 0.02751 | TP2: 0.027447 | TP3: 0.027385
90
·
--
This $FF setup is hot… ‼️🔥 UP!
Entry: 0.15429 - 0.15444
SL: 0.15328
TP1: 0.15667 | TP2: 0.15778 | TP3: 0.15889
This $FF setup is hot… ‼️🔥 UP!
Entry: 0.15429 - 0.15444
SL: 0.15328
TP1: 0.15667 | TP2: 0.15778 | TP3: 0.15889
Entry: 0.15429 - 0.15444
SL: 0.15328
TP1: 0.15667 | TP2: 0.15778 | TP3: 0.15889
282
·
--
Wait wait wait… 🔥 $TAG is ready to move DOWN!
Entry: 0.000684342 - 0.000685026
SL: 0.000689957
TP1: 0.000675432 | TP2: 0.000670977 | TP3: 0.000666522
Wait wait wait… 🔥 $TAG is ready to move DOWN!
Entry: 0.000684342 - 0.000685026
SL: 0.000689957
TP1: 0.000675432 | TP2: 0.000670977 | TP3: 0.000666522
Entry: 0.000684342 - 0.000685026
SL: 0.000689957
TP1: 0.000675432 | TP2: 0.000670977 | TP3: 0.000666522
1
320
·
--
AGTUSDT: A High-Volatility Market With a Short-Biased Scanner Setup𝗧𝗵𝗲 𝗺𝗮𝗿𝗸𝗲𝘁 𝗶𝘀 𝗳𝗮𝗹𝗹𝗶𝗻𝗴 𝘄𝗶𝘁𝗵 𝗵𝗶𝗴𝗵𝗲𝗿-𝘁𝗵𝗮𝗻-𝗯𝗮𝘀𝗲𝗹𝗶𝗻𝗲 𝗮𝗰𝘁𝗶𝘃𝗶𝘁𝘆
AGTUSDT appeared in the live scanner as a short-side candidate after a sharp decline. The supplied ticker data shows a last price of 0.015443 USDT, compared with an opening price of 0.017001 USDT for the tracked period. That represents a price change of -0.001558 USDT, or -9.164%. The session ranged from 0.014800 to 0.017038, showing that AGT has experienced a wide trading range rather than a quiet, gradual move.
The scanner’s reference price is 0.015436 USDT, almost identical to the ticker’s last price. Its recorded 15-minute move is -0.1875%, while the volume ratio is 1.4514. In the scanner’s framework, recent activity is running above its comparison level. The scanner classified AGT as a TOP_LOSER, ranked it third in that category, and assigned the setup a 99.4% confidence reading. That figure describes the scanner’s output; it does not establish the future direction of the market.
The supplied ticker also records 144,031,009 AGT in volume and approximately 2.256 million USDT in quote volume. The combination of a large daily decline, a broad intraday range, and elevated activity explains why AGT has become a prominent technical setup. The available data describes market behavior clearly, but it does not provide a verified explanation for the move.
𝗪𝗵𝗮𝘁 𝗶𝘀 𝗸𝗻𝗼𝘄𝗻 𝗮𝗯𝗼𝘂𝘁 𝗔𝗚𝗧 — 𝗮𝗻𝗱 𝘄𝗵𝗮𝘁 𝗶𝘀 𝗻𝗼𝘁
The research identifies AGT through the AGTUSDT market, but it does not provide the project’s official name, blockchain, contract address, founding team, launch date, whitepaper, or stated mission. CoinGecko data is unavailable, and the news feed contains no entries. As a result, the token cannot be reliably linked to a specific sector, protocol, company, game, artificial-intelligence product, exchange, or real-world asset narrative.
This limitation matters because a ticker alone does not establish a project’s identity or purpose. The supplied material does confirm that AGT is actively trading in the tracked market and that its recent price and volume data are available. It does not establish what problem the token is intended to solve, who developed it, or which users or applications depend on it.
For now, AGT is best assessed as a market-structure and liquidity story rather than a verified fundamental story. Claims about partnerships, product adoption, token utility, or ecosystem growth would require documentation that is not present in the research. The absence of those details does not prove that such activity does not exist; it means the activity cannot be confirmed from the supplied sources.
𝗨𝘁𝗶𝗹𝗶𝘁𝘆, 𝘀𝘂𝗽𝗽𝗹𝘆 𝗮𝗻𝗱 𝗲𝗰𝗼𝘀𝘆𝘀𝘁𝗲𝗺 𝗱𝗮𝘁𝗮 𝗮𝗿𝗲 𝗺𝗶𝘀𝘀𝗶𝗻𝗴
No verified information was supplied about AGT’s utility. The available research does not establish whether the token is used for governance, transaction fees, staking, access, payments, rewards, collateral, or another function. It also does not confirm a live application, active users, developer activity, integrations, or locked liquidity.
Supply information is absent as well. There is no verified maximum supply, circulating supply, total supply, vesting schedule, emission rate, burn mechanism, allocation breakdown, or unlock calendar in the dataset. Because circulating supply is unavailable, market capitalization cannot be calculated responsibly from the current information. Price alone says little about valuation: a token trading near 0.015 USDT could have a relatively small or very large market value depending on its supply.
These missing details prevent a complete fundamental assessment. Future dilution, concentrated ownership, and scheduled unlocks cannot be evaluated using the supplied price and volume records alone. A fuller review would require verified information about AGT’s contract and chain, token allocation, holder concentration, treasury wallets, unlock timetable, and evidence that any stated utility is being used. None of those details should be inferred from the ticker or from a short-term chart.
𝗧𝗵𝗲 𝗰𝗵𝗮𝗿𝘁 𝘀𝗵𝗼𝘄𝘀 𝗮 𝘀𝗵𝗮𝗿𝗽 𝗯𝗿𝗲𝗮𝗸𝗱𝗼𝘄𝗻, 𝗳𝗼𝗹𝗹𝗼𝘄𝗲𝗱 𝗯𝘆 𝗶𝗻𝗰𝗼𝗺𝗽𝗹𝗲𝘁𝗲 𝗿𝗲𝗰𝗼𝘃𝗲𝗿𝗶𝗲𝘀
The hourly candles show a clear change in short-term structure. AGT began the broader tracked period near 0.016919 to 0.017001 and initially held above 0.0165. It reached a high of 0.017038 before the market moved lower. The most notable decline occurred during an hourly candle that opened near 0.016787, reached a low of 0.014987, and closed around 0.015471. That candle recorded roughly 31.0 million AGT in volume, considerably more than many surrounding hourly candles. The following hour also remained active, with approximately 13.7 million AGT traded.
The move lower was not completely one-directional. A later rebound lifted the market from an hourly low near 0.015143 to a high of 0.015712. Another hourly candle then reached 0.015856. Those moves show that buyers were active around the lower portion of the range, but the recovery did not hold its highest levels. Subsequent hourly closes moved through 0.015686, 0.015588, 0.015477, and 0.015403 before a modest recovery toward 0.015493 and a return near 0.015443.
The resulting structure remains fragile. The rebound produced a series of lower highs near 0.015856, 0.015712, and 0.015686, all above the latest price. Those levels represent overhead areas created during the recovery. Until the market reclaims them, the chart continues to show pressure following the high-volume decline. At the same time, the repeated reactions around the 0.01523 region show that the market has not moved lower without interruption.
𝗧𝗵𝗲 𝘀𝗰𝗮𝗻𝗻𝗲𝗿’𝘀 𝘀𝗵𝗼𝗿𝘁 𝘇𝗼𝗻𝗲 𝘀𝗶𝘁𝘀 𝗰𝗹𝗼𝘀𝗲 𝘁𝗼 𝗰𝘂𝗿𝗿𝗲𝗻𝘁 𝗽𝗿𝗶𝗰𝗲
The scanner gives an entry band of 0.015443718 to 0.015459154 USDT. This band sits directly around the current market, making it a nearby reaction zone rather than a distant projection. Scanner resistance is listed at 0.015474584, with a stop-loss reference at 0.015521008. The downside reference levels are 0.015292132, 0.015216339, and 0.015140547. The scanner reports a risk-reward ratio of 2.4507 for the setup.
The apparent logic is that a weak rebound is pressing into nearby resistance after a major decline. The entry band is only slightly above the ticker’s last price, while the first downside reference sits near the recent consolidation area around 0.01523 to 0.01529. The second and third levels point toward lower parts of the recovery range.
The scanner’s selection score is 170.88, and its hot-priority value is 13.92425. These values indicate that AGT was selected within the scanner’s ranking system. They do not independently establish the strength or reliability of the trade thesis. The scanner’s confidence reading should be understood in the same way: it reflects the model’s assessment of the available market pattern, not certainty about the next price movement.
Recent candle ranges also create an execution challenge for any level-based interpretation. One hourly candle moved between 0.016836 and 0.014987, while a four-hour candle recorded a range from 0.015383 to 0.014800. In a market with ranges of that size, price can move through an entry, resistance, or target level and then reverse. The scanner levels are therefore most useful as a map of pressure, support, and invalidation rather than as evidence of a smooth path.
𝗞𝗲𝘆 𝗹𝗲𝘃𝗲𝗹𝘀 𝗱𝗲𝗳𝗶𝗻𝗲 𝘁𝗵𝗲 𝗻𝗲𝗮𝗿-𝘁𝗲𝗿𝗺 𝗱𝗲𝗯𝗮𝘁𝗲
The closest scanner support is 0.0152325 USDT. Several recent hourly candles tested the 0.01523 area without producing a lasting move below it. The first scanner downside reference is 0.015292132, followed by 0.015216339 and 0.015140547. The last two levels are close to the area where AGT previously found temporary demand after the large decline.
Overhead, scanner resistance is 0.015474584, just above the ticker’s last price. The upper edge of the scanner’s entry band is 0.015459154, and the stop-loss reference is 0.015521008. A sustained move above that level would challenge the immediate bearish setup. The reaction would be more significant if price also held above the nearby 0.01555 area, which was included in the recent hourly trading range.
The broader recovery levels are higher. Recent hourly highs reached 0.015712 and 0.015856, while the four-hour data shows a high of 0.016086 after the breakdown. These levels form successive areas of resistance if buyers regain control. On the downside, the session low of 0.014800 is the main visible market reference. A move below it would extend the damaged structure, while a sustained defense of 0.0152325 followed by a reclaim of 0.015521 would show that the market is absorbing selling pressure rather than simply continuing lower.
These levels are observations from the supplied data. They are not fixed future outcomes, and price can move through them temporarily without confirming a lasting breakout or breakdown.
𝗕𝗶𝘁𝗰𝗼𝗶𝗻’𝘀 𝘀𝘁𝗮𝗯𝗹𝗲𝗿 𝗽𝗿𝗶𝗰𝗲 𝗴𝗶𝘃𝗲𝘀 𝗔𝗚𝗧 𝗮 𝗱𝗶𝗳𝗳𝗲𝗿𝗲𝗻𝘁 𝗯𝗮𝗰𝗸𝗱𝗿𝗼𝗽
The supplied Bitcoin ticker records a last price of 77,259 USDT and a change of 0.153% over its tracked period. BTC traded between 76,000.30 and 79,859.80, with quote volume of approximately 15.1 billion USDT. Compared with AGT’s 9.164% decline, Bitcoin was considerably steadier during the same period.
This comparison indicates that AGT’s decline was not accompanied by an equivalent Bitcoin selloff in the supplied data. It does not identify the reason for AGT’s weakness, but it shows that the two markets behaved differently during the tracked period. AGT may be responding to token-specific selling, a failed catalyst, liquidity conditions, or another factor that is not documented in the research. None of those possibilities is confirmed.
Bitcoin remains relevant to the broader trading environment. A move toward the lower end of its recorded range could create additional pressure across risk assets, while stability near the current level would remove one possible source of market-wide weakness. Neither outcome resolves AGT’s project-specific information gap or guarantees a particular response from AGTUSDT.
𝗡𝗼 𝘃𝗲𝗿𝗶𝗳𝗶𝗲𝗱 𝗻𝗲𝘄𝘀 𝗲𝘅𝗽𝗹𝗮𝗶𝗻𝘀 𝘁𝗵𝗲 𝘀𝗲𝗹𝗹𝗼𝗳𝗳
The research feed contains no recent AGT news. There is no verified announcement in the supplied material concerning a listing, delisting, partnership, product launch, token unlock, migration, exploit, governance decision, or exchange-related event. It is therefore not appropriate to present any of those as the cause of the decline.
The reported open interest is 232,965,041 AGT. This is an important market statistic, but it does not reveal whether participants are predominantly long or short. Funding rates, liquidation data, and an open-interest history are not supplied, so the positioning cannot be interpreted with confidence. The available number confirms reported open interest at the recorded time; it does not establish the direction of the positions behind it.
A verified project announcement could alter the market’s interpretation, but the current dataset does not provide one. For the same reason, the selloff should not be assigned to a large holder, an unlock, derivatives positioning, or a technical issue without supporting evidence. The clearest confirmed explanation is simply that AGT experienced a high-volume decline while no news catalyst was available in the research feed.
𝗥𝗶𝘀𝗸𝘀 𝗮𝗻𝗱 𝘁𝗵𝗲 𝗻𝗲𝘅𝘁 𝗲𝘃𝗶𝗱𝗲𝗻𝗰𝗲 𝘁𝗼 𝘄𝗮𝘁𝗰𝗵
The first major risk is information risk. The project identity, utility, supply, market capitalization, team background, and ecosystem activity remain unverified. That limits fundamental valuation and makes it difficult to determine whether the chart reflects a temporary market event or a deeper project issue.
The second risk is volatility. AGT traded between 0.014800 and 0.017038 during the tracked session, and its largest candles covered unusually wide ranges. Rapid movement can create false breaks, sharp reversals, and temporary price excursions around the scanner’s levels.
The third risk is a reversal against the current bearish structure. A move above 0.015521 would challenge the scanner’s invalidation reference. Recovery through 0.015686 and 0.015856 would show that buyers are reclaiming levels created during the rebound. Conversely, rejection between approximately 0.015474 and 0.015521 followed by a break of 0.0152325 would keep the scanner’s downside structure in view.
The most useful evidence from here will be price behavior around 0.0152325 and 0.015521, the volume accompanying any break, and whether the 0.0154437 to 0.0154592 zone acts as resistance or is reclaimed. Changes in reported open interest, funding, liquidations, holder concentration, and unlock information would also add context, but those details are not currently included in the research.
𝗕𝗮𝗹𝗮𝗻𝗰𝗲𝗱 𝗰𝗼𝗻𝗰𝗹𝘂𝘀𝗶𝗼𝗻
AGTUSDT stands out because the technical evidence is clear while the fundamental record is incomplete. The token fell 9.164% during the tracked period, traded 144,031,009 AGT, and moved through a wide range between 0.014800 and 0.017038. The hourly data shows a high-volume breakdown from the 0.0168 area toward the 0.0148 to 0.0152 region, followed by several rebounds that failed to hold their highest levels.
The scanner identifies a short-biased zone near 0.01544 to 0.01546, resistance near 0.015475, an invalidation reference around 0.015521, and downside references near 0.015292, 0.015216, and 0.015141. At the same time, support around 0.0152325 has held during recent tests, Bitcoin has been comparatively stable, and the chart has already demonstrated that rebounds can be sharp.
The most defensible conclusion is that AGT is currently a high-volatility, technically weak market with a short-biased scanner setup, not a fully understood fundamental project. The next meaningful developments will come from price behavior around nearby support and resistance, the quality of volume behind any move, changes in derivatives data, and verified information about AGT’s identity, supply, utility, and development. The chart describes the current pressure, but the available research does not yet explain the complete story.
AGTUSDT: A High-Volatility Market With a Short-Biased Scanner Setup
𝗧𝗵𝗲 𝗺𝗮𝗿𝗸𝗲𝘁 𝗶𝘀 𝗳𝗮𝗹𝗹𝗶𝗻𝗴 𝘄𝗶𝘁𝗵 𝗵𝗶𝗴𝗵𝗲𝗿-𝘁𝗵𝗮𝗻-𝗯𝗮𝘀𝗲𝗹𝗶𝗻𝗲 𝗮𝗰𝘁𝗶𝘃𝗶𝘁𝘆
AGTUSDT appeared in the live scanner as a short-side candidate after a sharp decline. The supplied ticker data shows a last price of 0.015443 USDT, compared with an opening price of 0.017001 USDT for the tracked period. That represents a price change of -0.001558 USDT, or -9.164%. The session ranged from 0.014800 to 0.017038, showing that AGT has experienced a wide trading range rather than a quiet, gradual move.
The scanner’s reference price is 0.015436 USDT, almost identical to the ticker’s last price. Its recorded 15-minute move is -0.1875%, while the volume ratio is 1.4514. In the scanner’s framework, recent activity is running above its comparison level. The scanner classified AGT as a TOP_LOSER, ranked it third in that category, and assigned the setup a 99.4% confidence reading. That figure describes the scanner’s output; it does not establish the future direction of the market.
The supplied ticker also records 144,031,009 AGT in volume and approximately 2.256 million USDT in quote volume. The combination of a large daily decline, a broad intraday range, and elevated activity explains why AGT has become a prominent technical setup. The available data describes market behavior clearly, but it does not provide a verified explanation for the move.
𝗪𝗵𝗮𝘁 𝗶𝘀 𝗸𝗻𝗼𝘄𝗻 𝗮𝗯𝗼𝘂𝘁 𝗔𝗚𝗧 — 𝗮𝗻𝗱 𝘄𝗵𝗮𝘁 𝗶𝘀 𝗻𝗼𝘁
The research identifies AGT through the AGTUSDT market, but it does not provide the project’s official name, blockchain, contract address, founding team, launch date, whitepaper, or stated mission. CoinGecko data is unavailable, and the news feed contains no entries. As a result, the token cannot be reliably linked to a specific sector, protocol, company, game, artificial-intelligence product, exchange, or real-world asset narrative.
This limitation matters because a ticker alone does not establish a project’s identity or purpose. The supplied material does confirm that AGT is actively trading in the tracked market and that its recent price and volume data are available. It does not establish what problem the token is intended to solve, who developed it, or which users or applications depend on it.
For now, AGT is best assessed as a market-structure and liquidity story rather than a verified fundamental story. Claims about partnerships, product adoption, token utility, or ecosystem growth would require documentation that is not present in the research. The absence of those details does not prove that such activity does not exist; it means the activity cannot be confirmed from the supplied sources.
𝗨𝘁𝗶𝗹𝗶𝘁𝘆, 𝘀𝘂𝗽𝗽𝗹𝘆 𝗮𝗻𝗱 𝗲𝗰𝗼𝘀𝘆𝘀𝘁𝗲𝗺 𝗱𝗮𝘁𝗮 𝗮𝗿𝗲 𝗺𝗶𝘀𝘀𝗶𝗻𝗴
No verified information was supplied about AGT’s utility. The available research does not establish whether the token is used for governance, transaction fees, staking, access, payments, rewards, collateral, or another function. It also does not confirm a live application, active users, developer activity, integrations, or locked liquidity.
Supply information is absent as well. There is no verified maximum supply, circulating supply, total supply, vesting schedule, emission rate, burn mechanism, allocation breakdown, or unlock calendar in the dataset. Because circulating supply is unavailable, market capitalization cannot be calculated responsibly from the current information. Price alone says little about valuation: a token trading near 0.015 USDT could have a relatively small or very large market value depending on its supply.
These missing details prevent a complete fundamental assessment. Future dilution, concentrated ownership, and scheduled unlocks cannot be evaluated using the supplied price and volume records alone. A fuller review would require verified information about AGT’s contract and chain, token allocation, holder concentration, treasury wallets, unlock timetable, and evidence that any stated utility is being used. None of those details should be inferred from the ticker or from a short-term chart.
𝗧𝗵𝗲 𝗰𝗵𝗮𝗿𝘁 𝘀𝗵𝗼𝘄𝘀 𝗮 𝘀𝗵𝗮𝗿𝗽 𝗯𝗿𝗲𝗮𝗸𝗱𝗼𝘄𝗻, 𝗳𝗼𝗹𝗹𝗼𝘄𝗲𝗱 𝗯𝘆 𝗶𝗻𝗰𝗼𝗺𝗽𝗹𝗲𝘁𝗲 𝗿𝗲𝗰𝗼𝘃𝗲𝗿𝗶𝗲𝘀
The hourly candles show a clear change in short-term structure. AGT began the broader tracked period near 0.016919 to 0.017001 and initially held above 0.0165. It reached a high of 0.017038 before the market moved lower. The most notable decline occurred during an hourly candle that opened near 0.016787, reached a low of 0.014987, and closed around 0.015471. That candle recorded roughly 31.0 million AGT in volume, considerably more than many surrounding hourly candles. The following hour also remained active, with approximately 13.7 million AGT traded.
The move lower was not completely one-directional. A later rebound lifted the market from an hourly low near 0.015143 to a high of 0.015712. Another hourly candle then reached 0.015856. Those moves show that buyers were active around the lower portion of the range, but the recovery did not hold its highest levels. Subsequent hourly closes moved through 0.015686, 0.015588, 0.015477, and 0.015403 before a modest recovery toward 0.015493 and a return near 0.015443.
The resulting structure remains fragile. The rebound produced a series of lower highs near 0.015856, 0.015712, and 0.015686, all above the latest price. Those levels represent overhead areas created during the recovery. Until the market reclaims them, the chart continues to show pressure following the high-volume decline. At the same time, the repeated reactions around the 0.01523 region show that the market has not moved lower without interruption.
𝗧𝗵𝗲 𝘀𝗰𝗮𝗻𝗻𝗲𝗿’𝘀 𝘀𝗵𝗼𝗿𝘁 𝘇𝗼𝗻𝗲 𝘀𝗶𝘁𝘀 𝗰𝗹𝗼𝘀𝗲 𝘁𝗼 𝗰𝘂𝗿𝗿𝗲𝗻𝘁 𝗽𝗿𝗶𝗰𝗲
The scanner gives an entry band of 0.015443718 to 0.015459154 USDT. This band sits directly around the current market, making it a nearby reaction zone rather than a distant projection. Scanner resistance is listed at 0.015474584, with a stop-loss reference at 0.015521008. The downside reference levels are 0.015292132, 0.015216339, and 0.015140547. The scanner reports a risk-reward ratio of 2.4507 for the setup.
The apparent logic is that a weak rebound is pressing into nearby resistance after a major decline. The entry band is only slightly above the ticker’s last price, while the first downside reference sits near the recent consolidation area around 0.01523 to 0.01529. The second and third levels point toward lower parts of the recovery range.
The scanner’s selection score is 170.88, and its hot-priority value is 13.92425. These values indicate that AGT was selected within the scanner’s ranking system. They do not independently establish the strength or reliability of the trade thesis. The scanner’s confidence reading should be understood in the same way: it reflects the model’s assessment of the available market pattern, not certainty about the next price movement.
Recent candle ranges also create an execution challenge for any level-based interpretation. One hourly candle moved between 0.016836 and 0.014987, while a four-hour candle recorded a range from 0.015383 to 0.014800. In a market with ranges of that size, price can move through an entry, resistance, or target level and then reverse. The scanner levels are therefore most useful as a map of pressure, support, and invalidation rather than as evidence of a smooth path.
𝗞𝗲𝘆 𝗹𝗲𝘃𝗲𝗹𝘀 𝗱𝗲𝗳𝗶𝗻𝗲 𝘁𝗵𝗲 𝗻𝗲𝗮𝗿-𝘁𝗲𝗿𝗺 𝗱𝗲𝗯𝗮𝘁𝗲
The closest scanner support is 0.0152325 USDT. Several recent hourly candles tested the 0.01523 area without producing a lasting move below it. The first scanner downside reference is 0.015292132, followed by 0.015216339 and 0.015140547. The last two levels are close to the area where AGT previously found temporary demand after the large decline.
Overhead, scanner resistance is 0.015474584, just above the ticker’s last price. The upper edge of the scanner’s entry band is 0.015459154, and the stop-loss reference is 0.015521008. A sustained move above that level would challenge the immediate bearish setup. The reaction would be more significant if price also held above the nearby 0.01555 area, which was included in the recent hourly trading range.
The broader recovery levels are higher. Recent hourly highs reached 0.015712 and 0.015856, while the four-hour data shows a high of 0.016086 after the breakdown. These levels form successive areas of resistance if buyers regain control. On the downside, the session low of 0.014800 is the main visible market reference. A move below it would extend the damaged structure, while a sustained defense of 0.0152325 followed by a reclaim of 0.015521 would show that the market is absorbing selling pressure rather than simply continuing lower.
These levels are observations from the supplied data. They are not fixed future outcomes, and price can move through them temporarily without confirming a lasting breakout or breakdown.
𝗕𝗶𝘁𝗰𝗼𝗶𝗻’𝘀 𝘀𝘁𝗮𝗯𝗹𝗲𝗿 𝗽𝗿𝗶𝗰𝗲 𝗴𝗶𝘃𝗲𝘀 𝗔𝗚𝗧 𝗮 𝗱𝗶𝗳𝗳𝗲𝗿𝗲𝗻𝘁 𝗯𝗮𝗰𝗸𝗱𝗿𝗼𝗽
The supplied Bitcoin ticker records a last price of 77,259 USDT and a change of 0.153% over its tracked period. BTC traded between 76,000.30 and 79,859.80, with quote volume of approximately 15.1 billion USDT. Compared with AGT’s 9.164% decline, Bitcoin was considerably steadier during the same period.
This comparison indicates that AGT’s decline was not accompanied by an equivalent Bitcoin selloff in the supplied data. It does not identify the reason for AGT’s weakness, but it shows that the two markets behaved differently during the tracked period. AGT may be responding to token-specific selling, a failed catalyst, liquidity conditions, or another factor that is not documented in the research. None of those possibilities is confirmed.
Bitcoin remains relevant to the broader trading environment. A move toward the lower end of its recorded range could create additional pressure across risk assets, while stability near the current level would remove one possible source of market-wide weakness. Neither outcome resolves AGT’s project-specific information gap or guarantees a particular response from AGTUSDT.
𝗡𝗼 𝘃𝗲𝗿𝗶𝗳𝗶𝗲𝗱 𝗻𝗲𝘄𝘀 𝗲𝘅𝗽𝗹𝗮𝗶𝗻𝘀 𝘁𝗵𝗲 𝘀𝗲𝗹𝗹𝗼𝗳𝗳
The research feed contains no recent AGT news. There is no verified announcement in the supplied material concerning a listing, delisting, partnership, product launch, token unlock, migration, exploit, governance decision, or exchange-related event. It is therefore not appropriate to present any of those as the cause of the decline.
The reported open interest is 232,965,041 AGT. This is an important market statistic, but it does not reveal whether participants are predominantly long or short. Funding rates, liquidation data, and an open-interest history are not supplied, so the positioning cannot be interpreted with confidence. The available number confirms reported open interest at the recorded time; it does not establish the direction of the positions behind it.
A verified project announcement could alter the market’s interpretation, but the current dataset does not provide one. For the same reason, the selloff should not be assigned to a large holder, an unlock, derivatives positioning, or a technical issue without supporting evidence. The clearest confirmed explanation is simply that AGT experienced a high-volume decline while no news catalyst was available in the research feed.
𝗥𝗶𝘀𝗸𝘀 𝗮𝗻𝗱 𝘁𝗵𝗲 𝗻𝗲𝘅𝘁 𝗲𝘃𝗶𝗱𝗲𝗻𝗰𝗲 𝘁𝗼 𝘄𝗮𝘁𝗰𝗵
The first major risk is information risk. The project identity, utility, supply, market capitalization, team background, and ecosystem activity remain unverified. That limits fundamental valuation and makes it difficult to determine whether the chart reflects a temporary market event or a deeper project issue.
The second risk is volatility. AGT traded between 0.014800 and 0.017038 during the tracked session, and its largest candles covered unusually wide ranges. Rapid movement can create false breaks, sharp reversals, and temporary price excursions around the scanner’s levels.
The third risk is a reversal against the current bearish structure. A move above 0.015521 would challenge the scanner’s invalidation reference. Recovery through 0.015686 and 0.015856 would show that buyers are reclaiming levels created during the rebound. Conversely, rejection between approximately 0.015474 and 0.015521 followed by a break of 0.0152325 would keep the scanner’s downside structure in view.
The most useful evidence from here will be price behavior around 0.0152325 and 0.015521, the volume accompanying any break, and whether the 0.0154437 to 0.0154592 zone acts as resistance or is reclaimed. Changes in reported open interest, funding, liquidations, holder concentration, and unlock information would also add context, but those details are not currently included in the research.
𝗕𝗮𝗹𝗮𝗻𝗰𝗲𝗱 𝗰𝗼𝗻𝗰𝗹𝘂𝘀𝗶𝗼𝗻
AGTUSDT stands out because the technical evidence is clear while the fundamental record is incomplete. The token fell 9.164% during the tracked period, traded 144,031,009 AGT, and moved through a wide range between 0.014800 and 0.017038. The hourly data shows a high-volume breakdown from the 0.0168 area toward the 0.0148 to 0.0152 region, followed by several rebounds that failed to hold their highest levels.
The scanner identifies a short-biased zone near 0.01544 to 0.01546, resistance near 0.015475, an invalidation reference around 0.015521, and downside references near 0.015292, 0.015216, and 0.015141. At the same time, support around 0.0152325 has held during recent tests, Bitcoin has been comparatively stable, and the chart has already demonstrated that rebounds can be sharp.
The most defensible conclusion is that AGT is currently a high-volatility, technically weak market with a short-biased scanner setup, not a fully understood fundamental project. The next meaningful developments will come from price behavior around nearby support and resistance, the quality of volume behind any move, changes in derivatives data, and verified information about AGT’s identity, supply, utility, and development. The chart describes the current pressure, but the available research does not yet explain the complete story.
AGTUSDT appeared in the live scanner as a short-side candidate after a sharp decline. The supplied ticker data shows a last price of 0.015443 USDT, compared with an opening price of 0.017001 USDT for the tracked period. That represents a price change of -0.001558 USDT, or -9.164%. The session ranged from 0.014800 to 0.017038, showing that AGT has experienced a wide trading range rather than a quiet, gradual move.
The scanner’s reference price is 0.015436 USDT, almost identical to the ticker’s last price. Its recorded 15-minute move is -0.1875%, while the volume ratio is 1.4514. In the scanner’s framework, recent activity is running above its comparison level. The scanner classified AGT as a TOP_LOSER, ranked it third in that category, and assigned the setup a 99.4% confidence reading. That figure describes the scanner’s output; it does not establish the future direction of the market.
The supplied ticker also records 144,031,009 AGT in volume and approximately 2.256 million USDT in quote volume. The combination of a large daily decline, a broad intraday range, and elevated activity explains why AGT has become a prominent technical setup. The available data describes market behavior clearly, but it does not provide a verified explanation for the move.
𝗪𝗵𝗮𝘁 𝗶𝘀 𝗸𝗻𝗼𝘄𝗻 𝗮𝗯𝗼𝘂𝘁 𝗔𝗚𝗧 — 𝗮𝗻𝗱 𝘄𝗵𝗮𝘁 𝗶𝘀 𝗻𝗼𝘁
The research identifies AGT through the AGTUSDT market, but it does not provide the project’s official name, blockchain, contract address, founding team, launch date, whitepaper, or stated mission. CoinGecko data is unavailable, and the news feed contains no entries. As a result, the token cannot be reliably linked to a specific sector, protocol, company, game, artificial-intelligence product, exchange, or real-world asset narrative.
This limitation matters because a ticker alone does not establish a project’s identity or purpose. The supplied material does confirm that AGT is actively trading in the tracked market and that its recent price and volume data are available. It does not establish what problem the token is intended to solve, who developed it, or which users or applications depend on it.
For now, AGT is best assessed as a market-structure and liquidity story rather than a verified fundamental story. Claims about partnerships, product adoption, token utility, or ecosystem growth would require documentation that is not present in the research. The absence of those details does not prove that such activity does not exist; it means the activity cannot be confirmed from the supplied sources.
𝗨𝘁𝗶𝗹𝗶𝘁𝘆, 𝘀𝘂𝗽𝗽𝗹𝘆 𝗮𝗻𝗱 𝗲𝗰𝗼𝘀𝘆𝘀𝘁𝗲𝗺 𝗱𝗮𝘁𝗮 𝗮𝗿𝗲 𝗺𝗶𝘀𝘀𝗶𝗻𝗴
No verified information was supplied about AGT’s utility. The available research does not establish whether the token is used for governance, transaction fees, staking, access, payments, rewards, collateral, or another function. It also does not confirm a live application, active users, developer activity, integrations, or locked liquidity.
Supply information is absent as well. There is no verified maximum supply, circulating supply, total supply, vesting schedule, emission rate, burn mechanism, allocation breakdown, or unlock calendar in the dataset. Because circulating supply is unavailable, market capitalization cannot be calculated responsibly from the current information. Price alone says little about valuation: a token trading near 0.015 USDT could have a relatively small or very large market value depending on its supply.
These missing details prevent a complete fundamental assessment. Future dilution, concentrated ownership, and scheduled unlocks cannot be evaluated using the supplied price and volume records alone. A fuller review would require verified information about AGT’s contract and chain, token allocation, holder concentration, treasury wallets, unlock timetable, and evidence that any stated utility is being used. None of those details should be inferred from the ticker or from a short-term chart.
𝗧𝗵𝗲 𝗰𝗵𝗮𝗿𝘁 𝘀𝗵𝗼𝘄𝘀 𝗮 𝘀𝗵𝗮𝗿𝗽 𝗯𝗿𝗲𝗮𝗸𝗱𝗼𝘄𝗻, 𝗳𝗼𝗹𝗹𝗼𝘄𝗲𝗱 𝗯𝘆 𝗶𝗻𝗰𝗼𝗺𝗽𝗹𝗲𝘁𝗲 𝗿𝗲𝗰𝗼𝘃𝗲𝗿𝗶𝗲𝘀
The hourly candles show a clear change in short-term structure. AGT began the broader tracked period near 0.016919 to 0.017001 and initially held above 0.0165. It reached a high of 0.017038 before the market moved lower. The most notable decline occurred during an hourly candle that opened near 0.016787, reached a low of 0.014987, and closed around 0.015471. That candle recorded roughly 31.0 million AGT in volume, considerably more than many surrounding hourly candles. The following hour also remained active, with approximately 13.7 million AGT traded.
The move lower was not completely one-directional. A later rebound lifted the market from an hourly low near 0.015143 to a high of 0.015712. Another hourly candle then reached 0.015856. Those moves show that buyers were active around the lower portion of the range, but the recovery did not hold its highest levels. Subsequent hourly closes moved through 0.015686, 0.015588, 0.015477, and 0.015403 before a modest recovery toward 0.015493 and a return near 0.015443.
The resulting structure remains fragile. The rebound produced a series of lower highs near 0.015856, 0.015712, and 0.015686, all above the latest price. Those levels represent overhead areas created during the recovery. Until the market reclaims them, the chart continues to show pressure following the high-volume decline. At the same time, the repeated reactions around the 0.01523 region show that the market has not moved lower without interruption.
𝗧𝗵𝗲 𝘀𝗰𝗮𝗻𝗻𝗲𝗿’𝘀 𝘀𝗵𝗼𝗿𝘁 𝘇𝗼𝗻𝗲 𝘀𝗶𝘁𝘀 𝗰𝗹𝗼𝘀𝗲 𝘁𝗼 𝗰𝘂𝗿𝗿𝗲𝗻𝘁 𝗽𝗿𝗶𝗰𝗲
The scanner gives an entry band of 0.015443718 to 0.015459154 USDT. This band sits directly around the current market, making it a nearby reaction zone rather than a distant projection. Scanner resistance is listed at 0.015474584, with a stop-loss reference at 0.015521008. The downside reference levels are 0.015292132, 0.015216339, and 0.015140547. The scanner reports a risk-reward ratio of 2.4507 for the setup.
The apparent logic is that a weak rebound is pressing into nearby resistance after a major decline. The entry band is only slightly above the ticker’s last price, while the first downside reference sits near the recent consolidation area around 0.01523 to 0.01529. The second and third levels point toward lower parts of the recovery range.
The scanner’s selection score is 170.88, and its hot-priority value is 13.92425. These values indicate that AGT was selected within the scanner’s ranking system. They do not independently establish the strength or reliability of the trade thesis. The scanner’s confidence reading should be understood in the same way: it reflects the model’s assessment of the available market pattern, not certainty about the next price movement.
Recent candle ranges also create an execution challenge for any level-based interpretation. One hourly candle moved between 0.016836 and 0.014987, while a four-hour candle recorded a range from 0.015383 to 0.014800. In a market with ranges of that size, price can move through an entry, resistance, or target level and then reverse. The scanner levels are therefore most useful as a map of pressure, support, and invalidation rather than as evidence of a smooth path.
𝗞𝗲𝘆 𝗹𝗲𝘃𝗲𝗹𝘀 𝗱𝗲𝗳𝗶𝗻𝗲 𝘁𝗵𝗲 𝗻𝗲𝗮𝗿-𝘁𝗲𝗿𝗺 𝗱𝗲𝗯𝗮𝘁𝗲
The closest scanner support is 0.0152325 USDT. Several recent hourly candles tested the 0.01523 area without producing a lasting move below it. The first scanner downside reference is 0.015292132, followed by 0.015216339 and 0.015140547. The last two levels are close to the area where AGT previously found temporary demand after the large decline.
Overhead, scanner resistance is 0.015474584, just above the ticker’s last price. The upper edge of the scanner’s entry band is 0.015459154, and the stop-loss reference is 0.015521008. A sustained move above that level would challenge the immediate bearish setup. The reaction would be more significant if price also held above the nearby 0.01555 area, which was included in the recent hourly trading range.
The broader recovery levels are higher. Recent hourly highs reached 0.015712 and 0.015856, while the four-hour data shows a high of 0.016086 after the breakdown. These levels form successive areas of resistance if buyers regain control. On the downside, the session low of 0.014800 is the main visible market reference. A move below it would extend the damaged structure, while a sustained defense of 0.0152325 followed by a reclaim of 0.015521 would show that the market is absorbing selling pressure rather than simply continuing lower.
These levels are observations from the supplied data. They are not fixed future outcomes, and price can move through them temporarily without confirming a lasting breakout or breakdown.
𝗕𝗶𝘁𝗰𝗼𝗶𝗻’𝘀 𝘀𝘁𝗮𝗯𝗹𝗲𝗿 𝗽𝗿𝗶𝗰𝗲 𝗴𝗶𝘃𝗲𝘀 𝗔𝗚𝗧 𝗮 𝗱𝗶𝗳𝗳𝗲𝗿𝗲𝗻𝘁 𝗯𝗮𝗰𝗸𝗱𝗿𝗼𝗽
The supplied Bitcoin ticker records a last price of 77,259 USDT and a change of 0.153% over its tracked period. BTC traded between 76,000.30 and 79,859.80, with quote volume of approximately 15.1 billion USDT. Compared with AGT’s 9.164% decline, Bitcoin was considerably steadier during the same period.
This comparison indicates that AGT’s decline was not accompanied by an equivalent Bitcoin selloff in the supplied data. It does not identify the reason for AGT’s weakness, but it shows that the two markets behaved differently during the tracked period. AGT may be responding to token-specific selling, a failed catalyst, liquidity conditions, or another factor that is not documented in the research. None of those possibilities is confirmed.
Bitcoin remains relevant to the broader trading environment. A move toward the lower end of its recorded range could create additional pressure across risk assets, while stability near the current level would remove one possible source of market-wide weakness. Neither outcome resolves AGT’s project-specific information gap or guarantees a particular response from AGTUSDT.
𝗡𝗼 𝘃𝗲𝗿𝗶𝗳𝗶𝗲𝗱 𝗻𝗲𝘄𝘀 𝗲𝘅𝗽𝗹𝗮𝗶𝗻𝘀 𝘁𝗵𝗲 𝘀𝗲𝗹𝗹𝗼𝗳𝗳
The research feed contains no recent AGT news. There is no verified announcement in the supplied material concerning a listing, delisting, partnership, product launch, token unlock, migration, exploit, governance decision, or exchange-related event. It is therefore not appropriate to present any of those as the cause of the decline.
The reported open interest is 232,965,041 AGT. This is an important market statistic, but it does not reveal whether participants are predominantly long or short. Funding rates, liquidation data, and an open-interest history are not supplied, so the positioning cannot be interpreted with confidence. The available number confirms reported open interest at the recorded time; it does not establish the direction of the positions behind it.
A verified project announcement could alter the market’s interpretation, but the current dataset does not provide one. For the same reason, the selloff should not be assigned to a large holder, an unlock, derivatives positioning, or a technical issue without supporting evidence. The clearest confirmed explanation is simply that AGT experienced a high-volume decline while no news catalyst was available in the research feed.
𝗥𝗶𝘀𝗸𝘀 𝗮𝗻𝗱 𝘁𝗵𝗲 𝗻𝗲𝘅𝘁 𝗲𝘃𝗶𝗱𝗲𝗻𝗰𝗲 𝘁𝗼 𝘄𝗮𝘁𝗰𝗵
The first major risk is information risk. The project identity, utility, supply, market capitalization, team background, and ecosystem activity remain unverified. That limits fundamental valuation and makes it difficult to determine whether the chart reflects a temporary market event or a deeper project issue.
The second risk is volatility. AGT traded between 0.014800 and 0.017038 during the tracked session, and its largest candles covered unusually wide ranges. Rapid movement can create false breaks, sharp reversals, and temporary price excursions around the scanner’s levels.
The third risk is a reversal against the current bearish structure. A move above 0.015521 would challenge the scanner’s invalidation reference. Recovery through 0.015686 and 0.015856 would show that buyers are reclaiming levels created during the rebound. Conversely, rejection between approximately 0.015474 and 0.015521 followed by a break of 0.0152325 would keep the scanner’s downside structure in view.
The most useful evidence from here will be price behavior around 0.0152325 and 0.015521, the volume accompanying any break, and whether the 0.0154437 to 0.0154592 zone acts as resistance or is reclaimed. Changes in reported open interest, funding, liquidations, holder concentration, and unlock information would also add context, but those details are not currently included in the research.
𝗕𝗮𝗹𝗮𝗻𝗰𝗲𝗱 𝗰𝗼𝗻𝗰𝗹𝘂𝘀𝗶𝗼𝗻
AGTUSDT stands out because the technical evidence is clear while the fundamental record is incomplete. The token fell 9.164% during the tracked period, traded 144,031,009 AGT, and moved through a wide range between 0.014800 and 0.017038. The hourly data shows a high-volume breakdown from the 0.0168 area toward the 0.0148 to 0.0152 region, followed by several rebounds that failed to hold their highest levels.
The scanner identifies a short-biased zone near 0.01544 to 0.01546, resistance near 0.015475, an invalidation reference around 0.015521, and downside references near 0.015292, 0.015216, and 0.015141. At the same time, support around 0.0152325 has held during recent tests, Bitcoin has been comparatively stable, and the chart has already demonstrated that rebounds can be sharp.
The most defensible conclusion is that AGT is currently a high-volatility, technically weak market with a short-biased scanner setup, not a fully understood fundamental project. The next meaningful developments will come from price behavior around nearby support and resistance, the quality of volume behind any move, changes in derivatives data, and verified information about AGT’s identity, supply, utility, and development. The chart describes the current pressure, but the available research does not yet explain the complete story.
241
·
--
Guys, watch $SOPH closely… 🔥 UP!
Entry: 0.00479280 - 0.00479760
SL: 0.00476160
TP1: 0.00486672 | TP2: 0.00490128 | TP3: 0.00493584
Guys, watch $SOPH closely… 🔥 UP!
Entry: 0.00479280 - 0.00479760
SL: 0.00476160
TP1: 0.00486672 | TP2: 0.00490128 | TP3: 0.00493584
Entry: 0.00479280 - 0.00479760
SL: 0.00476160
TP1: 0.00486672 | TP2: 0.00490128 | TP3: 0.00493584
1
261
·
--
This $BEAT setup is hot… ‼️🔥 UP!
Entry: 0.09306 - 0.093153
SL: 0.092454
TP1: 0.094495 | TP2: 0.095167 | TP3: 0.095838
This $BEAT setup is hot… ‼️🔥 UP!
Entry: 0.09306 - 0.093153
SL: 0.092454
TP1: 0.094495 | TP2: 0.095167 | TP3: 0.095838
Entry: 0.09306 - 0.093153
SL: 0.092454
TP1: 0.094495 | TP2: 0.095167 | TP3: 0.095838
482
·
--
Wait wait wait… 🔥 $龙虾 is ready to move UP!
Entry: 0.1222 - 0.12232
SL: 0.1214
TP1: 0.12408 | TP2: 0.12496 | TP3: 0.12584
Wait wait wait… 🔥 $龙虾 is ready to move UP!
Entry: 0.1222 - 0.12232
SL: 0.1214
TP1: 0.12408 | TP2: 0.12496 | TP3: 0.12584
Entry: 0.1222 - 0.12232
SL: 0.1214
TP1: 0.12408 | TP2: 0.12496 | TP3: 0.12584
658
·
--
$ZRO caught my eye… 👀🔥 DOWN!
Entry: 0.98599 - 0.98698
SL: 0.98914
TP1: 0.98156 | TP2: 0.97934 | TP3: 0.97712
$ZRO caught my eye… 👀🔥 DOWN!
Entry: 0.98599 - 0.98698
SL: 0.98914
TP1: 0.98156 | TP2: 0.97934 | TP3: 0.97712
Entry: 0.98599 - 0.98698
SL: 0.98914
TP1: 0.98156 | TP2: 0.97934 | TP3: 0.97712
3
497
·
--
Heads up… 🚨 $CYS DOWN!
Entry: 0.14167 - 0.14181
SL: 0.14223
TP1: 0.14075 | TP2: 0.14028 | TP3: 0.13982
Heads up… 🚨 $CYS DOWN!
Entry: 0.14167 - 0.14181
SL: 0.14223
TP1: 0.14075 | TP2: 0.14028 | TP3: 0.13982
Entry: 0.14167 - 0.14181
SL: 0.14223
TP1: 0.14075 | TP2: 0.14028 | TP3: 0.13982
1
671
·
--
4USDT Momentum Builds, but Asset Identity Remains Unclear𝗔 𝘀𝗵𝗮𝗿𝗽 𝗺𝗼𝘃𝗲 𝘄𝗶𝘁𝗵 𝗮𝗻 𝗶𝗺𝗽𝗼𝗿𝘁𝗮𝗻𝘁 𝗾𝘂𝗲𝘀𝘁𝗶𝗼𝗻
4USDT appeared on the live RR Trader scanner with a LONG direction and a 99.93 confidence score. The scanner also recorded a 5.53% move over 15 minutes and a volume ratio of 1.52. The broader exchange ticker showed the market moving from an opening price of 0.018549 to a recorded last price of 0.022181, representing a quoted 24-hour increase of 19.58%.
That momentum makes 4USDT notable from a short-term market perspective, but the supplied data contains an important identity issue. The market data identifies the trading symbol as 4USDT, while the separate CoinGecko record identifies an asset called Chutes with the symbol SN64 and a much higher dollar price. Those records cannot safely be treated as the same token.
This analysis therefore separates confirmed 4USDT market behaviour from project information that appears to belong to Chutes and Bittensor Subnet 64. The distinction matters because a price chart can be assessed without knowing the underlying project, while claims about utility, supply or long-term value require a verified asset identity.
𝗪𝗵𝗮𝘁 𝟰𝗨𝗦𝗗𝗧 𝗶𝘀, 𝗮𝗻𝗱 𝘄𝗵𝗮𝘁 𝗿𝗲𝗺𝗮𝗶𝗻𝘀 𝘂𝗻𝘃𝗲𝗿𝗶𝗳𝗶𝗲𝗱
The scanner and exchange ticker confirm that 4USDT is a traded market with a USDT quote. They do not establish the project’s name, blockchain, founding team, protocol design or stated purpose. No reliable project description for the 4USDT symbol is included in the supplied research, and the symbol alone is not enough to identify an issuer or use case.
The separate CoinGecko metadata points to Chutes, an artificial-intelligence project classified within the Bittensor ecosystem and Bittensor Subnets category. It also includes Chutes-related references and a Subnet 64 chart. However, the same record calls the asset SN64, reports a price near 16.47 dollars and gives a market capitalisation of about 97.3 million dollars. Those figures do not match the 4USDT market trading around 0.022.
The safest interpretation is that a separate asset profile may have been attached to the 4USDT scanner result. Until a contract, exchange listing record or official project documentation confirms a direct identity match, Chutes should not be described as the verified project behind 4USDT.
That leaves the underlying project, origin and purpose of 4USDT unavailable in the supplied evidence. This is a substantial research gap because it affects how the market’s utility, development activity, community and long-term value can be evaluated.
𝗨𝘁𝗶𝗹𝗶𝘁𝘆, 𝗲𝗰𝗼𝘀𝘆𝘀𝘁𝗲𝗺 𝗮𝗻𝗱 𝘁𝗼𝗸𝗲𝗻𝗼𝗺𝗶𝗰𝘀
There is no verified information here showing what 4USDT does inside an ecosystem. The research does not provide a confirmed chain, contract address, whitepaper, governance model, staking function, fee mechanism or application that uses the token. It is therefore not possible to confirm whether 4USDT is a utility token, governance asset, synthetic instrument, leveraged product or a market symbol that has been mapped incorrectly.
The Chutes record contains an artificial-intelligence and Bittensor Subnets classification, but that information belongs to the SN64 record and is not conclusively linked to 4USDT. It would be unsupported to claim that 4USDT powers artificial-intelligence inference, secures a Bittensor subnet or pays for computing services.
The same caution applies to supply. The separate CoinGecko record lists 5,908,737.616 circulating tokens and a maximum supply of 21,000,000. It reports a market capitalisation of about 97.3 million dollars, a market-cap rank of 284 and a fully diluted valuation equal to the reported market capitalisation. Those figures describe SN64 as presented in that record; they are not verified tokenomics for 4USDT.
The research does not provide 4USDT’s circulating supply, maximum supply, unlock schedule, holder distribution or dilution profile. A reliable 4USDT market-cap analysis therefore cannot be made from the supplied data.
𝗧𝗵𝗲 𝗽𝗿𝗶𝗰𝗲 𝘀𝘁𝗿𝘂𝗰𝘁𝘂𝗿𝗲 𝗶𝘀 𝗱𝗼𝗶𝗻𝗴 𝘁𝗵𝗲 𝘁𝗮𝗹𝗸𝗶𝗻𝗴
The exchange ticker gives 4USDT a last price of 0.022181, a quoted 24-hour high of 0.023616 and a 24-hour low of 0.018529. The market opened at 0.018549, so the price moved considerably during the quoted period while remaining below the session high.
Reported quote volume was 42,976,315.743034 USDT, with 2,021,594,506 units traded and 686,220 recorded transactions. These figures show substantial activity in the market snapshot, but volume alone does not establish that the move is sustainable.
The hourly candles show an acceleration from the 0.019 area toward the 0.022 area. Early closes included 0.019458, 0.019585 and 0.020331, followed by a larger move to 0.021743. Later candles reached 0.022364 and 0.022750 before the session high of 0.023616 was recorded.
The move was not a straight climb. Price repeatedly pulled back toward the 0.0207 to 0.0214 region before moving higher. That pattern indicates a volatile advance rather than a smooth trend. The four-hour data shows a similar change in character, with price beginning near 0.017371 and later moving above 0.022. The largest four-hour volume appeared during the expansion from the 0.019 area toward 0.022364.
The latest four-hour range reached 0.023616 on the upside and 0.021088 on the downside. Both momentum and rejection are therefore visible in the supplied candles.
𝗪𝗵𝘆 𝘁𝗵𝗲 𝘀𝗰𝗮𝗻𝗻𝗲𝗿 𝘀𝗲𝗹𝗲𝗰𝘁𝗲𝗱 𝟰𝗨𝗦𝗗𝗧
The RR Trader setup is based on momentum, volume and nearby technical levels. Its recorded entry zone was 0.0225790805 to 0.0226016935, just below the scanner’s current price of 0.022613. The scanner marked support at 0.022514 and resistance at 0.023572.
Its stated stop level was 0.022432096, while the three projected objectives were 0.0229273207, 0.0230901343 and 0.0232529479. The scanner reported a 1.92 risk-reward ratio and a selection score of 185.37. It also ranked 4USDT eighth in the TOP_GAINER category, with a hot-category change of 21.66%.
These figures explain why the market was selected: price was moving quickly, volume was above its comparison baseline and the scanner identified a nearby support area. The entry band, support and current price are tightly grouped. If the support area holds, the scanner’s first objective is near 0.02293, followed by 0.02309 and 0.02325.
The stated resistance at 0.023572 is close to the recent high zone. The setup is therefore focused on whether momentum can rebuild after the initial surge. The 99.93 confidence score is a scanner output, not proof of a future result. It describes the strength of the model’s signal and does not remove market risk.
𝗕𝗶𝘁𝗰𝗼𝗶𝗻 𝗮𝗻𝗱 𝘁𝗵𝗲 𝘄𝗶𝗱𝗲𝗿 𝗯𝗮𝗰𝗸𝗱𝗿𝗼𝗽
Bitcoin’s supplied ticker showed a last price of 77,176.90, compared with an opening price of 77,232.20. Its quoted 24-hour move was negative 0.072%, with a high of 79,859.80 and a low of 76,000.30. Bitcoin was broadly flat in the snapshot but had traded through a wide range.
The recent news feed describes a more complicated environment. Reports said Bitcoin had fallen below 77,000 as traders increased the probability of a Federal Reserve rate hike. Another report mentioned faster-than-expected monthly core CPI growth. Separate coverage reported 449 million dollars of Bitcoin ETF outflows over three days.
These reports do not identify direct 4USDT catalysts, but they provide context for the broader market. Rate expectations, inflation data and ETF flows can affect risk appetite across digital assets. Smaller, more volatile markets may respond sharply when broader liquidity becomes defensive.
The news feed also reported that Bitcoin recovered toward 77,300 after leverage in Zcash unwound, while the broader CoinDesk 100 remained lower over 24 hours. The supplied evidence is therefore mixed: Bitcoin was close to flat in the ticker snapshot, but the wider market backdrop remained unsettled.
𝗡𝗼 𝘃𝗲𝗿𝗶𝗳𝗶𝗲𝗱 𝟰𝗨𝗦𝗗𝗧 𝗰𝗮𝘁𝗮𝗹𝘆𝘀𝘁 𝗵𝗮𝘀 𝗯𝗲𝗲𝗻 𝗶𝗱𝗲𝗻𝘁𝗶𝗳𝗶𝗲𝗱
The supplied news does not contain a confirmed announcement about 4USDT. There is no verified listing announcement, partnership, token upgrade, product launch, exchange promotion, governance vote or development milestone directly tied to the symbol.
The headlines focus on Bitcoin, Ethereum-related treasury companies, BNB, Chainlink, Metaplanet, ETF flows and broader market conditions. The current move therefore cannot be attributed to a known fundamental event in the supplied evidence.
Possible explanations such as market-maker activity, short covering, speculative rotation or an announcement not captured by the feed remain possibilities, but none is established as fact. The strongest confirmed driver is technical: elevated volume, a large intraday percentage move and the scanner’s identification of 4USDT as a top gainer.
Technical attention can persist while traders focus on the same recent highs and support levels, but the research does not establish how long that attention will last.
𝗟𝗲𝘃𝗲𝗹𝘀 𝘁𝗵𝗮𝘁 𝗱𝗲𝗳𝗶𝗻𝗲 𝘁𝗵𝗲 𝗶𝗺𝗺𝗲𝗱𝗶𝗮𝘁𝗲 𝗯𝗮𝘁𝘁𝗹𝗲
The first level in the scanner is 0.022514 support. It is close to the entry zone and current price, making it the clearest near-term reference for the setup. A hold above that area would preserve the scanner’s stated long structure from a technical perspective. A sustained move below it would indicate weakening relative to the preferred zone.
The scanner’s invalidation reference is 0.022432096, only slightly below support. The narrow distance means that a relatively small move could challenge the original structure.
Above the market, the scanner objectives are 0.0229273207, 0.0230901343 and 0.0232529479. The broader resistance marker is 0.023572, while the exchange’s recent high is 0.023616. A move through that region would place price above the recent high zone. Failure near 0.02325 to 0.02362 would indicate rejection of the nearby objectives, although the supplied data does not show how far such a rejection could extend.
The hourly chart also places attention on the 0.0213 to 0.0217 region because several candles traded and closed there during the advance. This is a chart observation rather than an official scanner level.
𝗥𝗶𝘀𝗸𝘀 𝗮𝗻𝗱 𝗿𝗲𝗱 𝗳𝗹𝗮𝗴𝘀
The largest red flag is identity uncertainty. Without a confirmed project profile, it is difficult to verify 4USDT’s utility, ownership, supply, contract risk or development history. The SN64 and Chutes data should not be used to fill that gap.
The second risk is the speed and range of the move. The exchange ticker showed a quoted 19.58% rise, while the scanner measured a 5.53% 15-minute move. The market also printed a 24-hour high of 0.023616 and a low of 0.018529. Such conditions can produce rapid reversals and false breakouts.
The third risk is the absence of confirmed fundamentals. The supplied research contains no verified information about the team, audits, token allocation, unlocks, treasury, holder concentration, liquidity concentration or development history of 4USDT. It also does not explain why the token should retain value beyond current trading interest.
Finally, broader market conditions can weaken a local chart. Bitcoin was near flat in the supplied snapshot, but its recent range and the news about rate-hike expectations and ETF outflows show that conditions were unsettled.
𝗧𝗵𝗲 𝗯𝗮𝗹𝗮𝗻𝗰𝗲𝗱 𝗰𝗼𝗻𝗰𝗹𝘂𝘀𝗶𝗼𝗻
The next technical question is whether 4USDT can hold above 0.022514 after the initial momentum burst. The scanner’s upside path remains focused on 0.022927, 0.023090 and 0.023253, with 0.023572 to 0.023616 representing the more significant resistance and recent-high zone.
The market should also be viewed alongside Bitcoin. If BTC remains near the 77,000 to 77,300 area without another sharp decline, 4USDT may continue to trade primarily on its own order flow. A move toward the supplied 76,000 low could add pressure to smaller markets, although the research does not establish a direct relationship.
Most importantly, the project identity requires verification before deeper fundamental conclusions can be drawn. The evidence supports describing 4USDT as a fast-moving market with strong scanner momentum, elevated volume and defined short-term levels. It does not support confident claims about the token’s mission, ecosystem, supply or long-term value.
The bullish technical case is a defended 0.0225 area, continued participation and movement toward the 0.02325 to 0.02362 band. The cautious case is weakening below 0.022432, followed by a possible return toward the earlier 0.0213 to 0.0217 structure. For now, 4USDT is an interesting market event, but its incomplete identity makes verification as important as the chart.
4USDT Momentum Builds, but Asset Identity Remains Unclear
𝗔 𝘀𝗵𝗮𝗿𝗽 𝗺𝗼𝘃𝗲 𝘄𝗶𝘁𝗵 𝗮𝗻 𝗶𝗺𝗽𝗼𝗿𝘁𝗮𝗻𝘁 𝗾𝘂𝗲𝘀𝘁𝗶𝗼𝗻
4USDT appeared on the live RR Trader scanner with a LONG direction and a 99.93 confidence score. The scanner also recorded a 5.53% move over 15 minutes and a volume ratio of 1.52. The broader exchange ticker showed the market moving from an opening price of 0.018549 to a recorded last price of 0.022181, representing a quoted 24-hour increase of 19.58%.
That momentum makes 4USDT notable from a short-term market perspective, but the supplied data contains an important identity issue. The market data identifies the trading symbol as 4USDT, while the separate CoinGecko record identifies an asset called Chutes with the symbol SN64 and a much higher dollar price. Those records cannot safely be treated as the same token.
This analysis therefore separates confirmed 4USDT market behaviour from project information that appears to belong to Chutes and Bittensor Subnet 64. The distinction matters because a price chart can be assessed without knowing the underlying project, while claims about utility, supply or long-term value require a verified asset identity.
𝗪𝗵𝗮𝘁 𝟰𝗨𝗦𝗗𝗧 𝗶𝘀, 𝗮𝗻𝗱 𝘄𝗵𝗮𝘁 𝗿𝗲𝗺𝗮𝗶𝗻𝘀 𝘂𝗻𝘃𝗲𝗿𝗶𝗳𝗶𝗲𝗱
The scanner and exchange ticker confirm that 4USDT is a traded market with a USDT quote. They do not establish the project’s name, blockchain, founding team, protocol design or stated purpose. No reliable project description for the 4USDT symbol is included in the supplied research, and the symbol alone is not enough to identify an issuer or use case.
The separate CoinGecko metadata points to Chutes, an artificial-intelligence project classified within the Bittensor ecosystem and Bittensor Subnets category. It also includes Chutes-related references and a Subnet 64 chart. However, the same record calls the asset SN64, reports a price near 16.47 dollars and gives a market capitalisation of about 97.3 million dollars. Those figures do not match the 4USDT market trading around 0.022.
The safest interpretation is that a separate asset profile may have been attached to the 4USDT scanner result. Until a contract, exchange listing record or official project documentation confirms a direct identity match, Chutes should not be described as the verified project behind 4USDT.
That leaves the underlying project, origin and purpose of 4USDT unavailable in the supplied evidence. This is a substantial research gap because it affects how the market’s utility, development activity, community and long-term value can be evaluated.
𝗨𝘁𝗶𝗹𝗶𝘁𝘆, 𝗲𝗰𝗼𝘀𝘆𝘀𝘁𝗲𝗺 𝗮𝗻𝗱 𝘁𝗼𝗸𝗲𝗻𝗼𝗺𝗶𝗰𝘀
There is no verified information here showing what 4USDT does inside an ecosystem. The research does not provide a confirmed chain, contract address, whitepaper, governance model, staking function, fee mechanism or application that uses the token. It is therefore not possible to confirm whether 4USDT is a utility token, governance asset, synthetic instrument, leveraged product or a market symbol that has been mapped incorrectly.
The Chutes record contains an artificial-intelligence and Bittensor Subnets classification, but that information belongs to the SN64 record and is not conclusively linked to 4USDT. It would be unsupported to claim that 4USDT powers artificial-intelligence inference, secures a Bittensor subnet or pays for computing services.
The same caution applies to supply. The separate CoinGecko record lists 5,908,737.616 circulating tokens and a maximum supply of 21,000,000. It reports a market capitalisation of about 97.3 million dollars, a market-cap rank of 284 and a fully diluted valuation equal to the reported market capitalisation. Those figures describe SN64 as presented in that record; they are not verified tokenomics for 4USDT.
The research does not provide 4USDT’s circulating supply, maximum supply, unlock schedule, holder distribution or dilution profile. A reliable 4USDT market-cap analysis therefore cannot be made from the supplied data.
𝗧𝗵𝗲 𝗽𝗿𝗶𝗰𝗲 𝘀𝘁𝗿𝘂𝗰𝘁𝘂𝗿𝗲 𝗶𝘀 𝗱𝗼𝗶𝗻𝗴 𝘁𝗵𝗲 𝘁𝗮𝗹𝗸𝗶𝗻𝗴
The exchange ticker gives 4USDT a last price of 0.022181, a quoted 24-hour high of 0.023616 and a 24-hour low of 0.018529. The market opened at 0.018549, so the price moved considerably during the quoted period while remaining below the session high.
Reported quote volume was 42,976,315.743034 USDT, with 2,021,594,506 units traded and 686,220 recorded transactions. These figures show substantial activity in the market snapshot, but volume alone does not establish that the move is sustainable.
The hourly candles show an acceleration from the 0.019 area toward the 0.022 area. Early closes included 0.019458, 0.019585 and 0.020331, followed by a larger move to 0.021743. Later candles reached 0.022364 and 0.022750 before the session high of 0.023616 was recorded.
The move was not a straight climb. Price repeatedly pulled back toward the 0.0207 to 0.0214 region before moving higher. That pattern indicates a volatile advance rather than a smooth trend. The four-hour data shows a similar change in character, with price beginning near 0.017371 and later moving above 0.022. The largest four-hour volume appeared during the expansion from the 0.019 area toward 0.022364.
The latest four-hour range reached 0.023616 on the upside and 0.021088 on the downside. Both momentum and rejection are therefore visible in the supplied candles.
𝗪𝗵𝘆 𝘁𝗵𝗲 𝘀𝗰𝗮𝗻𝗻𝗲𝗿 𝘀𝗲𝗹𝗲𝗰𝘁𝗲𝗱 𝟰𝗨𝗦𝗗𝗧
The RR Trader setup is based on momentum, volume and nearby technical levels. Its recorded entry zone was 0.0225790805 to 0.0226016935, just below the scanner’s current price of 0.022613. The scanner marked support at 0.022514 and resistance at 0.023572.
Its stated stop level was 0.022432096, while the three projected objectives were 0.0229273207, 0.0230901343 and 0.0232529479. The scanner reported a 1.92 risk-reward ratio and a selection score of 185.37. It also ranked 4USDT eighth in the TOP_GAINER category, with a hot-category change of 21.66%.
These figures explain why the market was selected: price was moving quickly, volume was above its comparison baseline and the scanner identified a nearby support area. The entry band, support and current price are tightly grouped. If the support area holds, the scanner’s first objective is near 0.02293, followed by 0.02309 and 0.02325.
The stated resistance at 0.023572 is close to the recent high zone. The setup is therefore focused on whether momentum can rebuild after the initial surge. The 99.93 confidence score is a scanner output, not proof of a future result. It describes the strength of the model’s signal and does not remove market risk.
𝗕𝗶𝘁𝗰𝗼𝗶𝗻 𝗮𝗻𝗱 𝘁𝗵𝗲 𝘄𝗶𝗱𝗲𝗿 𝗯𝗮𝗰𝗸𝗱𝗿𝗼𝗽
Bitcoin’s supplied ticker showed a last price of 77,176.90, compared with an opening price of 77,232.20. Its quoted 24-hour move was negative 0.072%, with a high of 79,859.80 and a low of 76,000.30. Bitcoin was broadly flat in the snapshot but had traded through a wide range.
The recent news feed describes a more complicated environment. Reports said Bitcoin had fallen below 77,000 as traders increased the probability of a Federal Reserve rate hike. Another report mentioned faster-than-expected monthly core CPI growth. Separate coverage reported 449 million dollars of Bitcoin ETF outflows over three days.
These reports do not identify direct 4USDT catalysts, but they provide context for the broader market. Rate expectations, inflation data and ETF flows can affect risk appetite across digital assets. Smaller, more volatile markets may respond sharply when broader liquidity becomes defensive.
The news feed also reported that Bitcoin recovered toward 77,300 after leverage in Zcash unwound, while the broader CoinDesk 100 remained lower over 24 hours. The supplied evidence is therefore mixed: Bitcoin was close to flat in the ticker snapshot, but the wider market backdrop remained unsettled.
𝗡𝗼 𝘃𝗲𝗿𝗶𝗳𝗶𝗲𝗱 𝟰𝗨𝗦𝗗𝗧 𝗰𝗮𝘁𝗮𝗹𝘆𝘀𝘁 𝗵𝗮𝘀 𝗯𝗲𝗲𝗻 𝗶𝗱𝗲𝗻𝘁𝗶𝗳𝗶𝗲𝗱
The supplied news does not contain a confirmed announcement about 4USDT. There is no verified listing announcement, partnership, token upgrade, product launch, exchange promotion, governance vote or development milestone directly tied to the symbol.
The headlines focus on Bitcoin, Ethereum-related treasury companies, BNB, Chainlink, Metaplanet, ETF flows and broader market conditions. The current move therefore cannot be attributed to a known fundamental event in the supplied evidence.
Possible explanations such as market-maker activity, short covering, speculative rotation or an announcement not captured by the feed remain possibilities, but none is established as fact. The strongest confirmed driver is technical: elevated volume, a large intraday percentage move and the scanner’s identification of 4USDT as a top gainer.
Technical attention can persist while traders focus on the same recent highs and support levels, but the research does not establish how long that attention will last.
𝗟𝗲𝘃𝗲𝗹𝘀 𝘁𝗵𝗮𝘁 𝗱𝗲𝗳𝗶𝗻𝗲 𝘁𝗵𝗲 𝗶𝗺𝗺𝗲𝗱𝗶𝗮𝘁𝗲 𝗯𝗮𝘁𝘁𝗹𝗲
The first level in the scanner is 0.022514 support. It is close to the entry zone and current price, making it the clearest near-term reference for the setup. A hold above that area would preserve the scanner’s stated long structure from a technical perspective. A sustained move below it would indicate weakening relative to the preferred zone.
The scanner’s invalidation reference is 0.022432096, only slightly below support. The narrow distance means that a relatively small move could challenge the original structure.
Above the market, the scanner objectives are 0.0229273207, 0.0230901343 and 0.0232529479. The broader resistance marker is 0.023572, while the exchange’s recent high is 0.023616. A move through that region would place price above the recent high zone. Failure near 0.02325 to 0.02362 would indicate rejection of the nearby objectives, although the supplied data does not show how far such a rejection could extend.
The hourly chart also places attention on the 0.0213 to 0.0217 region because several candles traded and closed there during the advance. This is a chart observation rather than an official scanner level.
𝗥𝗶𝘀𝗸𝘀 𝗮𝗻𝗱 𝗿𝗲𝗱 𝗳𝗹𝗮𝗴𝘀
The largest red flag is identity uncertainty. Without a confirmed project profile, it is difficult to verify 4USDT’s utility, ownership, supply, contract risk or development history. The SN64 and Chutes data should not be used to fill that gap.
The second risk is the speed and range of the move. The exchange ticker showed a quoted 19.58% rise, while the scanner measured a 5.53% 15-minute move. The market also printed a 24-hour high of 0.023616 and a low of 0.018529. Such conditions can produce rapid reversals and false breakouts.
The third risk is the absence of confirmed fundamentals. The supplied research contains no verified information about the team, audits, token allocation, unlocks, treasury, holder concentration, liquidity concentration or development history of 4USDT. It also does not explain why the token should retain value beyond current trading interest.
Finally, broader market conditions can weaken a local chart. Bitcoin was near flat in the supplied snapshot, but its recent range and the news about rate-hike expectations and ETF outflows show that conditions were unsettled.
𝗧𝗵𝗲 𝗯𝗮𝗹𝗮𝗻𝗰𝗲𝗱 𝗰𝗼𝗻𝗰𝗹𝘂𝘀𝗶𝗼𝗻
The next technical question is whether 4USDT can hold above 0.022514 after the initial momentum burst. The scanner’s upside path remains focused on 0.022927, 0.023090 and 0.023253, with 0.023572 to 0.023616 representing the more significant resistance and recent-high zone.
The market should also be viewed alongside Bitcoin. If BTC remains near the 77,000 to 77,300 area without another sharp decline, 4USDT may continue to trade primarily on its own order flow. A move toward the supplied 76,000 low could add pressure to smaller markets, although the research does not establish a direct relationship.
Most importantly, the project identity requires verification before deeper fundamental conclusions can be drawn. The evidence supports describing 4USDT as a fast-moving market with strong scanner momentum, elevated volume and defined short-term levels. It does not support confident claims about the token’s mission, ecosystem, supply or long-term value.
The bullish technical case is a defended 0.0225 area, continued participation and movement toward the 0.02325 to 0.02362 band. The cautious case is weakening below 0.022432, followed by a possible return toward the earlier 0.0213 to 0.0217 structure. For now, 4USDT is an interesting market event, but its incomplete identity makes verification as important as the chart.
4USDT appeared on the live RR Trader scanner with a LONG direction and a 99.93 confidence score. The scanner also recorded a 5.53% move over 15 minutes and a volume ratio of 1.52. The broader exchange ticker showed the market moving from an opening price of 0.018549 to a recorded last price of 0.022181, representing a quoted 24-hour increase of 19.58%.
That momentum makes 4USDT notable from a short-term market perspective, but the supplied data contains an important identity issue. The market data identifies the trading symbol as 4USDT, while the separate CoinGecko record identifies an asset called Chutes with the symbol SN64 and a much higher dollar price. Those records cannot safely be treated as the same token.
This analysis therefore separates confirmed 4USDT market behaviour from project information that appears to belong to Chutes and Bittensor Subnet 64. The distinction matters because a price chart can be assessed without knowing the underlying project, while claims about utility, supply or long-term value require a verified asset identity.
𝗪𝗵𝗮𝘁 𝟰𝗨𝗦𝗗𝗧 𝗶𝘀, 𝗮𝗻𝗱 𝘄𝗵𝗮𝘁 𝗿𝗲𝗺𝗮𝗶𝗻𝘀 𝘂𝗻𝘃𝗲𝗿𝗶𝗳𝗶𝗲𝗱
The scanner and exchange ticker confirm that 4USDT is a traded market with a USDT quote. They do not establish the project’s name, blockchain, founding team, protocol design or stated purpose. No reliable project description for the 4USDT symbol is included in the supplied research, and the symbol alone is not enough to identify an issuer or use case.
The separate CoinGecko metadata points to Chutes, an artificial-intelligence project classified within the Bittensor ecosystem and Bittensor Subnets category. It also includes Chutes-related references and a Subnet 64 chart. However, the same record calls the asset SN64, reports a price near 16.47 dollars and gives a market capitalisation of about 97.3 million dollars. Those figures do not match the 4USDT market trading around 0.022.
The safest interpretation is that a separate asset profile may have been attached to the 4USDT scanner result. Until a contract, exchange listing record or official project documentation confirms a direct identity match, Chutes should not be described as the verified project behind 4USDT.
That leaves the underlying project, origin and purpose of 4USDT unavailable in the supplied evidence. This is a substantial research gap because it affects how the market’s utility, development activity, community and long-term value can be evaluated.
𝗨𝘁𝗶𝗹𝗶𝘁𝘆, 𝗲𝗰𝗼𝘀𝘆𝘀𝘁𝗲𝗺 𝗮𝗻𝗱 𝘁𝗼𝗸𝗲𝗻𝗼𝗺𝗶𝗰𝘀
There is no verified information here showing what 4USDT does inside an ecosystem. The research does not provide a confirmed chain, contract address, whitepaper, governance model, staking function, fee mechanism or application that uses the token. It is therefore not possible to confirm whether 4USDT is a utility token, governance asset, synthetic instrument, leveraged product or a market symbol that has been mapped incorrectly.
The Chutes record contains an artificial-intelligence and Bittensor Subnets classification, but that information belongs to the SN64 record and is not conclusively linked to 4USDT. It would be unsupported to claim that 4USDT powers artificial-intelligence inference, secures a Bittensor subnet or pays for computing services.
The same caution applies to supply. The separate CoinGecko record lists 5,908,737.616 circulating tokens and a maximum supply of 21,000,000. It reports a market capitalisation of about 97.3 million dollars, a market-cap rank of 284 and a fully diluted valuation equal to the reported market capitalisation. Those figures describe SN64 as presented in that record; they are not verified tokenomics for 4USDT.
The research does not provide 4USDT’s circulating supply, maximum supply, unlock schedule, holder distribution or dilution profile. A reliable 4USDT market-cap analysis therefore cannot be made from the supplied data.
𝗧𝗵𝗲 𝗽𝗿𝗶𝗰𝗲 𝘀𝘁𝗿𝘂𝗰𝘁𝘂𝗿𝗲 𝗶𝘀 𝗱𝗼𝗶𝗻𝗴 𝘁𝗵𝗲 𝘁𝗮𝗹𝗸𝗶𝗻𝗴
The exchange ticker gives 4USDT a last price of 0.022181, a quoted 24-hour high of 0.023616 and a 24-hour low of 0.018529. The market opened at 0.018549, so the price moved considerably during the quoted period while remaining below the session high.
Reported quote volume was 42,976,315.743034 USDT, with 2,021,594,506 units traded and 686,220 recorded transactions. These figures show substantial activity in the market snapshot, but volume alone does not establish that the move is sustainable.
The hourly candles show an acceleration from the 0.019 area toward the 0.022 area. Early closes included 0.019458, 0.019585 and 0.020331, followed by a larger move to 0.021743. Later candles reached 0.022364 and 0.022750 before the session high of 0.023616 was recorded.
The move was not a straight climb. Price repeatedly pulled back toward the 0.0207 to 0.0214 region before moving higher. That pattern indicates a volatile advance rather than a smooth trend. The four-hour data shows a similar change in character, with price beginning near 0.017371 and later moving above 0.022. The largest four-hour volume appeared during the expansion from the 0.019 area toward 0.022364.
The latest four-hour range reached 0.023616 on the upside and 0.021088 on the downside. Both momentum and rejection are therefore visible in the supplied candles.
𝗪𝗵𝘆 𝘁𝗵𝗲 𝘀𝗰𝗮𝗻𝗻𝗲𝗿 𝘀𝗲𝗹𝗲𝗰𝘁𝗲𝗱 𝟰𝗨𝗦𝗗𝗧
The RR Trader setup is based on momentum, volume and nearby technical levels. Its recorded entry zone was 0.0225790805 to 0.0226016935, just below the scanner’s current price of 0.022613. The scanner marked support at 0.022514 and resistance at 0.023572.
Its stated stop level was 0.022432096, while the three projected objectives were 0.0229273207, 0.0230901343 and 0.0232529479. The scanner reported a 1.92 risk-reward ratio and a selection score of 185.37. It also ranked 4USDT eighth in the TOP_GAINER category, with a hot-category change of 21.66%.
These figures explain why the market was selected: price was moving quickly, volume was above its comparison baseline and the scanner identified a nearby support area. The entry band, support and current price are tightly grouped. If the support area holds, the scanner’s first objective is near 0.02293, followed by 0.02309 and 0.02325.
The stated resistance at 0.023572 is close to the recent high zone. The setup is therefore focused on whether momentum can rebuild after the initial surge. The 99.93 confidence score is a scanner output, not proof of a future result. It describes the strength of the model’s signal and does not remove market risk.
𝗕𝗶𝘁𝗰𝗼𝗶𝗻 𝗮𝗻𝗱 𝘁𝗵𝗲 𝘄𝗶𝗱𝗲𝗿 𝗯𝗮𝗰𝗸𝗱𝗿𝗼𝗽
Bitcoin’s supplied ticker showed a last price of 77,176.90, compared with an opening price of 77,232.20. Its quoted 24-hour move was negative 0.072%, with a high of 79,859.80 and a low of 76,000.30. Bitcoin was broadly flat in the snapshot but had traded through a wide range.
The recent news feed describes a more complicated environment. Reports said Bitcoin had fallen below 77,000 as traders increased the probability of a Federal Reserve rate hike. Another report mentioned faster-than-expected monthly core CPI growth. Separate coverage reported 449 million dollars of Bitcoin ETF outflows over three days.
These reports do not identify direct 4USDT catalysts, but they provide context for the broader market. Rate expectations, inflation data and ETF flows can affect risk appetite across digital assets. Smaller, more volatile markets may respond sharply when broader liquidity becomes defensive.
The news feed also reported that Bitcoin recovered toward 77,300 after leverage in Zcash unwound, while the broader CoinDesk 100 remained lower over 24 hours. The supplied evidence is therefore mixed: Bitcoin was close to flat in the ticker snapshot, but the wider market backdrop remained unsettled.
𝗡𝗼 𝘃𝗲𝗿𝗶𝗳𝗶𝗲𝗱 𝟰𝗨𝗦𝗗𝗧 𝗰𝗮𝘁𝗮𝗹𝘆𝘀𝘁 𝗵𝗮𝘀 𝗯𝗲𝗲𝗻 𝗶𝗱𝗲𝗻𝘁𝗶𝗳𝗶𝗲𝗱
The supplied news does not contain a confirmed announcement about 4USDT. There is no verified listing announcement, partnership, token upgrade, product launch, exchange promotion, governance vote or development milestone directly tied to the symbol.
The headlines focus on Bitcoin, Ethereum-related treasury companies, BNB, Chainlink, Metaplanet, ETF flows and broader market conditions. The current move therefore cannot be attributed to a known fundamental event in the supplied evidence.
Possible explanations such as market-maker activity, short covering, speculative rotation or an announcement not captured by the feed remain possibilities, but none is established as fact. The strongest confirmed driver is technical: elevated volume, a large intraday percentage move and the scanner’s identification of 4USDT as a top gainer.
Technical attention can persist while traders focus on the same recent highs and support levels, but the research does not establish how long that attention will last.
𝗟𝗲𝘃𝗲𝗹𝘀 𝘁𝗵𝗮𝘁 𝗱𝗲𝗳𝗶𝗻𝗲 𝘁𝗵𝗲 𝗶𝗺𝗺𝗲𝗱𝗶𝗮𝘁𝗲 𝗯𝗮𝘁𝘁𝗹𝗲
The first level in the scanner is 0.022514 support. It is close to the entry zone and current price, making it the clearest near-term reference for the setup. A hold above that area would preserve the scanner’s stated long structure from a technical perspective. A sustained move below it would indicate weakening relative to the preferred zone.
The scanner’s invalidation reference is 0.022432096, only slightly below support. The narrow distance means that a relatively small move could challenge the original structure.
Above the market, the scanner objectives are 0.0229273207, 0.0230901343 and 0.0232529479. The broader resistance marker is 0.023572, while the exchange’s recent high is 0.023616. A move through that region would place price above the recent high zone. Failure near 0.02325 to 0.02362 would indicate rejection of the nearby objectives, although the supplied data does not show how far such a rejection could extend.
The hourly chart also places attention on the 0.0213 to 0.0217 region because several candles traded and closed there during the advance. This is a chart observation rather than an official scanner level.
𝗥𝗶𝘀𝗸𝘀 𝗮𝗻𝗱 𝗿𝗲𝗱 𝗳𝗹𝗮𝗴𝘀
The largest red flag is identity uncertainty. Without a confirmed project profile, it is difficult to verify 4USDT’s utility, ownership, supply, contract risk or development history. The SN64 and Chutes data should not be used to fill that gap.
The second risk is the speed and range of the move. The exchange ticker showed a quoted 19.58% rise, while the scanner measured a 5.53% 15-minute move. The market also printed a 24-hour high of 0.023616 and a low of 0.018529. Such conditions can produce rapid reversals and false breakouts.
The third risk is the absence of confirmed fundamentals. The supplied research contains no verified information about the team, audits, token allocation, unlocks, treasury, holder concentration, liquidity concentration or development history of 4USDT. It also does not explain why the token should retain value beyond current trading interest.
Finally, broader market conditions can weaken a local chart. Bitcoin was near flat in the supplied snapshot, but its recent range and the news about rate-hike expectations and ETF outflows show that conditions were unsettled.
𝗧𝗵𝗲 𝗯𝗮𝗹𝗮𝗻𝗰𝗲𝗱 𝗰𝗼𝗻𝗰𝗹𝘂𝘀𝗶𝗼𝗻
The next technical question is whether 4USDT can hold above 0.022514 after the initial momentum burst. The scanner’s upside path remains focused on 0.022927, 0.023090 and 0.023253, with 0.023572 to 0.023616 representing the more significant resistance and recent-high zone.
The market should also be viewed alongside Bitcoin. If BTC remains near the 77,000 to 77,300 area without another sharp decline, 4USDT may continue to trade primarily on its own order flow. A move toward the supplied 76,000 low could add pressure to smaller markets, although the research does not establish a direct relationship.
Most importantly, the project identity requires verification before deeper fundamental conclusions can be drawn. The evidence supports describing 4USDT as a fast-moving market with strong scanner momentum, elevated volume and defined short-term levels. It does not support confident claims about the token’s mission, ecosystem, supply or long-term value.
The bullish technical case is a defended 0.0225 area, continued participation and movement toward the 0.02325 to 0.02362 band. The cautious case is weakening below 0.022432, followed by a possible return toward the earlier 0.0213 to 0.0217 structure. For now, 4USDT is an interesting market event, but its incomplete identity makes verification as important as the chart.
243
·
--
Wait wait wait… 🚨 $4 UP!
Entry: 0.022552 - 0.022575
SL: 0.022405
TP1: 0.0229 | TP2: 0.023063 | TP3: 0.023225
Wait wait wait… 🚨 $4 UP!
Entry: 0.022552 - 0.022575
SL: 0.022405
TP1: 0.0229 | TP2: 0.023063 | TP3: 0.023225
Entry: 0.022552 - 0.022575
SL: 0.022405
TP1: 0.0229 | TP2: 0.023063 | TP3: 0.023225
435
·
--
$ARK is moving… 🚨🔥 DOWN!
Entry: 0.12236 - 0.12248
SL: 0.12315
TP1: 0.12083 | TP2: 0.12007 | TP3: 0.11931
$ARK is moving… 🚨🔥 DOWN!
Entry: 0.12236 - 0.12248
SL: 0.12315
TP1: 0.12083 | TP2: 0.12007 | TP3: 0.11931
Entry: 0.12236 - 0.12248
SL: 0.12315
TP1: 0.12083 | TP2: 0.12007 | TP3: 0.11931
1
341
·
--
Guys, watch $BLESS closely… 🔥 DOWN!
Entry: 0.00841320 - 0.00842161
SL: 0.00844185
TP1: 0.00836414 | TP2: 0.00833961 | TP3: 0.00831508
Guys, watch $BLESS closely… 🔥 DOWN!
Entry: 0.00841320 - 0.00842161
SL: 0.00844185
TP1: 0.00836414 | TP2: 0.00833961 | TP3: 0.00831508
Entry: 0.00841320 - 0.00842161
SL: 0.00844185
TP1: 0.00836414 | TP2: 0.00833961 | TP3: 0.00831508
512
·
--
$KAT is moving… 🚨🔥 DOWN!
Entry: 0.00480540 - 0.00481020
SL: 0.00482274
TP1: 0.00476988 | TP2: 0.00475212 | TP3: 0.00473435
$KAT is moving… 🚨🔥 DOWN!
Entry: 0.00480540 - 0.00481020
SL: 0.00482274
TP1: 0.00476988 | TP2: 0.00475212 | TP3: 0.00473435
Entry: 0.00480540 - 0.00481020
SL: 0.00482274
TP1: 0.00476988 | TP2: 0.00475212 | TP3: 0.00473435
446
·
--
My community, look at $ETH … ✅ DOWN!
Entry: 2513.25 - 2515.76
SL: 2521.21
TP1: 2501.94 | TP2: 2496.29 | TP3: 2490.64
My community, look at $ETH … ✅ DOWN!
Entry: 2513.25 - 2515.76
SL: 2521.21
TP1: 2501.94 | TP2: 2496.29 | TP3: 2490.64
Entry: 2513.25 - 2515.76
SL: 2521.21
TP1: 2501.94 | TP2: 2496.29 | TP3: 2490.64
1
603
·
--
Wait… $4 is getting serious! ⚡ UP!
Entry: 0.022565 - 0.022588
SL: 0.022418
TP1: 0.022913 | TP2: 0.023076 | TP3: 0.023239
Wait… $4 is getting serious! ⚡ UP!
Entry: 0.022565 - 0.022588
SL: 0.022418
TP1: 0.022913 | TP2: 0.023076 | TP3: 0.023239
Entry: 0.022565 - 0.022588
SL: 0.022418
TP1: 0.022913 | TP2: 0.023076 | TP3: 0.023239
522
·
--
My community, look at $YB … ✅ DOWN!
Entry: 0.086403 - 0.08649
SL: 0.086759
TP1: 0.085859 | TP2: 0.085587 | TP3: 0.085315
My community, look at $YB … ✅ DOWN!
Entry: 0.086403 - 0.08649
SL: 0.086759
TP1: 0.085859 | TP2: 0.085587 | TP3: 0.085315
Entry: 0.086403 - 0.08649
SL: 0.086759
TP1: 0.085859 | TP2: 0.085587 | TP3: 0.085315
363
·
--
This $GPS setup is hot… ‼️🔥 DOWN!
Entry: 0.011093 - 0.011104
SL: 0.011177
TP1: 0.010959 | TP2: 0.010892 | TP3: 0.010825
This $GPS setup is hot… ‼️🔥 DOWN!
Entry: 0.011093 - 0.011104
SL: 0.011177
TP1: 0.010959 | TP2: 0.010892 | TP3: 0.010825
Entry: 0.011093 - 0.011104
SL: 0.011177
TP1: 0.010959 | TP2: 0.010892 | TP3: 0.010825
2
473
Log in to explore more content
Join global crypto users on Binance Square
⚡️ Get latest and useful information about crypto.
💬 Trusted by the world’s largest crypto exchange.
👍 Discover real insights from verified creators.
Email / Phone number
Trending Topics
USBankCompletesCrossBorderPaymentPilotOnStellar
8,324 views
287 Discussing
#usbankcompletescrossborderpaymentpilotonstellar BIG MOVE IN DIGITAL PAYMENTS! 🌍💸
U.S. Bank has completed a cross-border payment pilot on the Stellar network, highlighting how blockchain technology could transform international payments.
⚡ Faster settlement
🌎 Global reach
💰 Potentially lower costs
🔗 Blockchain-powered infrastructure
This is another strong signal that traditional financial institutions are exploring public blockchain networks for real-world payment use cases.#USBankCompletesCrossBorderPaymentPilotOnStellar $MXL.US
$BTC
$ARB
Crypto_With_Kinza
·0 Likes
·1k views
NvidiaInTalksToInvestUpTo$10BInAnthropicIPO
482 views
30 Discussing
EtherRalliesAsBearishBetsLiquidate
19,534 views
502 Discussing