
F I N K Y
14.3k Posts

F I N K Y
 Square Verified+
Report
Block User
Building wealth, one sat at a time | Sharing my crypto journey...
Open Trade
High-Frequency Trader
1.2 Years
24 Following
39.2K+ Followers
38.0K+ Liked
Posts
Portfolio
All
Quotes
Live
·
--
Bullish
🚨 The Gainers Board Is Heating Up!🤑🤑🤑
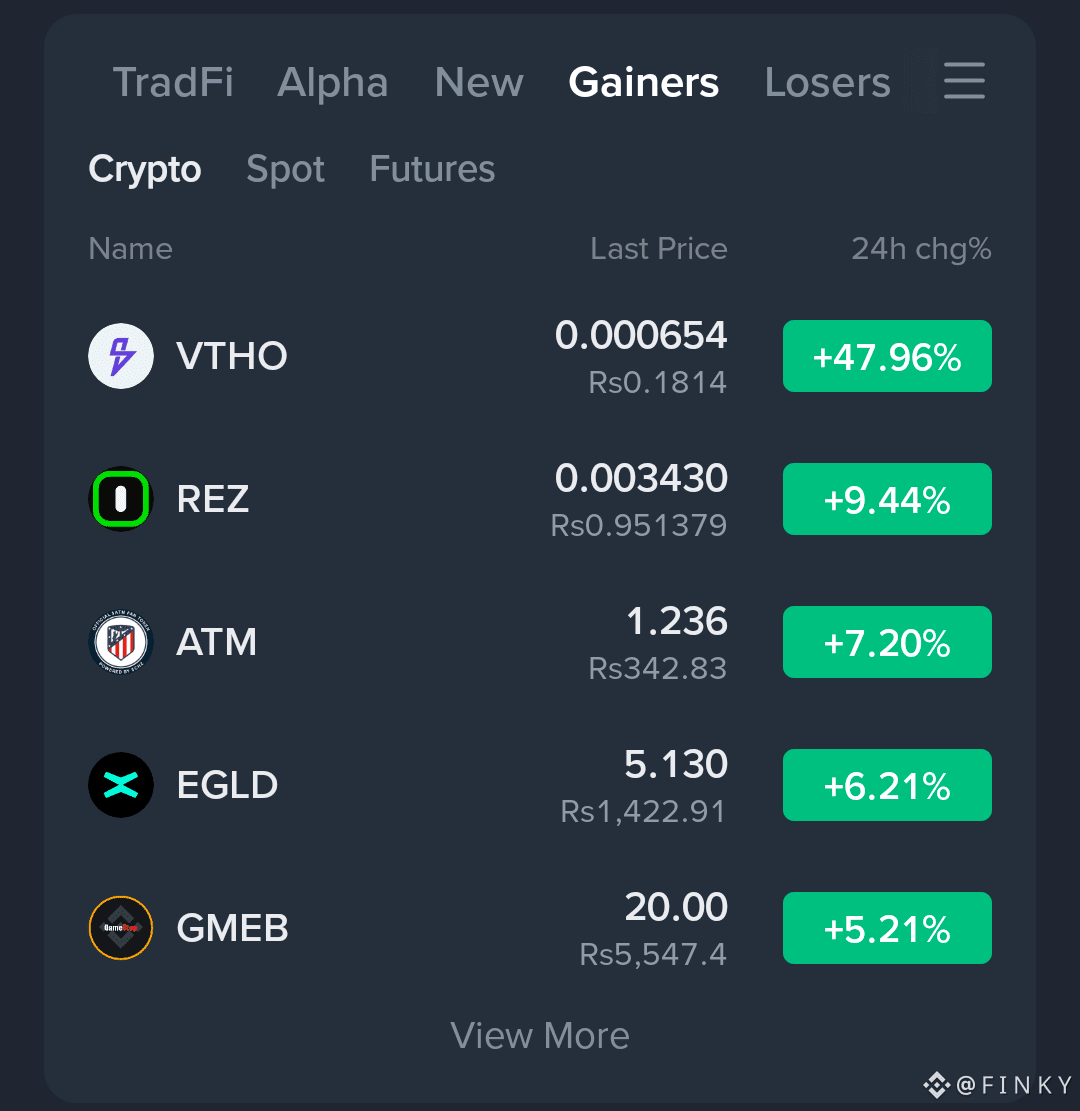
The crypto market is showing some serious movement right now, and the Gainers list is grabbing attention. Several tokens are posting strong 24-hour gains, with one name clearly standing above the rest.
is leading the move with an impressive +47.96% in the last 24 hours. Its displayed price is 0.000654, around Rs0.1814.
But the action doesn’t stop there.
$REZ is also moving strongly, up +9.44%, with the displayed price at 0.003430 or around Rs0.951379.
$ATM has gained +7.20%, trading around 1.236, which is approximately Rs342.83.
Then we have , climbing +6.21% to around 5.130, equal to roughly Rs1,422.91.
And $GMEB is also in the green, showing a +5.21% move with a displayed price of 20.00, around Rs5,547.4.
The biggest headline here is clearly $VTHO, with nearly a 48% daily jump. Moves like this can quickly attract traders and fresh attention, but after a sharp rally, volatility can also increase.
For now, these are the names standing out on the displayed Gainers board:
— +47.96%
$REZ — +9.44%
$ATM — +7.20%
$EGLD — +6.21%
$GMEB — +5.21%
The market is moving fast. Keep an eye on volume, price structure, and whether these gains continue to hold rather than chasing a sudden spike.
Which one are you watching most closely?
{spot}(ATMUSDT)
{spot}(VTHOUSDT)
{spot}(EGLDUSDT)
🚨 The Gainers Board Is Heating Up!🤑🤑🤑
The crypto market is showing some serious movement right now, and the Gainers list is grabbing attention. Several tokens are posting strong 24-hour gains, with one name clearly standing above the rest.
is leading the move with an impressive +47.96% in the last 24 hours. Its displayed price is 0.000654, around Rs0.1814.
But the action doesn’t stop there.
$REZ is also moving strongly, up +9.44%, with the displayed price at 0.003430 or around Rs0.951379.
$ATM has gained +7.20%, trading around 1.236, which is approximately Rs342.83.
Then we have , climbing +6.21% to around 5.130, equal to roughly Rs1,422.91.
And $GMEB is also in the green, showing a +5.21% move with a displayed price of 20.00, around Rs5,547.4.
The biggest headline here is clearly $VTHO, with nearly a 48% daily jump. Moves like this can quickly attract traders and fresh attention, but after a sharp rally, volatility can also increase.
For now, these are the names standing out on the displayed Gainers board:
— +47.96%
$REZ — +9.44%
$ATM — +7.20%
$EGLD — +6.21%
$GMEB — +5.21%
The market is moving fast. Keep an eye on volume, price structure, and whether these gains continue to hold rather than chasing a sudden spike.
Which one are you watching most closely?
The crypto market is showing some serious movement right now, and the Gainers list is grabbing attention. Several tokens are posting strong 24-hour gains, with one name clearly standing above the rest.
is leading the move with an impressive +47.96% in the last 24 hours. Its displayed price is 0.000654, around Rs0.1814.
But the action doesn’t stop there.
$REZ is also moving strongly, up +9.44%, with the displayed price at 0.003430 or around Rs0.951379.
$ATM has gained +7.20%, trading around 1.236, which is approximately Rs342.83.
Then we have , climbing +6.21% to around 5.130, equal to roughly Rs1,422.91.
And $GMEB is also in the green, showing a +5.21% move with a displayed price of 20.00, around Rs5,547.4.
The biggest headline here is clearly $VTHO, with nearly a 48% daily jump. Moves like this can quickly attract traders and fresh attention, but after a sharp rally, volatility can also increase.
For now, these are the names standing out on the displayed Gainers board:
— +47.96%
$REZ — +9.44%
$ATM — +7.20%
$EGLD — +6.21%
$GMEB — +5.21%
The market is moving fast. Keep an eye on volume, price structure, and whether these gains continue to hold rather than chasing a sudden spike.
Which one are you watching most closely?

224
·
--
Bullish
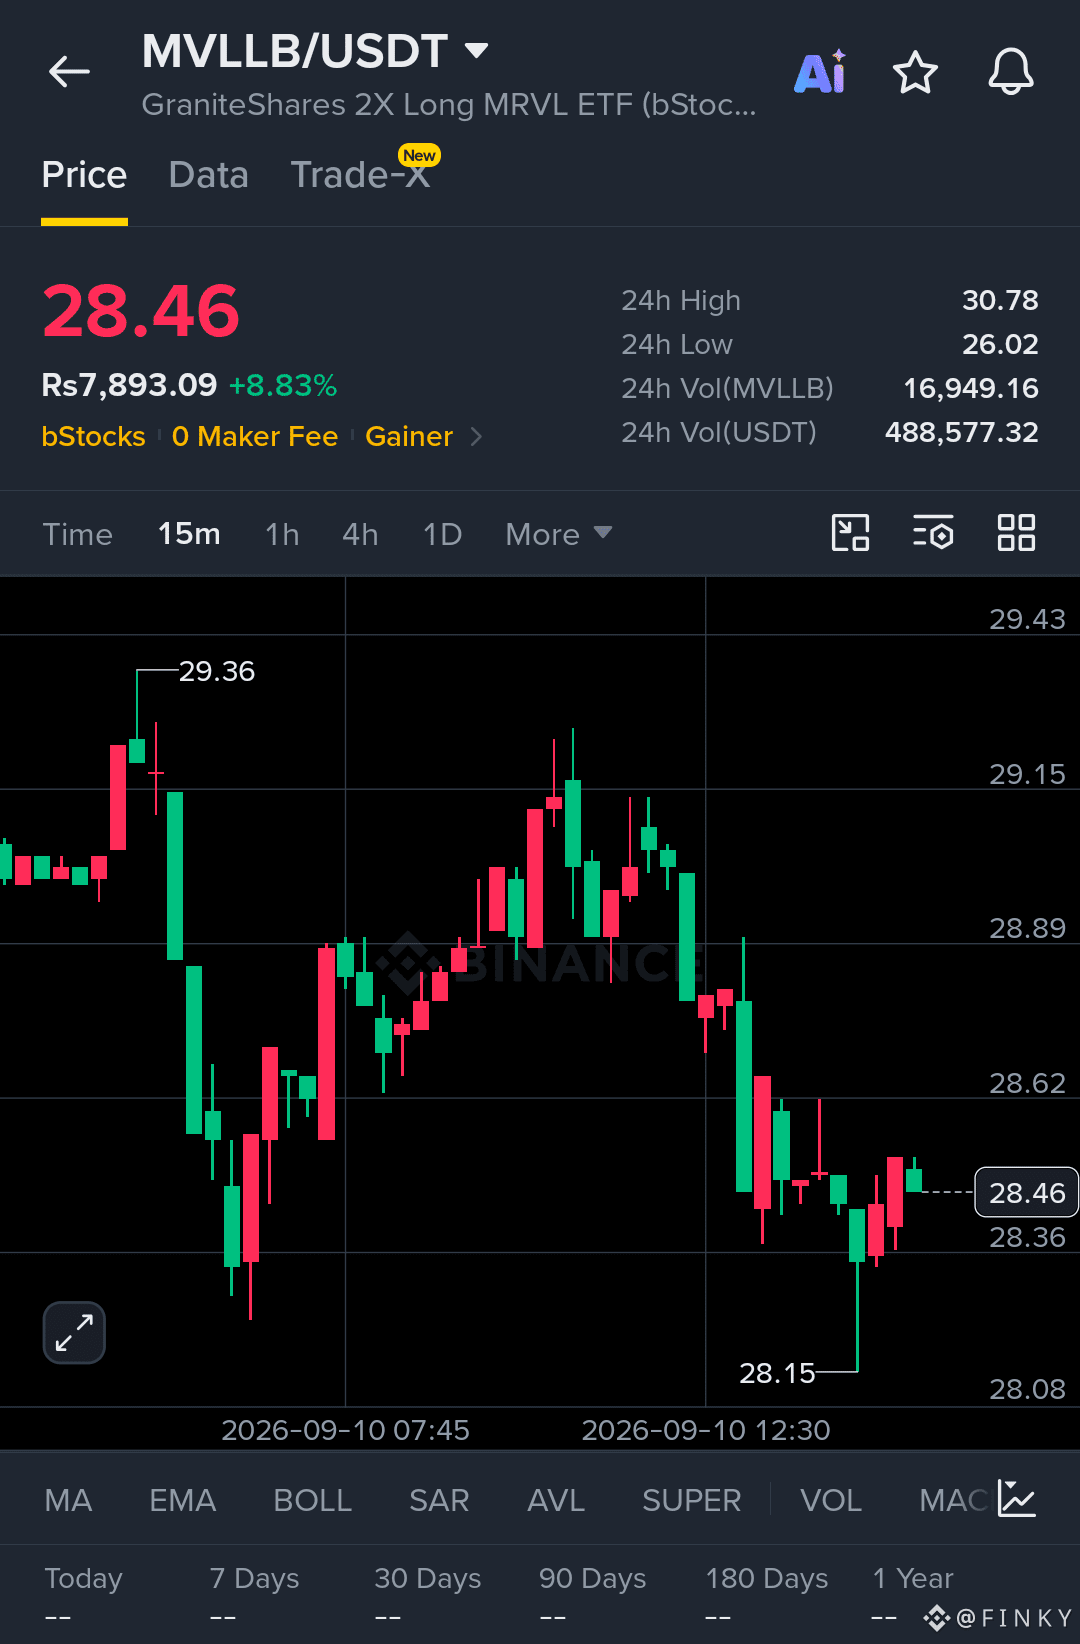
$MVLLB is showing strong bullish momentum. Buyers remain in control as the structure continues to hold.
Ep
28.35 - 28.50
TP
28.80
29.15
29.35
Sl
28.08
Liquidity was swept around 28.15 and price reacted aggressively. Buyers reclaimed the structure, and consolidation above 28.36 keeps continuation in play.
The 15-minute chart shows price recovering from the 28.15 liquidity sweep and holding near 28.46. A sustained move above 28.62 could open the way toward 28.80 and the previous high around 29.36.
Let's go $MVLLB
{spot}(MVLLBUSDT)
#AppleDebutsFoldablePhone #IranSaysReadyToEscalateWarWithUS #US10YTreasuryYieldHitsHighestSinceNov2023 #USADPWeeklyEmploymentRises12000 #USADPWeeklyEmploymentRises12000
$MVLLB is showing strong bullish momentum. Buyers remain in control as the structure continues to hold.
Ep
28.35 - 28.50
TP
28.80
29.15
29.35
Sl
28.08
Liquidity was swept around 28.15 and price reacted aggressively. Buyers reclaimed the structure, and consolidation above 28.36 keeps continuation in play.
The 15-minute chart shows price recovering from the 28.15 liquidity sweep and holding near 28.46. A sustained move above 28.62 could open the way toward 28.80 and the previous high around 29.36.
Let's go $MVLLB
#AppleDebutsFoldablePhone #IranSaysReadyToEscalateWarWithUS #US10YTreasuryYieldHitsHighestSinceNov2023 #USADPWeeklyEmploymentRises12000 #USADPWeeklyEmploymentRises12000
Ep
28.35 - 28.50
TP
28.80
29.15
29.35
Sl
28.08
Liquidity was swept around 28.15 and price reacted aggressively. Buyers reclaimed the structure, and consolidation above 28.36 keeps continuation in play.
The 15-minute chart shows price recovering from the 28.15 liquidity sweep and holding near 28.46. A sustained move above 28.62 could open the way toward 28.80 and the previous high around 29.36.
Let's go $MVLLB
#AppleDebutsFoldablePhone #IranSaysReadyToEscalateWarWithUS #US10YTreasuryYieldHitsHighestSinceNov2023 #USADPWeeklyEmploymentRises12000 #USADPWeeklyEmploymentRises12000
1
51
·
--
Bullish
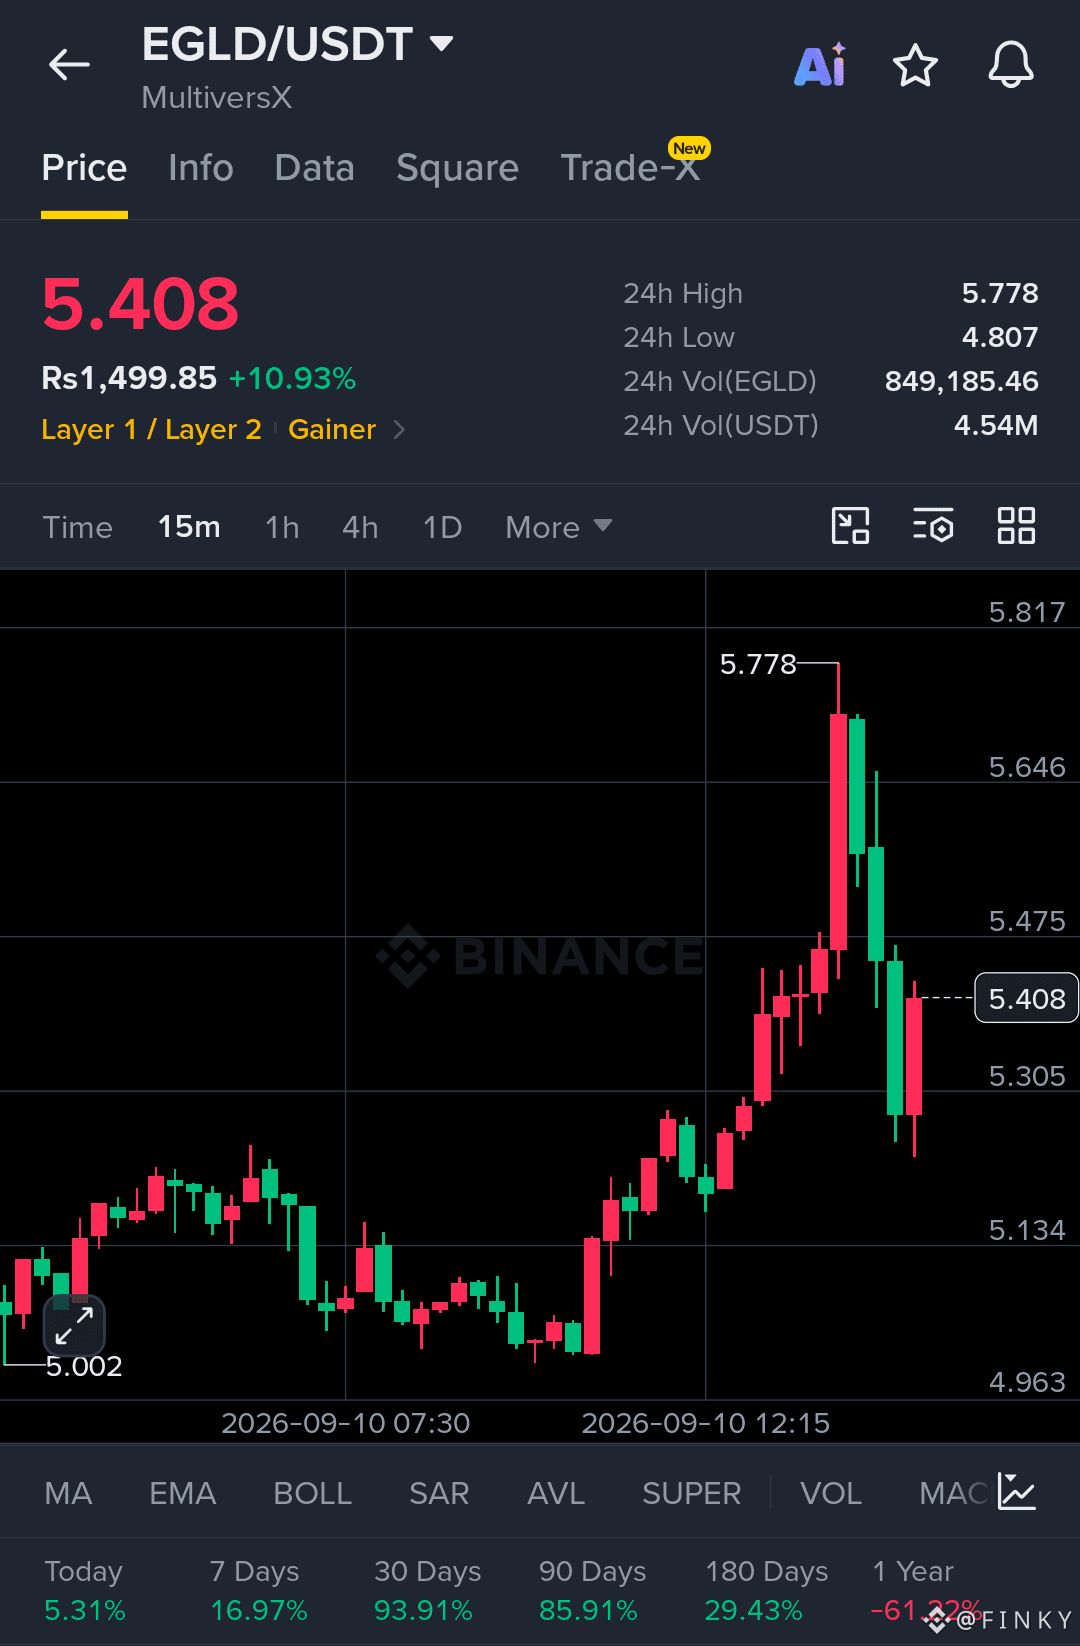
$EGLD is showing strong bullish momentum. Buyers remain in control as the structure continues to hold.
Ep
5.35 - 5.42
TP
5.65
5.78
6.00
Sl
5.20
Liquidity was swept around 5.00 and price reacted aggressively. Buyers reclaimed the structure, and consolidation above 5.305 keeps continuation in play.
The 15-minute chart shows a strong recovery from the lower zone, followed by a sharp push toward 5.778. After the rejection from the recent high, price is holding around 5.408 instead of fully breaking down. If the 5.305 area continues to act as support, another attempt toward the recent high and higher targets remains possible.
Let's go $EGLD
{spot}(EGLDUSDT)
#AppleDebutsFoldablePhone #TSMCAugustRevenueUp53.3%YoY #EUExtendsCentralContactPointToCASPs #US10YTreasuryYieldHitsHighestSinceNov2023 #BankOfAmericaGroupPilotsUSBDCStablecoin
$EGLD is showing strong bullish momentum. Buyers remain in control as the structure continues to hold.
Ep
5.35 - 5.42
TP
5.65
5.78
6.00
Sl
5.20
Liquidity was swept around 5.00 and price reacted aggressively. Buyers reclaimed the structure, and consolidation above 5.305 keeps continuation in play.
The 15-minute chart shows a strong recovery from the lower zone, followed by a sharp push toward 5.778. After the rejection from the recent high, price is holding around 5.408 instead of fully breaking down. If the 5.305 area continues to act as support, another attempt toward the recent high and higher targets remains possible.
Let's go $EGLD
#AppleDebutsFoldablePhone #TSMCAugustRevenueUp53.3%YoY #EUExtendsCentralContactPointToCASPs #US10YTreasuryYieldHitsHighestSinceNov2023 #BankOfAmericaGroupPilotsUSBDCStablecoin
Ep
5.35 - 5.42
TP
5.65
5.78
6.00
Sl
5.20
Liquidity was swept around 5.00 and price reacted aggressively. Buyers reclaimed the structure, and consolidation above 5.305 keeps continuation in play.
The 15-minute chart shows a strong recovery from the lower zone, followed by a sharp push toward 5.778. After the rejection from the recent high, price is holding around 5.408 instead of fully breaking down. If the 5.305 area continues to act as support, another attempt toward the recent high and higher targets remains possible.
Let's go $EGLD
#AppleDebutsFoldablePhone #TSMCAugustRevenueUp53.3%YoY #EUExtendsCentralContactPointToCASPs #US10YTreasuryYieldHitsHighestSinceNov2023 #BankOfAmericaGroupPilotsUSBDCStablecoin
100
·
--
Article
$FF: The Bigger Story Behind Falcon Finance and Its Push to Build the Next Generation of On-ChainThere is a lot more happening around $FF than a simple token launch or another DeFi narrative.
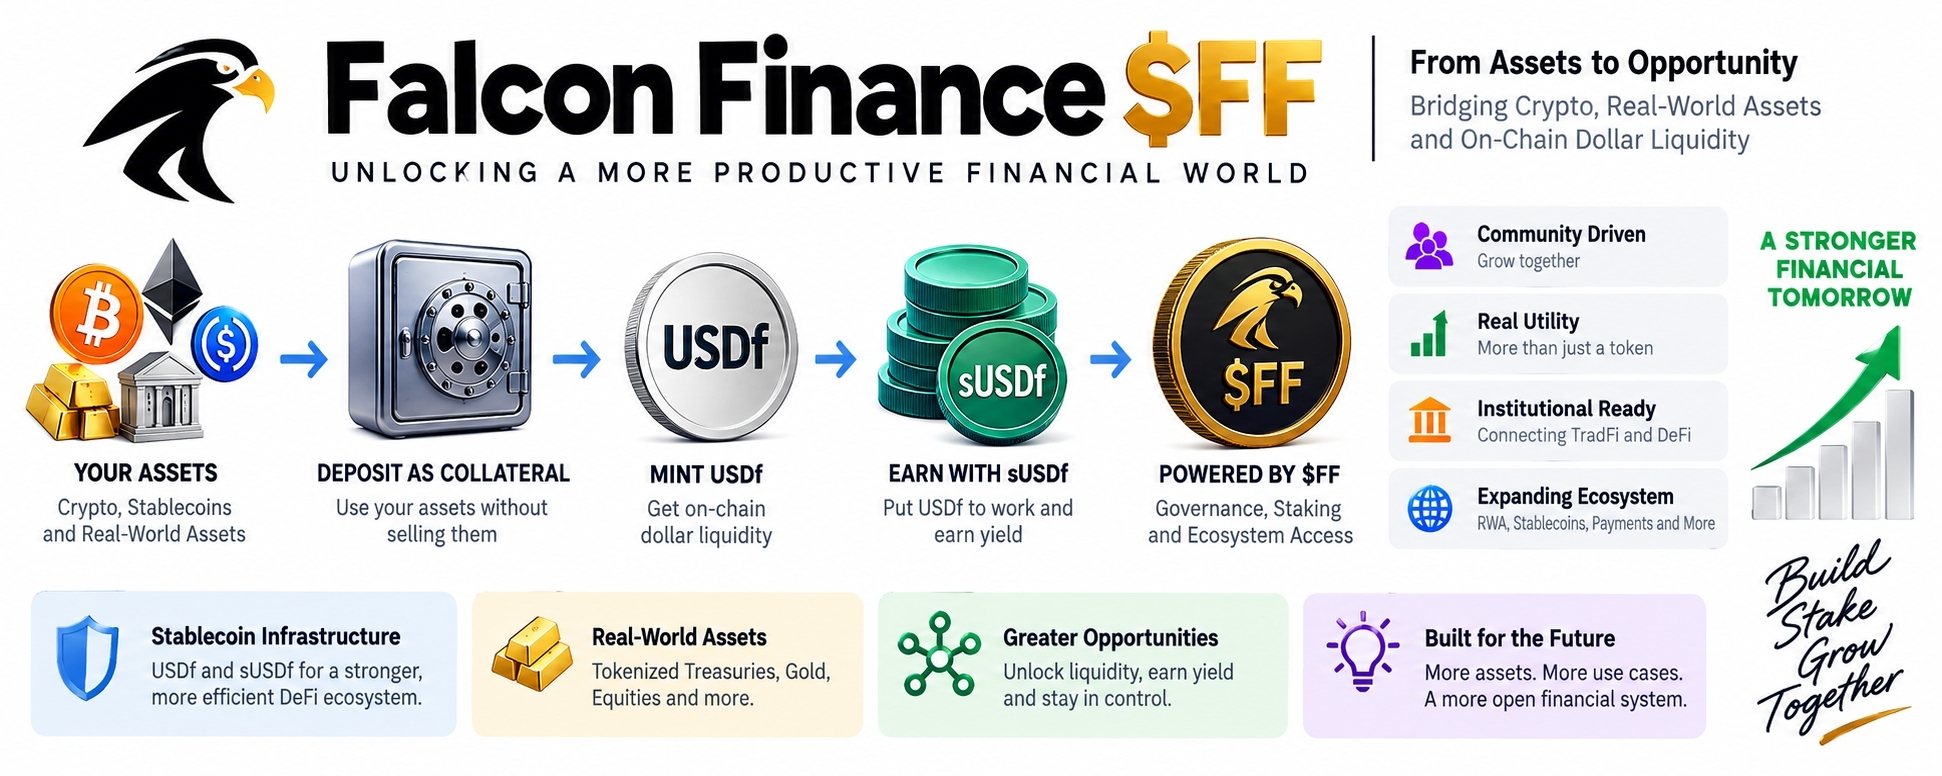
Falcon Finance is trying to build something much bigger: an infrastructure layer where different types of liquid assets can be used to unlock dollar-denominated liquidity on-chain.
That includes crypto assets, stablecoins and tokenized real-world assets.
At the center of this system are USDf, Falcon's synthetic dollar, sUSDf, its yield-bearing version, and $FF, the native utility and governance token that connects users to the wider ecosystem.
What makes the story interesting is that Falcon isn't only targeting crypto-native traders. Its roadmap increasingly focuses on tokenized assets, institutional users, regulated infrastructure and real-world financial products.
That gives $FF exposure to several of the biggest themes developing across the crypto industry at the same time.
But there is also an important question:
Can Falcon turn this ambitious vision into sustainable, long-term demand for $FF?
That is where the real story begins.
What Is Falcon Finance Actually Building?
The easiest way to understand Falcon Finance is to think about the problem it is trying to solve.
Crypto users may hold assets that have significant value, but those assets are not always easy to turn into productive dollar liquidity without selling them.
Falcon's model attempts to change that.
Eligible assets can be deposited as collateral, and the protocol can use that collateral to create USDf, its synthetic dollar.
According to Falcon's documentation, supported collateral can include assets such as USDC, USDT, FDUSD, BTC and ETH, with different collateralization requirements depending on the asset.
The bigger vision extends beyond crypto.
Falcon has been building toward a system where tokenized real-world assets can also become part of this collateral infrastructure.
That means the project is effectively trying to connect three worlds:
Crypto assets + tokenized real-world assets + on-chain dollar liquidity.
And that is what makes the project worth watching.
---
USDf Is the Engine Behind the Ecosystem
To understand $FF, you need to understand USDf first.
USDf is designed as an overcollateralized synthetic dollar.
Users provide eligible assets as collateral and receive USDf in return. For non-stablecoin assets such as BTC and ETH, Falcon applies an overcollateralization ratio to provide a buffer against market volatility.
The idea is relatively simple:
You don't necessarily need to sell your asset to access dollar liquidity.
Instead, you can use the asset as collateral.
This creates a potentially powerful use case during a market where users increasingly want to keep exposure to their underlying assets while also accessing liquidity.
Falcon's ecosystem then takes another step with sUSDf.
USDf can be deposited into Falcon's Earn system to mint sUSDf, which is designed to accrue value through Falcon's yield-generation strategies.
So the ecosystem can be viewed as:
Collateral → USDf → sUSDf → Yield
And $FF sits around this entire structure as the governance and utility layer.
---
So Where Does $FF Fit In?
This is perhaps the most important part of the entire story.
$FF isn't designed simply as a speculative token.
Falcon describes it as the native utility and governance token of the ecosystem.
That gives the token several functions.
Governance
$FF holders can participate in the governance process and help shape the future direction of Falcon Finance.
As the protocol grows, governance can become increasingly important because decisions around incentives, product development and ecosystem parameters can have a direct impact on users.
Staking
$FF can also be staked.
When users stake FF, they receive sFF representing their staked position. Falcon's staking documentation says sFF can accrue FF-based yield and provide additional Falcon Miles, while unstaking currently has a three-day cooldown.
This is important because it creates another reason to hold the token rather than simply trade it.
Better ecosystem economics
Falcon's documentation also describes economic benefits connected with staking, including improved capital efficiency, better terms around USDf and sUSDf participation, and other incentives.
Access to new products
Falcon has also positioned $FF as a way to gain privileged or early access to certain upcoming products, including new yield vaults and structured minting pathways.
So the long-term thesis for $FF is closely connected to one thing:
Does Falcon Finance become more useful over time?
If the ecosystem expands, the utility of the token potentially expands with it.
---
The Token Supply Deserves Serious Attention
One of the easiest mistakes investors can make is looking only at the current price.
The supply structure matters just as much.
Falcon has fixed the maximum supply of $FF at 10 billion tokens.
The official allocation is:
35% — Ecosystem
24% — Foundation
20% — Core Team & Early Contributors
8.3% — Community Airdrops & Launchpad
8.2% — Marketing
4.5% — Investors
At launch, approximately 2.34 billion FF, or 23.4% of the maximum supply, was circulating.
That means a large percentage of the eventual supply was not immediately available to the market.
This creates an important dynamic.
If Falcon grows quickly and demand increases faster than new supply enters circulation, the market can potentially absorb future unlocks more easily.
But if adoption fails to keep pace with new supply, unlocks can become a source of selling pressure.
For anyone holding $FF for the long term, the unlock schedule is just as important as the price chart.
---
Why Real-World Assets Could Be a Big Deal
One of the strongest parts of Falcon's story is its focus on RWAs.
Real-world assets are increasingly becoming a major part of the blockchain industry.
Treasury products, tokenized funds, equities, commodities and other traditional assets are gradually moving onto blockchain infrastructure.
Falcon wants these assets to become useful collateral rather than simply sitting on-chain as passive representations.
This is a major distinction.
Imagine a tokenized financial asset that doesn't just represent ownership but can also help unlock dollar liquidity.
That is the direction Falcon is pursuing.
The project's official updates show continued expansion into tokenized assets and RWA infrastructure, including tokenized equities, government assets and newer institutional initiatives.
If this sector grows substantially over the next few years, Falcon's universal collateralization model could have a much larger addressable market.
---
Falcon Is Also Moving Toward Regulated Finance
This is another part of the story that deserves attention.
In 2026, Falcon announced fUSD, developed with Anchorage Digital Bank.
Unlike USDf, which remains Falcon's DeFi-native synthetic dollar, fUSD is positioned as a regulated dollar product for institutional users.
Falcon says fUSD is backed 1:1 by cash, short-dated U.S. Treasuries and Treasury-backed repo, with reserves under OCC supervision and monthly Deloitte attestations.
This is an interesting strategic move.
Instead of trying to force one dollar product to serve everyone, Falcon is developing different rails for different users.
USDf can serve DeFi-native and multi-collateral use cases.
fUSD can serve institutions that require a regulated, bank-issued dollar.
That could give Falcon a way to connect traditional finance with DeFi without asking institutional users to accept exactly the same infrastructure as retail crypto users.
---
Falcon's Expansion Is Becoming More Interesting
Falcon's recent product updates show that the project is no longer focused on only one product.
The ecosystem has expanded toward:
Bitcoin-related yield products
Tokenized gold
Tokenized government assets
Tokenized equities
Institutional stablecoin infrastructure
Staking vaults
Payment infrastructure
RWA initiatives
Cross-chain infrastructure
Ecosystem funding
Falcon also launched a $50 million ecosystem fund aimed at supporting builders working around tokenized Treasury products, gold, fixed income and options infrastructure.
This is important because ecosystems become much stronger when third-party applications start building around them.
If Falcon can attract developers, liquidity and institutions at the same time, the network effect could become significantly stronger.
---
The Bullish Case for $FF
The bullish argument isn't simply:
"$FF is going up."
The more interesting argument is based on adoption.
Imagine Falcon continues to grow its USDf supply.
More users deposit collateral.
More assets become eligible.
More RWA products enter the system.
More institutions start using Falcon's infrastructure.
More users stake FF.
More products are built around USDf.
If all of those things happen together, $FF could become increasingly important within the ecosystem.
That would create a much stronger fundamental story than simple market speculation.
The token could benefit from the growth of the infrastructure underneath it.
---
But There Is Another Side
No serious analysis of $FF should ignore the risks.
Token unlocks
A large percentage of the total supply is allocated to ecosystem development, the Foundation, team members and other participants.
Future unlocks can increase the circulating supply.
If demand doesn't grow fast enough, additional supply can create pressure on the market.
DeFi risk
Falcon's ecosystem depends on collateral, liquidity, market infrastructure and yield strategies.
During extreme market conditions, these systems can face stress.
The fact that a protocol has strong performance during normal conditions doesn't guarantee the same performance during a major market shock.
Yield risk
Yield attracts capital quickly.
But investors should always ask where the yield comes from.
Falcon describes strategies including arbitrage and other market-based approaches, rather than relying on a single source.
That diversification can help, but it doesn't eliminate risk.
Competition
Falcon isn't operating alone.
The stablecoin, RWA, lending and yield markets are becoming extremely competitive.
Other protocols are also trying to solve the problem of bringing traditional assets and blockchain liquidity together.
Falcon therefore needs more than a good narrative.
It needs continued execution.
---
The Most Important Metrics to Watch
If you're following $FF, don't just watch the price.
Watch the ecosystem.
1. USDf supply
Is the amount of USDf in circulation increasing or decreasing?
Growth can provide a useful signal about demand for Falcon's infrastructure.
2. TVL
Total value locked can show how much capital is actually moving through the ecosystem.
3. RWA adoption
How many real-world assets are becoming usable within Falcon?
This could become one of the most important long-term indicators.
4. FF staking
If more tokens are being staked, it can indicate stronger long-term participation.
5. Token unlocks
Always compare new supply entering the market with actual demand.
6. Institutional adoption
Partnerships are interesting, but actual usage is more important.
7. Protocol revenue and sustainability
Long-term value needs more than attention.
The ecosystem needs sustainable economic activity.
---
The Bigger Vision
Perhaps the most interesting thing about Falcon Finance is that the project is trying to solve a problem that could become much bigger than today's DeFi market.
Traditional financial assets are increasingly being tokenized.
Crypto assets are becoming more integrated with traditional finance.
Stablecoins are becoming more widely used.
Institutions are exploring blockchain-based settlement and collateral.
At the same time, users want access to liquidity without constantly selling their assets.
These trends all point toward the same question:
Can financial assets become more productive when they move on-chain?
Falcon's answer is essentially yes.
Its universal collateralization model is designed around that idea.
And if the model works at scale, $FF becomes more than just another token.
It becomes part of the economic layer surrounding a broader financial infrastructure.
---
Final Thoughts on $FF
The most exciting thing about $FF isn't the short-term price.
It is the possibility that Falcon Finance could become a major infrastructure layer connecting crypto, stablecoins, RWAs and institutional finance.
The project already has a clear product structure:
Assets → Collateral → USDf → Yield → Ecosystem
And $FF sits at the center of governance, staking, incentives and participation.
The project has also continued expanding its ambitions through RWA integrations, institutional products, payment infrastructure and ecosystem funding.
But the market will ultimately decide whether that vision is valuable.
The next chapter for $FF will depend on whether Falcon can keep increasing real usage while managing token supply, risk and competition.
That's why I wouldn't look at $FF as simply another token on a chart.
The real question is what Falcon Finance becomes if the world of tokenized assets and on-chain dollars keeps growing.
If Falcon becomes one of the infrastructure layers powering that transition, $FF could have a much bigger story ahead.
If adoption slows, competition wins, or token supply grows faster than demand, thepicture changes completely.
For now, $FF is one of those projects where the underlying ecosystem may be more important than the token price itself.
And that is exactly what makes Falcon Finance worth watching.
*This article is for informational purposes only and is not financial advice. Crypto assets are highly volatile, and investors should conduct their own research before making financial decisions.
$FF
$FF: The Bigger Story Behind Falcon Finance and Its Push to Build the Next Generation of On-Chain
There is a lot more happening around $FF than a simple token launch or another DeFi narrative.
Falcon Finance is trying to build something much bigger: an infrastructure layer where different types of liquid assets can be used to unlock dollar-denominated liquidity on-chain.
That includes crypto assets, stablecoins and tokenized real-world assets.
At the center of this system are USDf, Falcon's synthetic dollar, sUSDf, its yield-bearing version, and $FF , the native utility and governance token that connects users to the wider ecosystem.
What makes the story interesting is that Falcon isn't only targeting crypto-native traders. Its roadmap increasingly focuses on tokenized assets, institutional users, regulated infrastructure and real-world financial products.
That gives $FF exposure to several of the biggest themes developing across the crypto industry at the same time.
But there is also an important question:
Can Falcon turn this ambitious vision into sustainable, long-term demand for $FF ?
That is where the real story begins.
What Is Falcon Finance Actually Building?
The easiest way to understand Falcon Finance is to think about the problem it is trying to solve.
Crypto users may hold assets that have significant value, but those assets are not always easy to turn into productive dollar liquidity without selling them.
Falcon's model attempts to change that.
Eligible assets can be deposited as collateral, and the protocol can use that collateral to create USDf, its synthetic dollar.
According to Falcon's documentation, supported collateral can include assets such as USDC, USDT, FDUSD, BTC and ETH, with different collateralization requirements depending on the asset.
The bigger vision extends beyond crypto.
Falcon has been building toward a system where tokenized real-world assets can also become part of this collateral infrastructure.
That means the project is effectively trying to connect three worlds:
Crypto assets + tokenized real-world assets + on-chain dollar liquidity.
And that is what makes the project worth watching.
---
USDf Is the Engine Behind the Ecosystem
To understand $FF , you need to understand USDf first.
USDf is designed as an overcollateralized synthetic dollar.
Users provide eligible assets as collateral and receive USDf in return. For non-stablecoin assets such as BTC and ETH, Falcon applies an overcollateralization ratio to provide a buffer against market volatility.
The idea is relatively simple:
You don't necessarily need to sell your asset to access dollar liquidity.
Instead, you can use the asset as collateral.
This creates a potentially powerful use case during a market where users increasingly want to keep exposure to their underlying assets while also accessing liquidity.
Falcon's ecosystem then takes another step with sUSDf.
USDf can be deposited into Falcon's Earn system to mint sUSDf, which is designed to accrue value through Falcon's yield-generation strategies.
So the ecosystem can be viewed as:
Collateral → USDf → sUSDf → Yield
And $FF sits around this entire structure as the governance and utility layer.
---
So Where Does $FF Fit In?
This is perhaps the most important part of the entire story.
$FF isn't designed simply as a speculative token.
Falcon describes it as the native utility and governance token of the ecosystem.
That gives the token several functions.
Governance
$FF holders can participate in the governance process and help shape the future direction of Falcon Finance.
As the protocol grows, governance can become increasingly important because decisions around incentives, product development and ecosystem parameters can have a direct impact on users.
Staking
$FF can also be staked.
When users stake FF, they receive sFF representing their staked position. Falcon's staking documentation says sFF can accrue FF-based yield and provide additional Falcon Miles, while unstaking currently has a three-day cooldown.
This is important because it creates another reason to hold the token rather than simply trade it.
Better ecosystem economics
Falcon's documentation also describes economic benefits connected with staking, including improved capital efficiency, better terms around USDf and sUSDf participation, and other incentives.
Access to new products
Falcon has also positioned $FF as a way to gain privileged or early access to certain upcoming products, including new yield vaults and structured minting pathways.
So the long-term thesis for $FF is closely connected to one thing:
Does Falcon Finance become more useful over time?
If the ecosystem expands, the utility of the token potentially expands with it.
---
The Token Supply Deserves Serious Attention
One of the easiest mistakes investors can make is looking only at the current price.
The supply structure matters just as much.
Falcon has fixed the maximum supply of $FF at 10 billion tokens.
The official allocation is:
35% — Ecosystem
24% — Foundation
20% — Core Team & Early Contributors
8.3% — Community Airdrops & Launchpad
8.2% — Marketing
4.5% — Investors
At launch, approximately 2.34 billion FF, or 23.4% of the maximum supply, was circulating.
That means a large percentage of the eventual supply was not immediately available to the market.
This creates an important dynamic.
If Falcon grows quickly and demand increases faster than new supply enters circulation, the market can potentially absorb future unlocks more easily.
But if adoption fails to keep pace with new supply, unlocks can become a source of selling pressure.
For anyone holding $FF for the long term, the unlock schedule is just as important as the price chart.
---
Why Real-World Assets Could Be a Big Deal
One of the strongest parts of Falcon's story is its focus on RWAs.
Real-world assets are increasingly becoming a major part of the blockchain industry.
Treasury products, tokenized funds, equities, commodities and other traditional assets are gradually moving onto blockchain infrastructure.
Falcon wants these assets to become useful collateral rather than simply sitting on-chain as passive representations.
This is a major distinction.
Imagine a tokenized financial asset that doesn't just represent ownership but can also help unlock dollar liquidity.
That is the direction Falcon is pursuing.
The project's official updates show continued expansion into tokenized assets and RWA infrastructure, including tokenized equities, government assets and newer institutional initiatives.
If this sector grows substantially over the next few years, Falcon's universal collateralization model could have a much larger addressable market.
---
Falcon Is Also Moving Toward Regulated Finance
This is another part of the story that deserves attention.
In 2026, Falcon announced fUSD, developed with Anchorage Digital Bank.
Unlike USDf, which remains Falcon's DeFi-native synthetic dollar, fUSD is positioned as a regulated dollar product for institutional users.
Falcon says fUSD is backed 1:1 by cash, short-dated U.S. Treasuries and Treasury-backed repo, with reserves under OCC supervision and monthly Deloitte attestations.
This is an interesting strategic move.
Instead of trying to force one dollar product to serve everyone, Falcon is developing different rails for different users.
USDf can serve DeFi-native and multi-collateral use cases.
fUSD can serve institutions that require a regulated, bank-issued dollar.
That could give Falcon a way to connect traditional finance with DeFi without asking institutional users to accept exactly the same infrastructure as retail crypto users.
---
Falcon's Expansion Is Becoming More Interesting
Falcon's recent product updates show that the project is no longer focused on only one product.
The ecosystem has expanded toward:
Bitcoin-related yield products
Tokenized gold
Tokenized government assets
Tokenized equities
Institutional stablecoin infrastructure
Staking vaults
Payment infrastructure
RWA initiatives
Cross-chain infrastructure
Ecosystem funding
Falcon also launched a $50 million ecosystem fund aimed at supporting builders working around tokenized Treasury products, gold, fixed income and options infrastructure.
This is important because ecosystems become much stronger when third-party applications start building around them.
If Falcon can attract developers, liquidity and institutions at the same time, the network effect could become significantly stronger.
---
The Bullish Case for $FF
The bullish argument isn't simply:
"$FF is going up."
The more interesting argument is based on adoption.
Imagine Falcon continues to grow its USDf supply.
More users deposit collateral.
More assets become eligible.
More RWA products enter the system.
More institutions start using Falcon's infrastructure.
More users stake FF.
More products are built around USDf.
If all of those things happen together, $FF could become increasingly important within the ecosystem.
That would create a much stronger fundamental story than simple market speculation.
The token could benefit from the growth of the infrastructure underneath it.
---
But There Is Another Side
No serious analysis of $FF should ignore the risks.
Token unlocks
A large percentage of the total supply is allocated to ecosystem development, the Foundation, team members and other participants.
Future unlocks can increase the circulating supply.
If demand doesn't grow fast enough, additional supply can create pressure on the market.
DeFi risk
Falcon's ecosystem depends on collateral, liquidity, market infrastructure and yield strategies.
During extreme market conditions, these systems can face stress.
The fact that a protocol has strong performance during normal conditions doesn't guarantee the same performance during a major market shock.
Yield risk
Yield attracts capital quickly.
But investors should always ask where the yield comes from.
Falcon describes strategies including arbitrage and other market-based approaches, rather than relying on a single source.
That diversification can help, but it doesn't eliminate risk.
Competition
Falcon isn't operating alone.
The stablecoin, RWA, lending and yield markets are becoming extremely competitive.
Other protocols are also trying to solve the problem of bringing traditional assets and blockchain liquidity together.
Falcon therefore needs more than a good narrative.
It needs continued execution.
---
The Most Important Metrics to Watch
If you're following $FF , don't just watch the price.
Watch the ecosystem.
1. USDf supply
Is the amount of USDf in circulation increasing or decreasing?
Growth can provide a useful signal about demand for Falcon's infrastructure.
2. TVL
Total value locked can show how much capital is actually moving through the ecosystem.
3. RWA adoption
How many real-world assets are becoming usable within Falcon?
This could become one of the most important long-term indicators.
4. FF staking
If more tokens are being staked, it can indicate stronger long-term participation.
5. Token unlocks
Always compare new supply entering the market with actual demand.
6. Institutional adoption
Partnerships are interesting, but actual usage is more important.
7. Protocol revenue and sustainability
Long-term value needs more than attention.
The ecosystem needs sustainable economic activity.
---
The Bigger Vision
Perhaps the most interesting thing about Falcon Finance is that the project is trying to solve a problem that could become much bigger than today's DeFi market.
Traditional financial assets are increasingly being tokenized.
Crypto assets are becoming more integrated with traditional finance.
Stablecoins are becoming more widely used.
Institutions are exploring blockchain-based settlement and collateral.
At the same time, users want access to liquidity without constantly selling their assets.
These trends all point toward the same question:
Can financial assets become more productive when they move on-chain?
Falcon's answer is essentially yes.
Its universal collateralization model is designed around that idea.
And if the model works at scale, $FF becomes more than just another token.
It becomes part of the economic layer surrounding a broader financial infrastructure.
---
Final Thoughts on $FF
The most exciting thing about $FF isn't the short-term price.
It is the possibility that Falcon Finance could become a major infrastructure layer connecting crypto, stablecoins, RWAs and institutional finance.
The project already has a clear product structure:
Assets → Collateral → USDf → Yield → Ecosystem
And $FF sits at the center of governance, staking, incentives and participation.
The project has also continued expanding its ambitions through RWA integrations, institutional products, payment infrastructure and ecosystem funding.
But the market will ultimately decide whether that vision is valuable.
The next chapter for $FF will depend on whether Falcon can keep increasing real usage while managing token supply, risk and competition.
That's why I wouldn't look at $FF as simply another token on a chart.
The real question is what Falcon Finance becomes if the world of tokenized assets and on-chain dollars keeps growing.
If Falcon becomes one of the infrastructure layers powering that transition, $FF could have a much bigger story ahead.
If adoption slows, competition wins, or token supply grows faster than demand, thepicture changes completely.
For now, $FF is one of those projects where the underlying ecosystem may be more important than the token price itself.
And that is exactly what makes Falcon Finance worth watching.
*This article is for informational purposes only and is not financial advice. Crypto assets are highly volatile, and investors should conduct their own research before making financial decisions.
$FF
Falcon Finance is trying to build something much bigger: an infrastructure layer where different types of liquid assets can be used to unlock dollar-denominated liquidity on-chain.
That includes crypto assets, stablecoins and tokenized real-world assets.
At the center of this system are USDf, Falcon's synthetic dollar, sUSDf, its yield-bearing version, and $FF , the native utility and governance token that connects users to the wider ecosystem.
What makes the story interesting is that Falcon isn't only targeting crypto-native traders. Its roadmap increasingly focuses on tokenized assets, institutional users, regulated infrastructure and real-world financial products.
That gives $FF exposure to several of the biggest themes developing across the crypto industry at the same time.
But there is also an important question:
Can Falcon turn this ambitious vision into sustainable, long-term demand for $FF ?
That is where the real story begins.
What Is Falcon Finance Actually Building?
The easiest way to understand Falcon Finance is to think about the problem it is trying to solve.
Crypto users may hold assets that have significant value, but those assets are not always easy to turn into productive dollar liquidity without selling them.
Falcon's model attempts to change that.
Eligible assets can be deposited as collateral, and the protocol can use that collateral to create USDf, its synthetic dollar.
According to Falcon's documentation, supported collateral can include assets such as USDC, USDT, FDUSD, BTC and ETH, with different collateralization requirements depending on the asset.
The bigger vision extends beyond crypto.
Falcon has been building toward a system where tokenized real-world assets can also become part of this collateral infrastructure.
That means the project is effectively trying to connect three worlds:
Crypto assets + tokenized real-world assets + on-chain dollar liquidity.
And that is what makes the project worth watching.
---
USDf Is the Engine Behind the Ecosystem
To understand $FF , you need to understand USDf first.
USDf is designed as an overcollateralized synthetic dollar.
Users provide eligible assets as collateral and receive USDf in return. For non-stablecoin assets such as BTC and ETH, Falcon applies an overcollateralization ratio to provide a buffer against market volatility.
The idea is relatively simple:
You don't necessarily need to sell your asset to access dollar liquidity.
Instead, you can use the asset as collateral.
This creates a potentially powerful use case during a market where users increasingly want to keep exposure to their underlying assets while also accessing liquidity.
Falcon's ecosystem then takes another step with sUSDf.
USDf can be deposited into Falcon's Earn system to mint sUSDf, which is designed to accrue value through Falcon's yield-generation strategies.
So the ecosystem can be viewed as:
Collateral → USDf → sUSDf → Yield
And $FF sits around this entire structure as the governance and utility layer.
---
So Where Does $FF Fit In?
This is perhaps the most important part of the entire story.
$FF isn't designed simply as a speculative token.
Falcon describes it as the native utility and governance token of the ecosystem.
That gives the token several functions.
Governance
$FF holders can participate in the governance process and help shape the future direction of Falcon Finance.
As the protocol grows, governance can become increasingly important because decisions around incentives, product development and ecosystem parameters can have a direct impact on users.
Staking
$FF can also be staked.
When users stake FF, they receive sFF representing their staked position. Falcon's staking documentation says sFF can accrue FF-based yield and provide additional Falcon Miles, while unstaking currently has a three-day cooldown.
This is important because it creates another reason to hold the token rather than simply trade it.
Better ecosystem economics
Falcon's documentation also describes economic benefits connected with staking, including improved capital efficiency, better terms around USDf and sUSDf participation, and other incentives.
Access to new products
Falcon has also positioned $FF as a way to gain privileged or early access to certain upcoming products, including new yield vaults and structured minting pathways.
So the long-term thesis for $FF is closely connected to one thing:
Does Falcon Finance become more useful over time?
If the ecosystem expands, the utility of the token potentially expands with it.
---
The Token Supply Deserves Serious Attention
One of the easiest mistakes investors can make is looking only at the current price.
The supply structure matters just as much.
Falcon has fixed the maximum supply of $FF at 10 billion tokens.
The official allocation is:
35% — Ecosystem
24% — Foundation
20% — Core Team & Early Contributors
8.3% — Community Airdrops & Launchpad
8.2% — Marketing
4.5% — Investors
At launch, approximately 2.34 billion FF, or 23.4% of the maximum supply, was circulating.
That means a large percentage of the eventual supply was not immediately available to the market.
This creates an important dynamic.
If Falcon grows quickly and demand increases faster than new supply enters circulation, the market can potentially absorb future unlocks more easily.
But if adoption fails to keep pace with new supply, unlocks can become a source of selling pressure.
For anyone holding $FF for the long term, the unlock schedule is just as important as the price chart.
---
Why Real-World Assets Could Be a Big Deal
One of the strongest parts of Falcon's story is its focus on RWAs.
Real-world assets are increasingly becoming a major part of the blockchain industry.
Treasury products, tokenized funds, equities, commodities and other traditional assets are gradually moving onto blockchain infrastructure.
Falcon wants these assets to become useful collateral rather than simply sitting on-chain as passive representations.
This is a major distinction.
Imagine a tokenized financial asset that doesn't just represent ownership but can also help unlock dollar liquidity.
That is the direction Falcon is pursuing.
The project's official updates show continued expansion into tokenized assets and RWA infrastructure, including tokenized equities, government assets and newer institutional initiatives.
If this sector grows substantially over the next few years, Falcon's universal collateralization model could have a much larger addressable market.
---
Falcon Is Also Moving Toward Regulated Finance
This is another part of the story that deserves attention.
In 2026, Falcon announced fUSD, developed with Anchorage Digital Bank.
Unlike USDf, which remains Falcon's DeFi-native synthetic dollar, fUSD is positioned as a regulated dollar product for institutional users.
Falcon says fUSD is backed 1:1 by cash, short-dated U.S. Treasuries and Treasury-backed repo, with reserves under OCC supervision and monthly Deloitte attestations.
This is an interesting strategic move.
Instead of trying to force one dollar product to serve everyone, Falcon is developing different rails for different users.
USDf can serve DeFi-native and multi-collateral use cases.
fUSD can serve institutions that require a regulated, bank-issued dollar.
That could give Falcon a way to connect traditional finance with DeFi without asking institutional users to accept exactly the same infrastructure as retail crypto users.
---
Falcon's Expansion Is Becoming More Interesting
Falcon's recent product updates show that the project is no longer focused on only one product.
The ecosystem has expanded toward:
Bitcoin-related yield products
Tokenized gold
Tokenized government assets
Tokenized equities
Institutional stablecoin infrastructure
Staking vaults
Payment infrastructure
RWA initiatives
Cross-chain infrastructure
Ecosystem funding
Falcon also launched a $50 million ecosystem fund aimed at supporting builders working around tokenized Treasury products, gold, fixed income and options infrastructure.
This is important because ecosystems become much stronger when third-party applications start building around them.
If Falcon can attract developers, liquidity and institutions at the same time, the network effect could become significantly stronger.
---
The Bullish Case for $FF
The bullish argument isn't simply:
"$FF is going up."
The more interesting argument is based on adoption.
Imagine Falcon continues to grow its USDf supply.
More users deposit collateral.
More assets become eligible.
More RWA products enter the system.
More institutions start using Falcon's infrastructure.
More users stake FF.
More products are built around USDf.
If all of those things happen together, $FF could become increasingly important within the ecosystem.
That would create a much stronger fundamental story than simple market speculation.
The token could benefit from the growth of the infrastructure underneath it.
---
But There Is Another Side
No serious analysis of $FF should ignore the risks.
Token unlocks
A large percentage of the total supply is allocated to ecosystem development, the Foundation, team members and other participants.
Future unlocks can increase the circulating supply.
If demand doesn't grow fast enough, additional supply can create pressure on the market.
DeFi risk
Falcon's ecosystem depends on collateral, liquidity, market infrastructure and yield strategies.
During extreme market conditions, these systems can face stress.
The fact that a protocol has strong performance during normal conditions doesn't guarantee the same performance during a major market shock.
Yield risk
Yield attracts capital quickly.
But investors should always ask where the yield comes from.
Falcon describes strategies including arbitrage and other market-based approaches, rather than relying on a single source.
That diversification can help, but it doesn't eliminate risk.
Competition
Falcon isn't operating alone.
The stablecoin, RWA, lending and yield markets are becoming extremely competitive.
Other protocols are also trying to solve the problem of bringing traditional assets and blockchain liquidity together.
Falcon therefore needs more than a good narrative.
It needs continued execution.
---
The Most Important Metrics to Watch
If you're following $FF , don't just watch the price.
Watch the ecosystem.
1. USDf supply
Is the amount of USDf in circulation increasing or decreasing?
Growth can provide a useful signal about demand for Falcon's infrastructure.
2. TVL
Total value locked can show how much capital is actually moving through the ecosystem.
3. RWA adoption
How many real-world assets are becoming usable within Falcon?
This could become one of the most important long-term indicators.
4. FF staking
If more tokens are being staked, it can indicate stronger long-term participation.
5. Token unlocks
Always compare new supply entering the market with actual demand.
6. Institutional adoption
Partnerships are interesting, but actual usage is more important.
7. Protocol revenue and sustainability
Long-term value needs more than attention.
The ecosystem needs sustainable economic activity.
---
The Bigger Vision
Perhaps the most interesting thing about Falcon Finance is that the project is trying to solve a problem that could become much bigger than today's DeFi market.
Traditional financial assets are increasingly being tokenized.
Crypto assets are becoming more integrated with traditional finance.
Stablecoins are becoming more widely used.
Institutions are exploring blockchain-based settlement and collateral.
At the same time, users want access to liquidity without constantly selling their assets.
These trends all point toward the same question:
Can financial assets become more productive when they move on-chain?
Falcon's answer is essentially yes.
Its universal collateralization model is designed around that idea.
And if the model works at scale, $FF becomes more than just another token.
It becomes part of the economic layer surrounding a broader financial infrastructure.
---
Final Thoughts on $FF
The most exciting thing about $FF isn't the short-term price.
It is the possibility that Falcon Finance could become a major infrastructure layer connecting crypto, stablecoins, RWAs and institutional finance.
The project already has a clear product structure:
Assets → Collateral → USDf → Yield → Ecosystem
And $FF sits at the center of governance, staking, incentives and participation.
The project has also continued expanding its ambitions through RWA integrations, institutional products, payment infrastructure and ecosystem funding.
But the market will ultimately decide whether that vision is valuable.
The next chapter for $FF will depend on whether Falcon can keep increasing real usage while managing token supply, risk and competition.
That's why I wouldn't look at $FF as simply another token on a chart.
The real question is what Falcon Finance becomes if the world of tokenized assets and on-chain dollars keeps growing.
If Falcon becomes one of the infrastructure layers powering that transition, $FF could have a much bigger story ahead.
If adoption slows, competition wins, or token supply grows faster than demand, thepicture changes completely.
For now, $FF is one of those projects where the underlying ecosystem may be more important than the token price itself.
And that is exactly what makes Falcon Finance worth watching.
*This article is for informational purposes only and is not financial advice. Crypto assets are highly volatile, and investors should conduct their own research before making financial decisions.
$FF
1
138
·
--
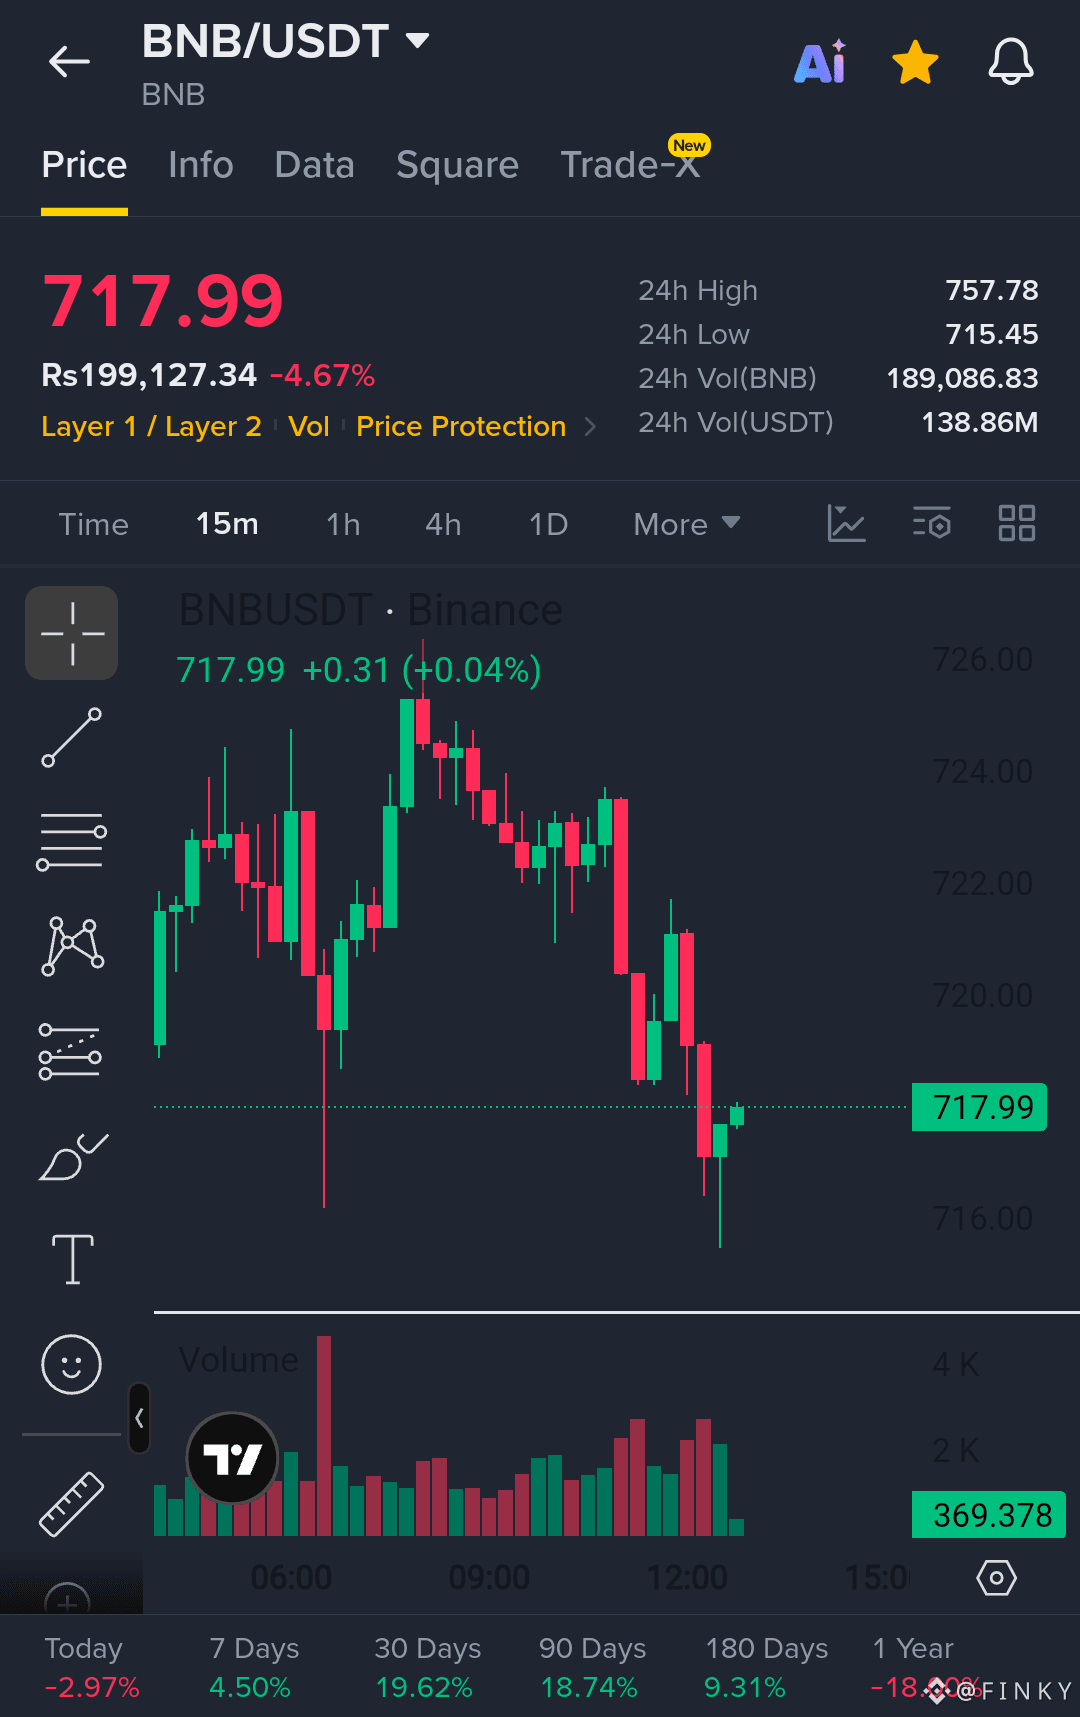
$BNB is showing strong bullish momentum. Buyers remain in control as the structure continues to hold.
Ep
717.50 - 719.00
TP
721.00
723.00
725.00
Sl
715.30
Liquidity was swept around 715.50 and price reacted aggressively. Buyers reclaimed the structure, and consolidation above 717.50 keeps continuation in play.
Let's go $BNB
{spot}(BNBUSDT)
#EUExtendsCentralContactPointToCASPs #US10YTreasuryYieldHitsHighestSinceNov2023 #USADPWeeklyEmploymentRises12000 #BankOfAmericaGroupPilotsUSBDCStablecoin #RippleLobbiesToAdvanceCLARITYActVote
$BNB is showing strong bullish momentum. Buyers remain in control as the structure continues to hold.
Ep
717.50 - 719.00
TP
721.00
723.00
725.00
Sl
715.30
Liquidity was swept around 715.50 and price reacted aggressively. Buyers reclaimed the structure, and consolidation above 717.50 keeps continuation in play.
Let's go $BNB
#EUExtendsCentralContactPointToCASPs #US10YTreasuryYieldHitsHighestSinceNov2023 #USADPWeeklyEmploymentRises12000 #BankOfAmericaGroupPilotsUSBDCStablecoin #RippleLobbiesToAdvanceCLARITYActVote
Ep
717.50 - 719.00
TP
721.00
723.00
725.00
Sl
715.30
Liquidity was swept around 715.50 and price reacted aggressively. Buyers reclaimed the structure, and consolidation above 717.50 keeps continuation in play.
Let's go $BNB
#EUExtendsCentralContactPointToCASPs #US10YTreasuryYieldHitsHighestSinceNov2023 #USADPWeeklyEmploymentRises12000 #BankOfAmericaGroupPilotsUSBDCStablecoin #RippleLobbiesToAdvanceCLARITYActVote
74
·
--
Bearish
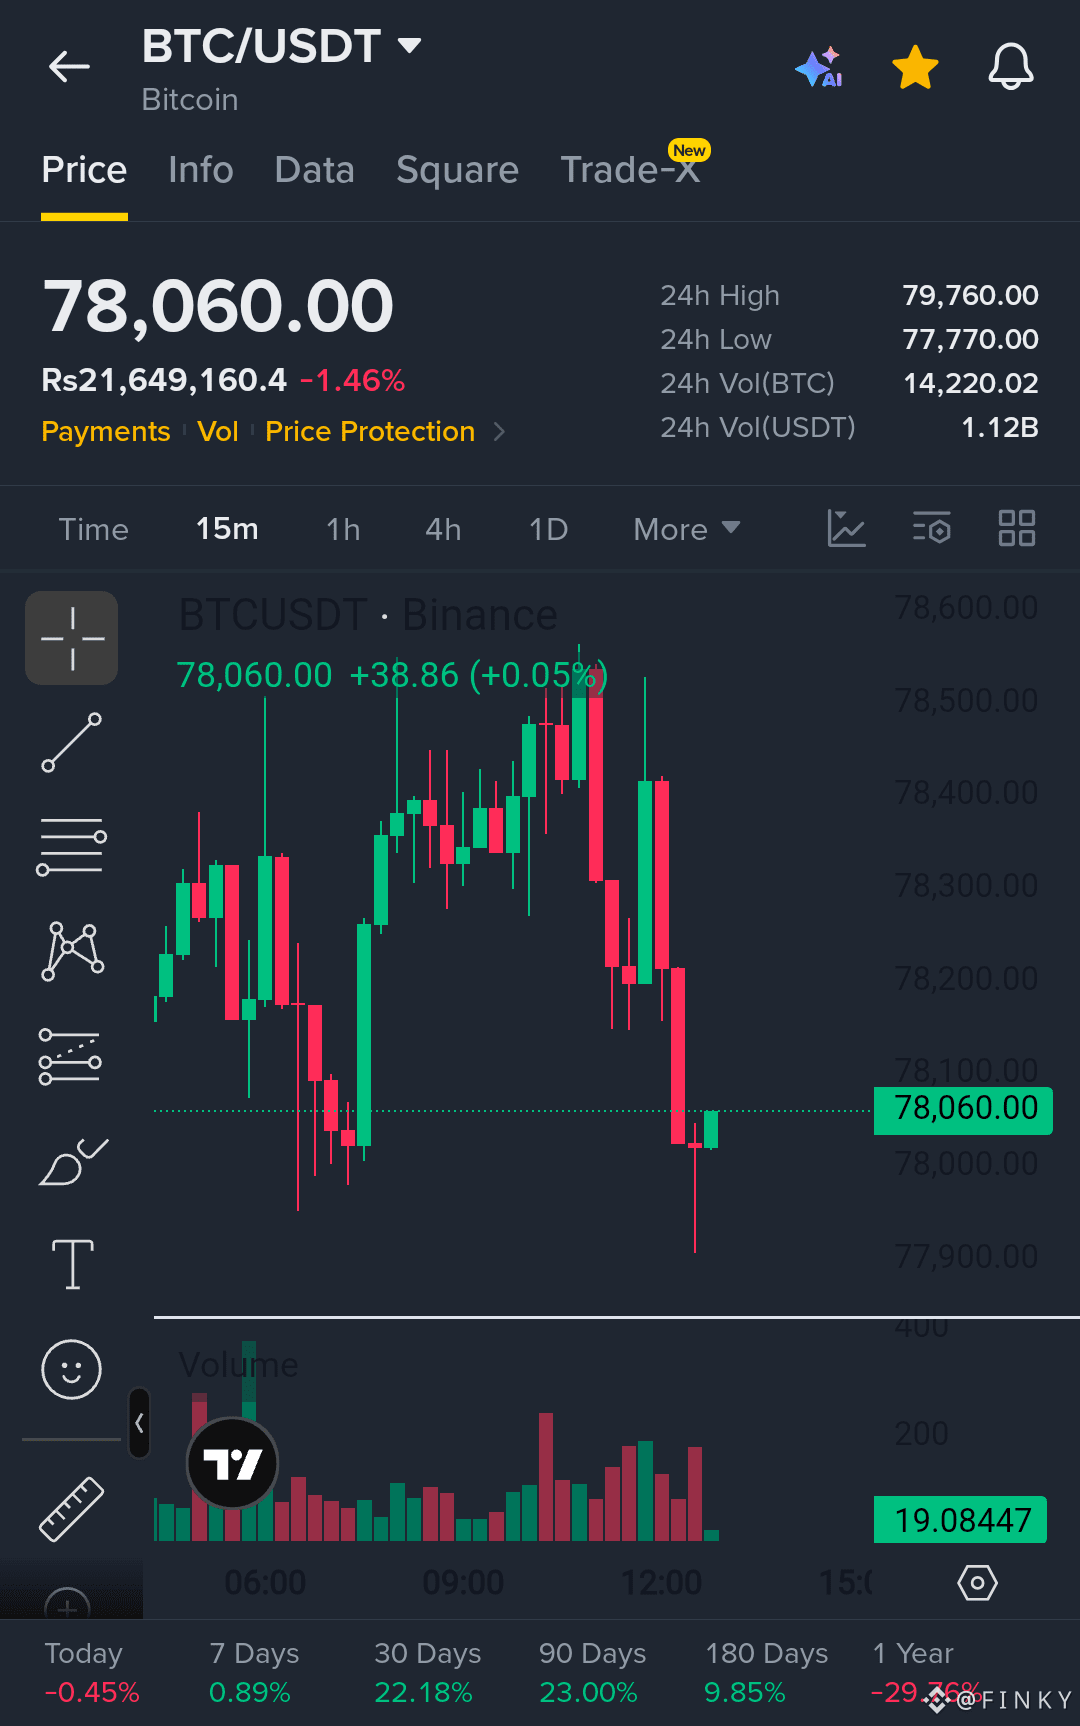
$BTC is showing strong bullish momentum. Buyers remain in control as the structure continues to hold.
Ep
78,000 - 78,100
TP
78,300
78,500
78,700
Sl
77,750
Liquidity was swept around 77,900 and price reacted aggressively. Buyers reclaimed the structure, and consolidation above 78,000 keeps continuation in play.
Let's go $BTC
{spot}(BTCUSDT)
#IranSaysReadyToEscalateWarWithUS #US10YTreasuryYieldHitsHighestSinceNov2023 #USADPWeeklyEmploymentRises12000 #BankOfAmericaGroupPilotsUSBDCStablecoin #RippleLobbiesToAdvanceCLARITYActVote
$BTC is showing strong bullish momentum. Buyers remain in control as the structure continues to hold.
Ep
78,000 - 78,100
TP
78,300
78,500
78,700
Sl
77,750
Liquidity was swept around 77,900 and price reacted aggressively. Buyers reclaimed the structure, and consolidation above 78,000 keeps continuation in play.
Let's go $BTC
#IranSaysReadyToEscalateWarWithUS #US10YTreasuryYieldHitsHighestSinceNov2023 #USADPWeeklyEmploymentRises12000 #BankOfAmericaGroupPilotsUSBDCStablecoin #RippleLobbiesToAdvanceCLARITYActVote
Ep
78,000 - 78,100
TP
78,300
78,500
78,700
Sl
77,750
Liquidity was swept around 77,900 and price reacted aggressively. Buyers reclaimed the structure, and consolidation above 78,000 keeps continuation in play.
Let's go $BTC
#IranSaysReadyToEscalateWarWithUS #US10YTreasuryYieldHitsHighestSinceNov2023 #USADPWeeklyEmploymentRises12000 #BankOfAmericaGroupPilotsUSBDCStablecoin #RippleLobbiesToAdvanceCLARITYActVote
21
·
--
Bullish
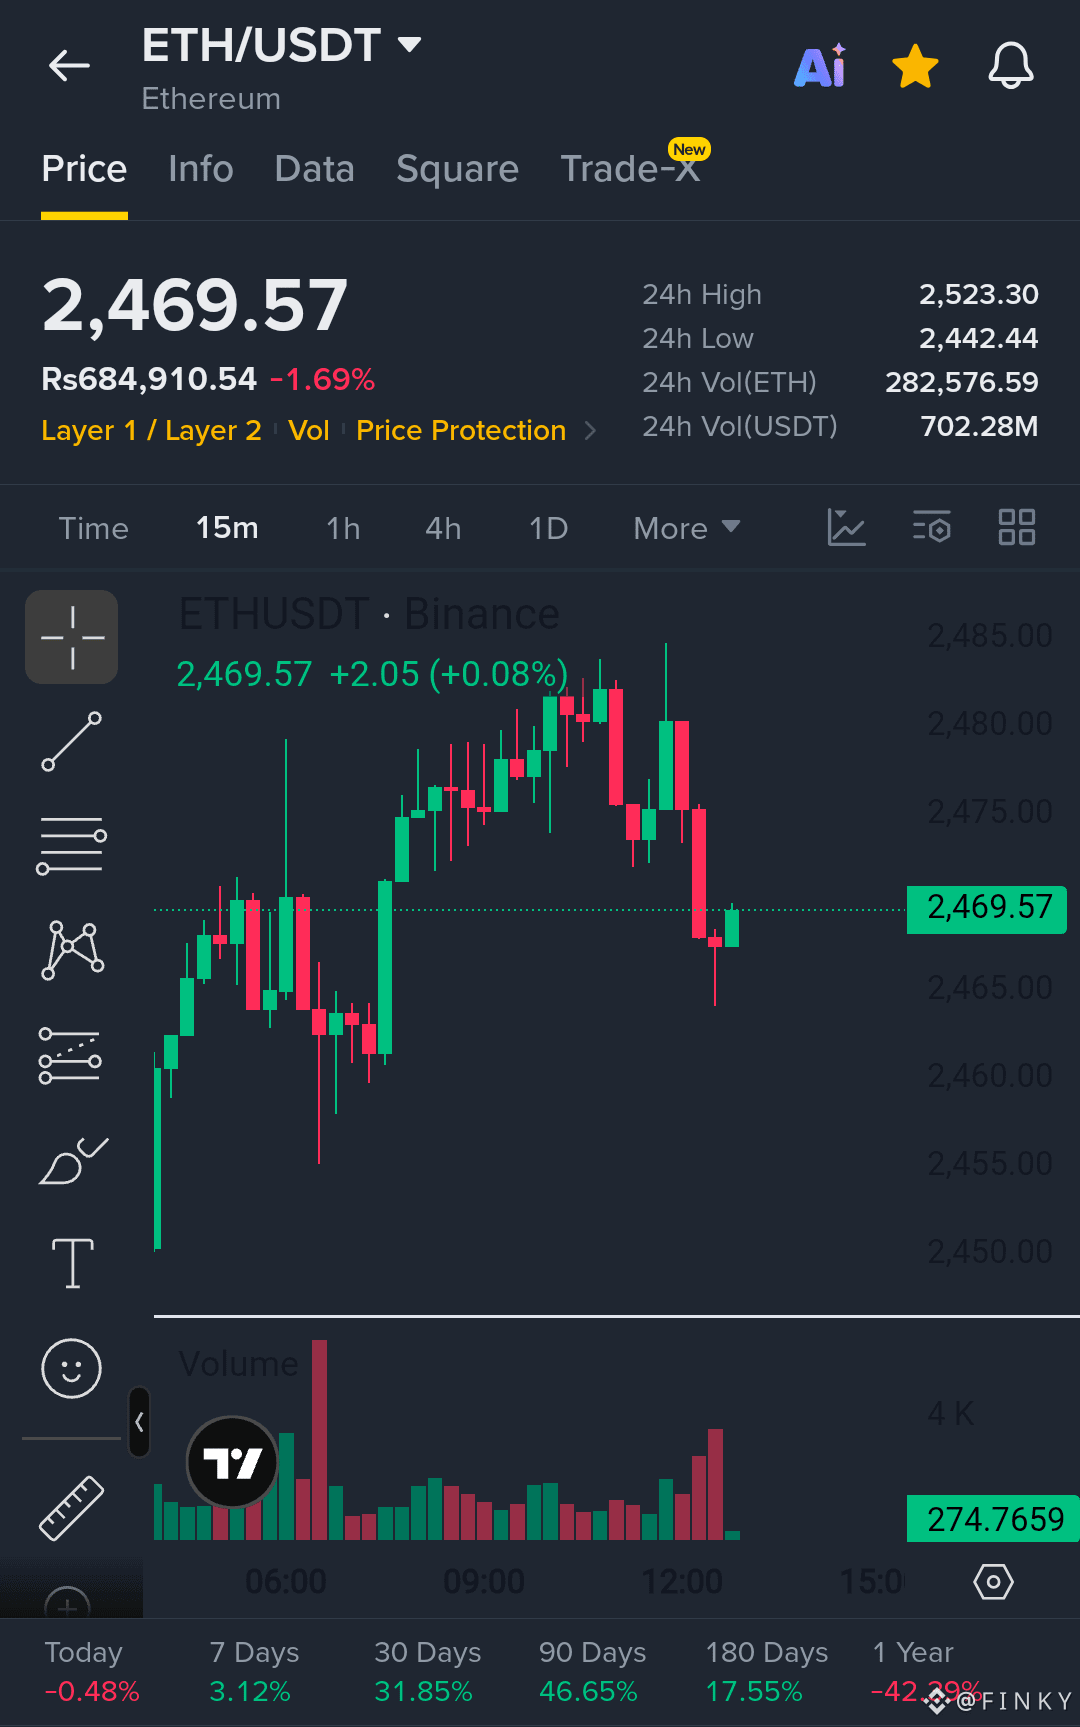
$ETH is showing strong bullish momentum. Buyers remain in control as the structure continues to hold.
Ep
2,465 - 2,472
TP
2,480
2,490
2,505
Sl
2,452
Liquidity was swept around 2,455 and price reacted aggressively. Buyers reclaimed the structure, and consolidation above 2,465 keeps continuation in play.
Let's go $ETH
{spot}(ETHUSDT)
#AppleDebutsFoldablePhone #EUExtendsCentralContactPointToCASPs #US10YTreasuryYieldHitsHighestSinceNov2023 #USADPWeeklyEmploymentRises12000 #BankOfAmericaGroupPilotsUSBDCStablecoin
$ETH is showing strong bullish momentum. Buyers remain in control as the structure continues to hold.
Ep
2,465 - 2,472
TP
2,480
2,490
2,505
Sl
2,452
Liquidity was swept around 2,455 and price reacted aggressively. Buyers reclaimed the structure, and consolidation above 2,465 keeps continuation in play.
Let's go $ETH
#AppleDebutsFoldablePhone #EUExtendsCentralContactPointToCASPs #US10YTreasuryYieldHitsHighestSinceNov2023 #USADPWeeklyEmploymentRises12000 #BankOfAmericaGroupPilotsUSBDCStablecoin
Ep
2,465 - 2,472
TP
2,480
2,490
2,505
Sl
2,452
Liquidity was swept around 2,455 and price reacted aggressively. Buyers reclaimed the structure, and consolidation above 2,465 keeps continuation in play.
Let's go $ETH
#AppleDebutsFoldablePhone #EUExtendsCentralContactPointToCASPs #US10YTreasuryYieldHitsHighestSinceNov2023 #USADPWeeklyEmploymentRises12000 #BankOfAmericaGroupPilotsUSBDCStablecoin
26
·
--
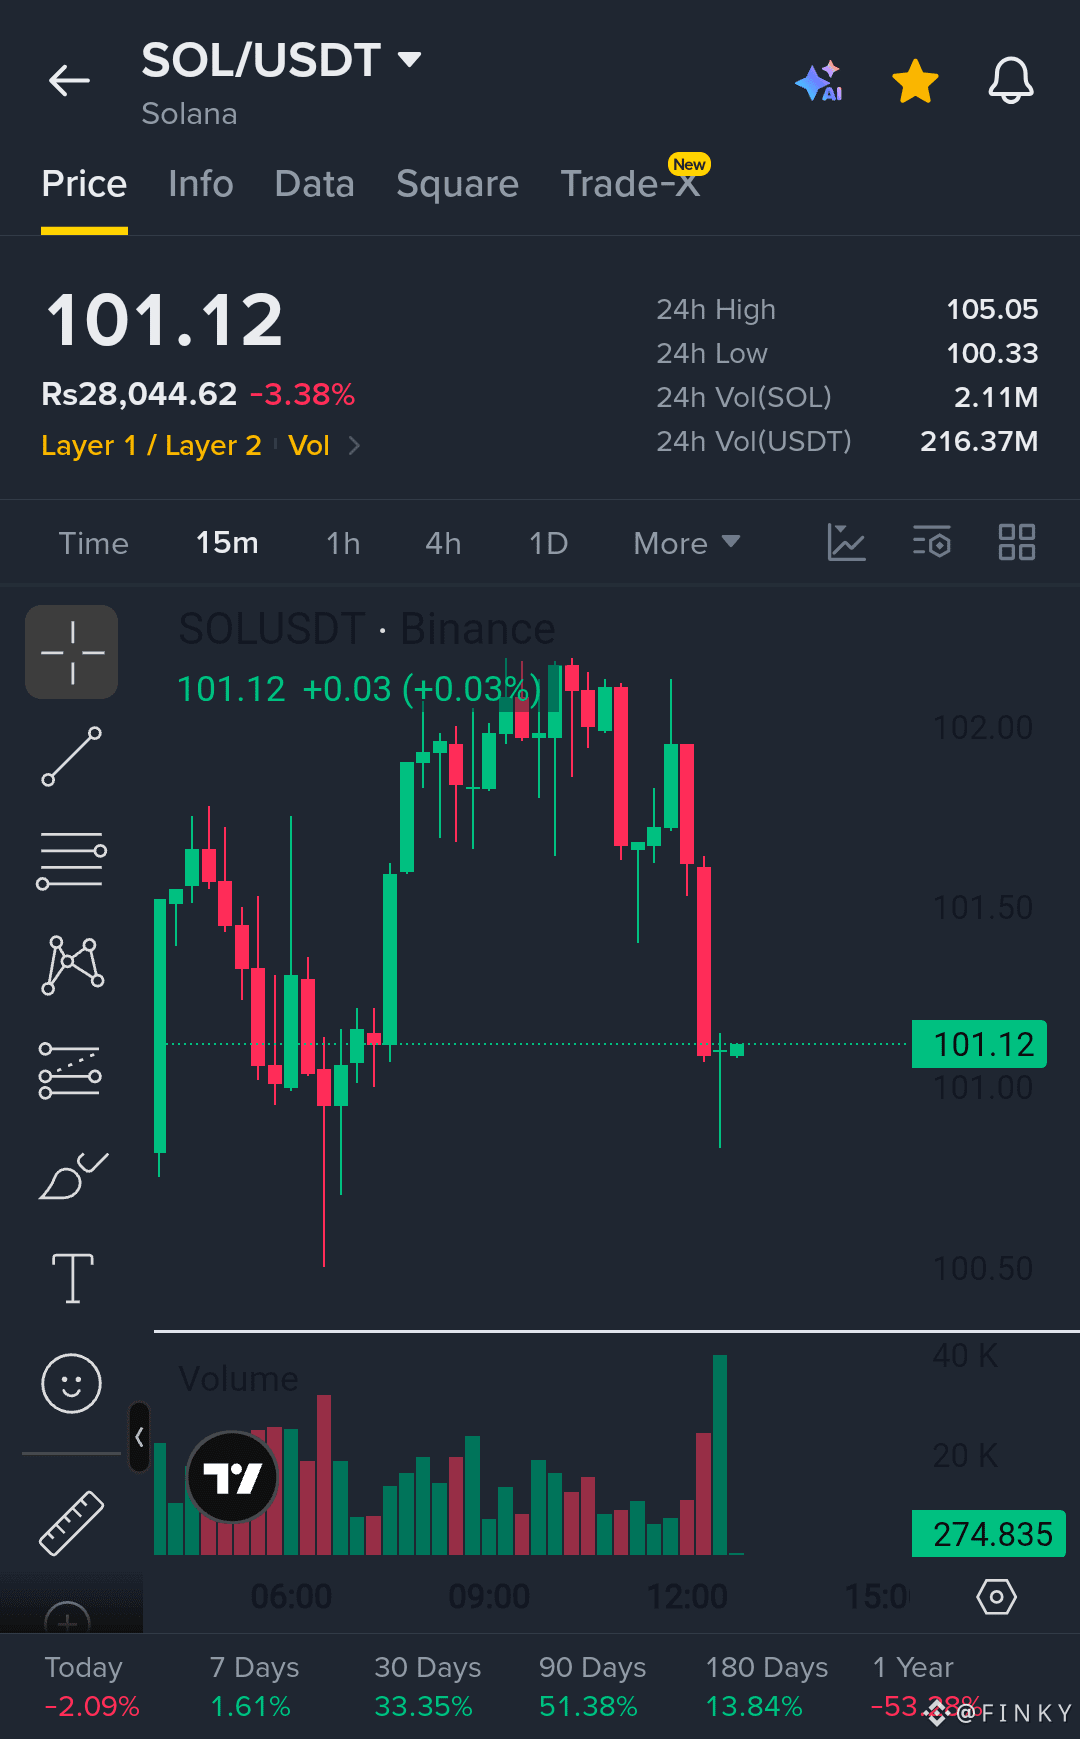
$SOL is showing strong bullish momentum. Buyers remain in control as the structure continues to hold.
Ep
101.00 - 101.20
TP
101.50
101.80
102.20
Sl
100.60
Liquidity was swept around 100.65 and price reacted aggressively. Buyers reclaimed the structure, and consolidation above 101.00 keeps continuation in play.
Let's go $SOL
{spot}(SOLUSDT)
#EUExtendsCentralContactPointToCASPs #US10YTreasuryYieldHitsHighestSinceNov2023 #USADPWeeklyEmploymentRises12000 #BankOfAmericaGroupPilotsUSBDCStablecoin #RippleLobbiesToAdvanceCLARITYActVote
$SOL is showing strong bullish momentum. Buyers remain in control as the structure continues to hold.
Ep
101.00 - 101.20
TP
101.50
101.80
102.20
Sl
100.60
Liquidity was swept around 100.65 and price reacted aggressively. Buyers reclaimed the structure, and consolidation above 101.00 keeps continuation in play.
Let's go $SOL
#EUExtendsCentralContactPointToCASPs #US10YTreasuryYieldHitsHighestSinceNov2023 #USADPWeeklyEmploymentRises12000 #BankOfAmericaGroupPilotsUSBDCStablecoin #RippleLobbiesToAdvanceCLARITYActVote
Ep
101.00 - 101.20
TP
101.50
101.80
102.20
Sl
100.60
Liquidity was swept around 100.65 and price reacted aggressively. Buyers reclaimed the structure, and consolidation above 101.00 keeps continuation in play.
Let's go $SOL
#EUExtendsCentralContactPointToCASPs #US10YTreasuryYieldHitsHighestSinceNov2023 #USADPWeeklyEmploymentRises12000 #BankOfAmericaGroupPilotsUSBDCStablecoin #RippleLobbiesToAdvanceCLARITYActVote
35
·
--
Bullish
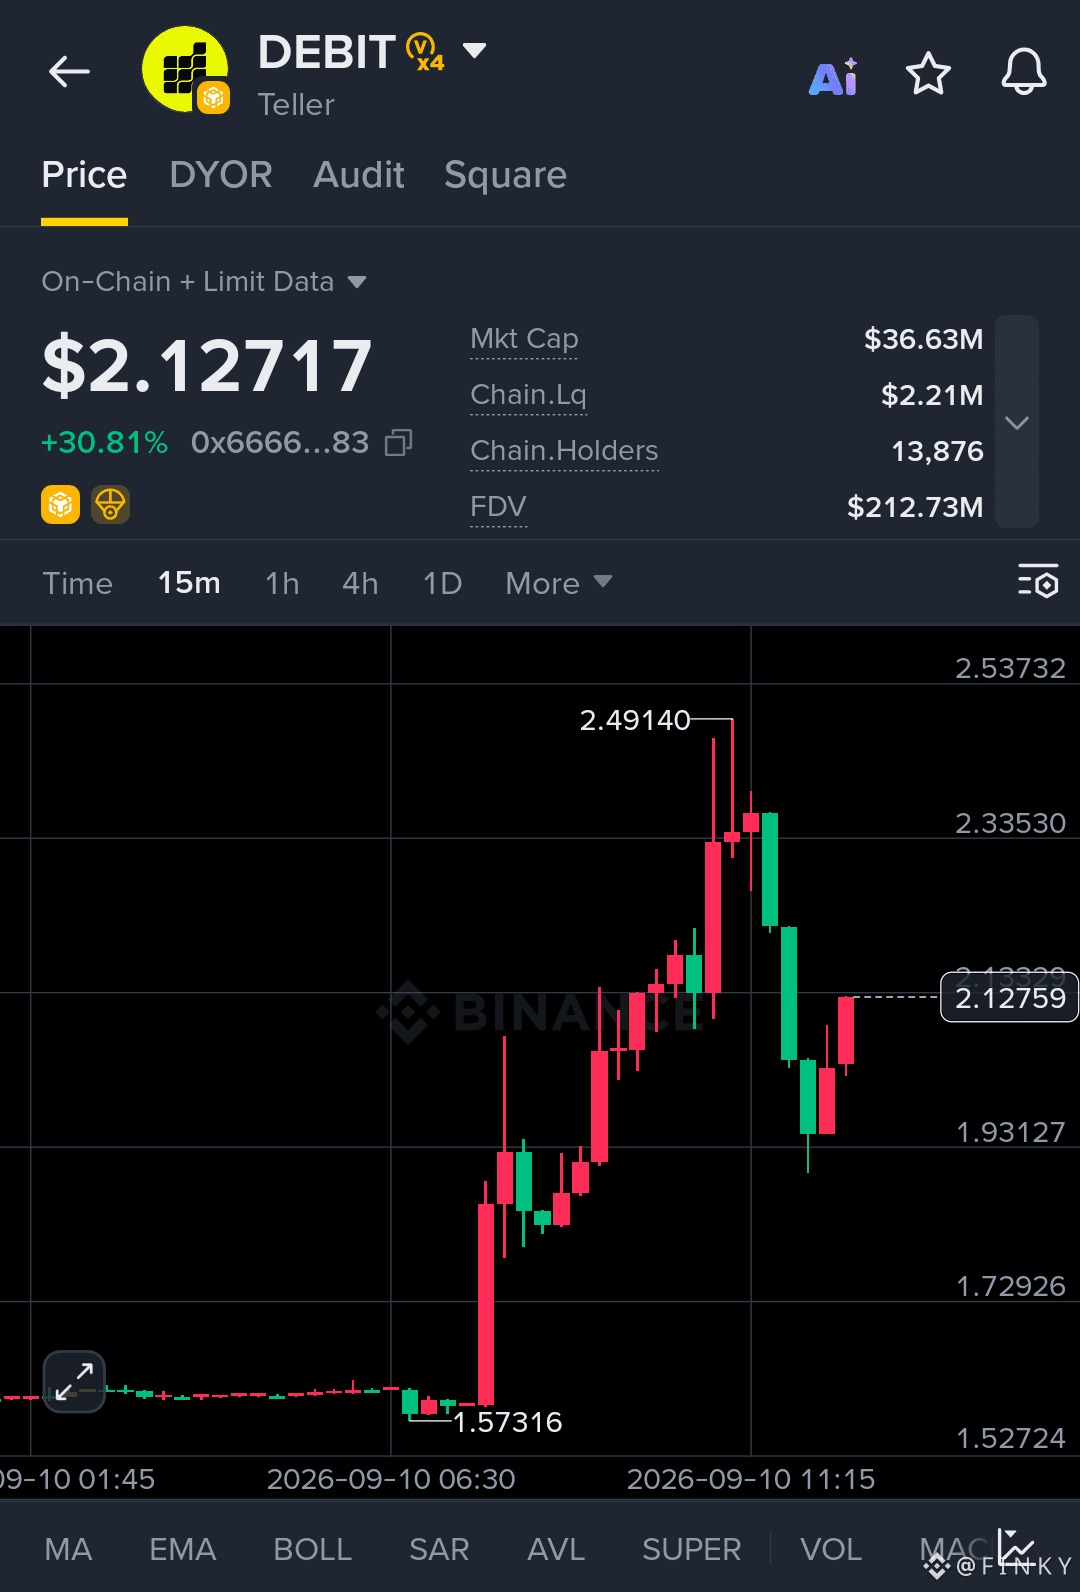
$DEBIT is showing strong bullish momentum. Buyers remain in control as the structure continues to hold.
Ep
2.05 - 2.13
TP
2.23
2.35
2.49
Sl
1.92
Liquidity was swept around 1.93 and price reacted aggressively. Buyers reclaimed the structure, and consolidation above 2.05 keeps continuation in play.
Let's go $DEBIT
{alpha}(560x66661c7229901f568f16bd1551b3ba826f83ce49)
#EUExtendsCentralContactPointToCASPs #US10YTreasuryYieldHitsHighestSinceNov2023 #USADPWeeklyEmploymentRises12000 #BankOfAmericaGroupPilotsUSBDCStablecoin #RippleLobbiesToAdvanceCLARITYActVote
$DEBIT is showing strong bullish momentum. Buyers remain in control as the structure continues to hold.
Ep
2.05 - 2.13
TP
2.23
2.35
2.49
Sl
1.92
Liquidity was swept around 1.93 and price reacted aggressively. Buyers reclaimed the structure, and consolidation above 2.05 keeps continuation in play.
Let's go $DEBIT
#EUExtendsCentralContactPointToCASPs #US10YTreasuryYieldHitsHighestSinceNov2023 #USADPWeeklyEmploymentRises12000 #BankOfAmericaGroupPilotsUSBDCStablecoin #RippleLobbiesToAdvanceCLARITYActVote
Ep
2.05 - 2.13
TP
2.23
2.35
2.49
Sl
1.92
Liquidity was swept around 1.93 and price reacted aggressively. Buyers reclaimed the structure, and consolidation above 2.05 keeps continuation in play.
Let's go $DEBIT
#EUExtendsCentralContactPointToCASPs #US10YTreasuryYieldHitsHighestSinceNov2023 #USADPWeeklyEmploymentRises12000 #BankOfAmericaGroupPilotsUSBDCStablecoin #RippleLobbiesToAdvanceCLARITYActVote
240
·
--
Bullish
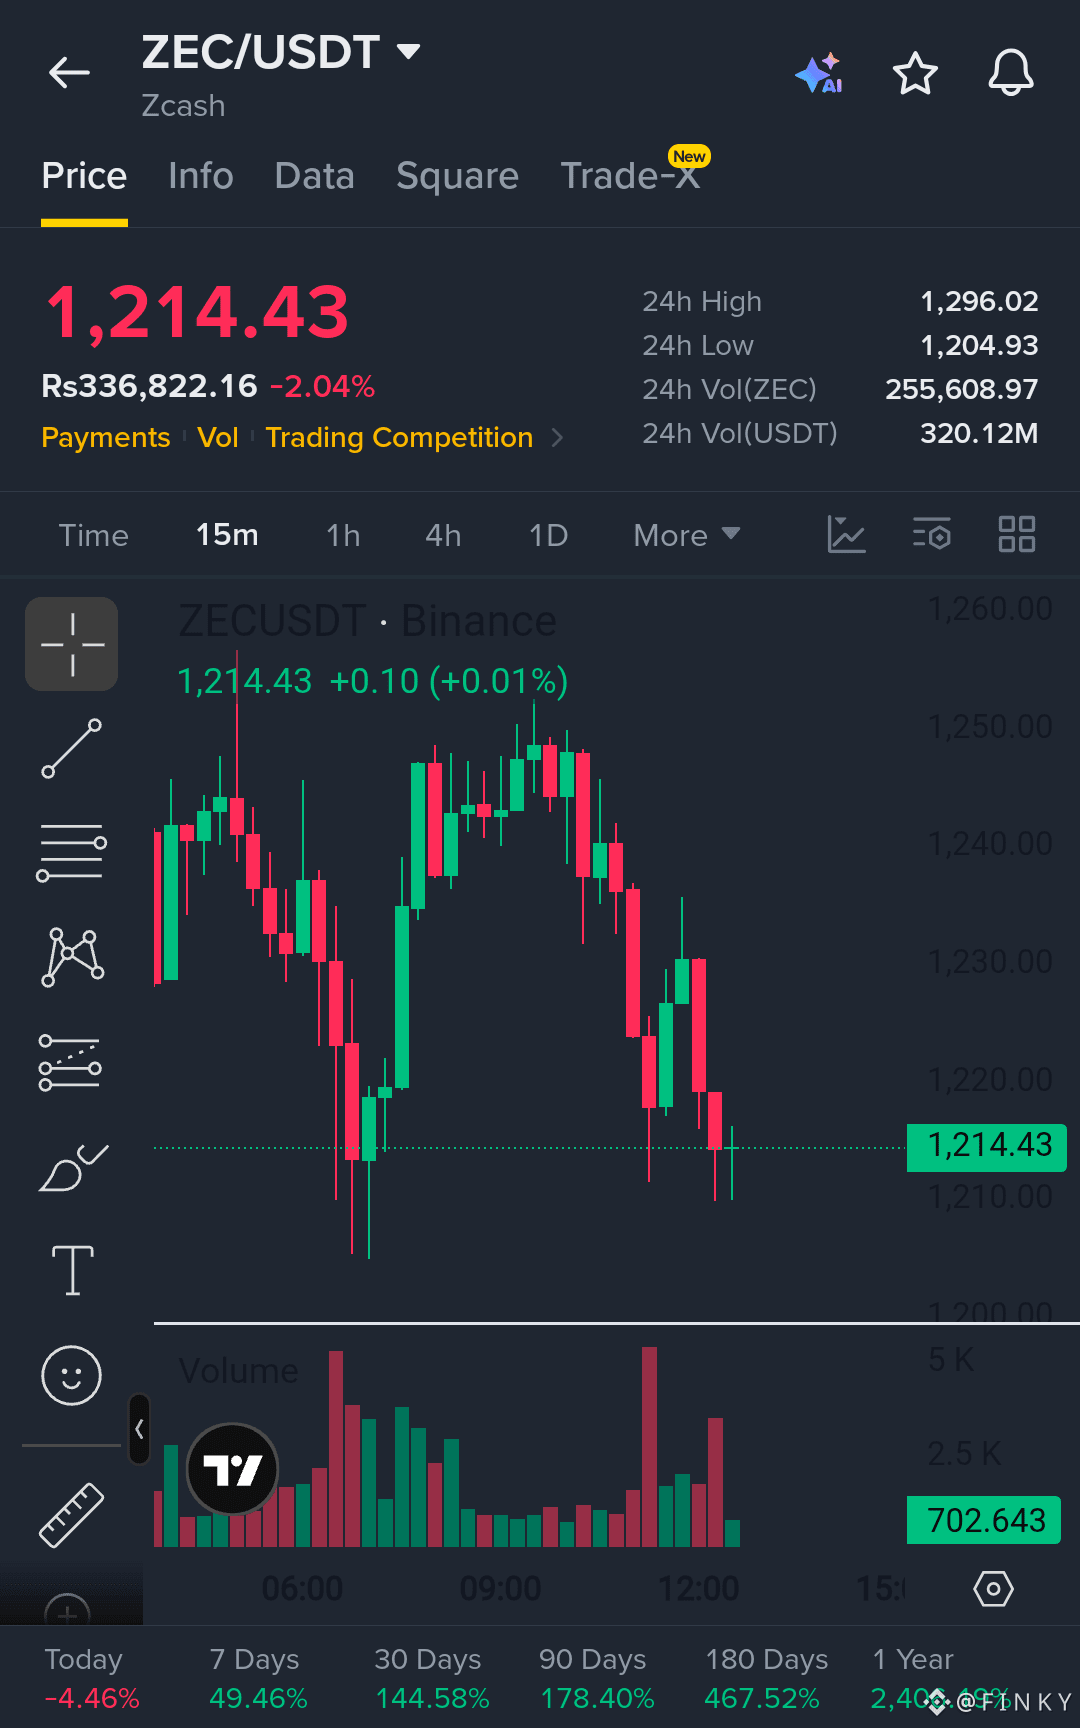
$ZEC is showing strong bullish momentum. Buyers remain in control as the structure continues to hold.
Ep
1210 - 1216
TP
1228
1240
1248
Sl
1202
Liquidity was swept around 1210 and price reacted aggressively. Buyers reclaimed the structure, and consolidation above 1214 keeps continuation in play.
Let's go $ZEC
{spot}(ZECUSDT)
$SC
{spot}(SCUSDT)
#EUExtendsCentralContactPointToCASPs #EUExtendsCentralContactPointToCASPs #US10YTreasuryYieldHitsHighestSinceNov2023 #USADPWeeklyEmploymentRises12000 #BankOfAmericaGroupPilotsUSBDCStablecoin
$ZEC is showing strong bullish momentum. Buyers remain in control as the structure continues to hold.
Ep
1210 - 1216
TP
1228
1240
1248
Sl
1202
Liquidity was swept around 1210 and price reacted aggressively. Buyers reclaimed the structure, and consolidation above 1214 keeps continuation in play.
Let's go $ZEC
$SC
#EUExtendsCentralContactPointToCASPs #EUExtendsCentralContactPointToCASPs #US10YTreasuryYieldHitsHighestSinceNov2023 #USADPWeeklyEmploymentRises12000 #BankOfAmericaGroupPilotsUSBDCStablecoin
Ep
1210 - 1216
TP
1228
1240
1248
Sl
1202
Liquidity was swept around 1210 and price reacted aggressively. Buyers reclaimed the structure, and consolidation above 1214 keeps continuation in play.
Let's go $ZEC
$SC
#EUExtendsCentralContactPointToCASPs #EUExtendsCentralContactPointToCASPs #US10YTreasuryYieldHitsHighestSinceNov2023 #USADPWeeklyEmploymentRises12000 #BankOfAmericaGroupPilotsUSBDCStablecoin
174
·
--
Bullish
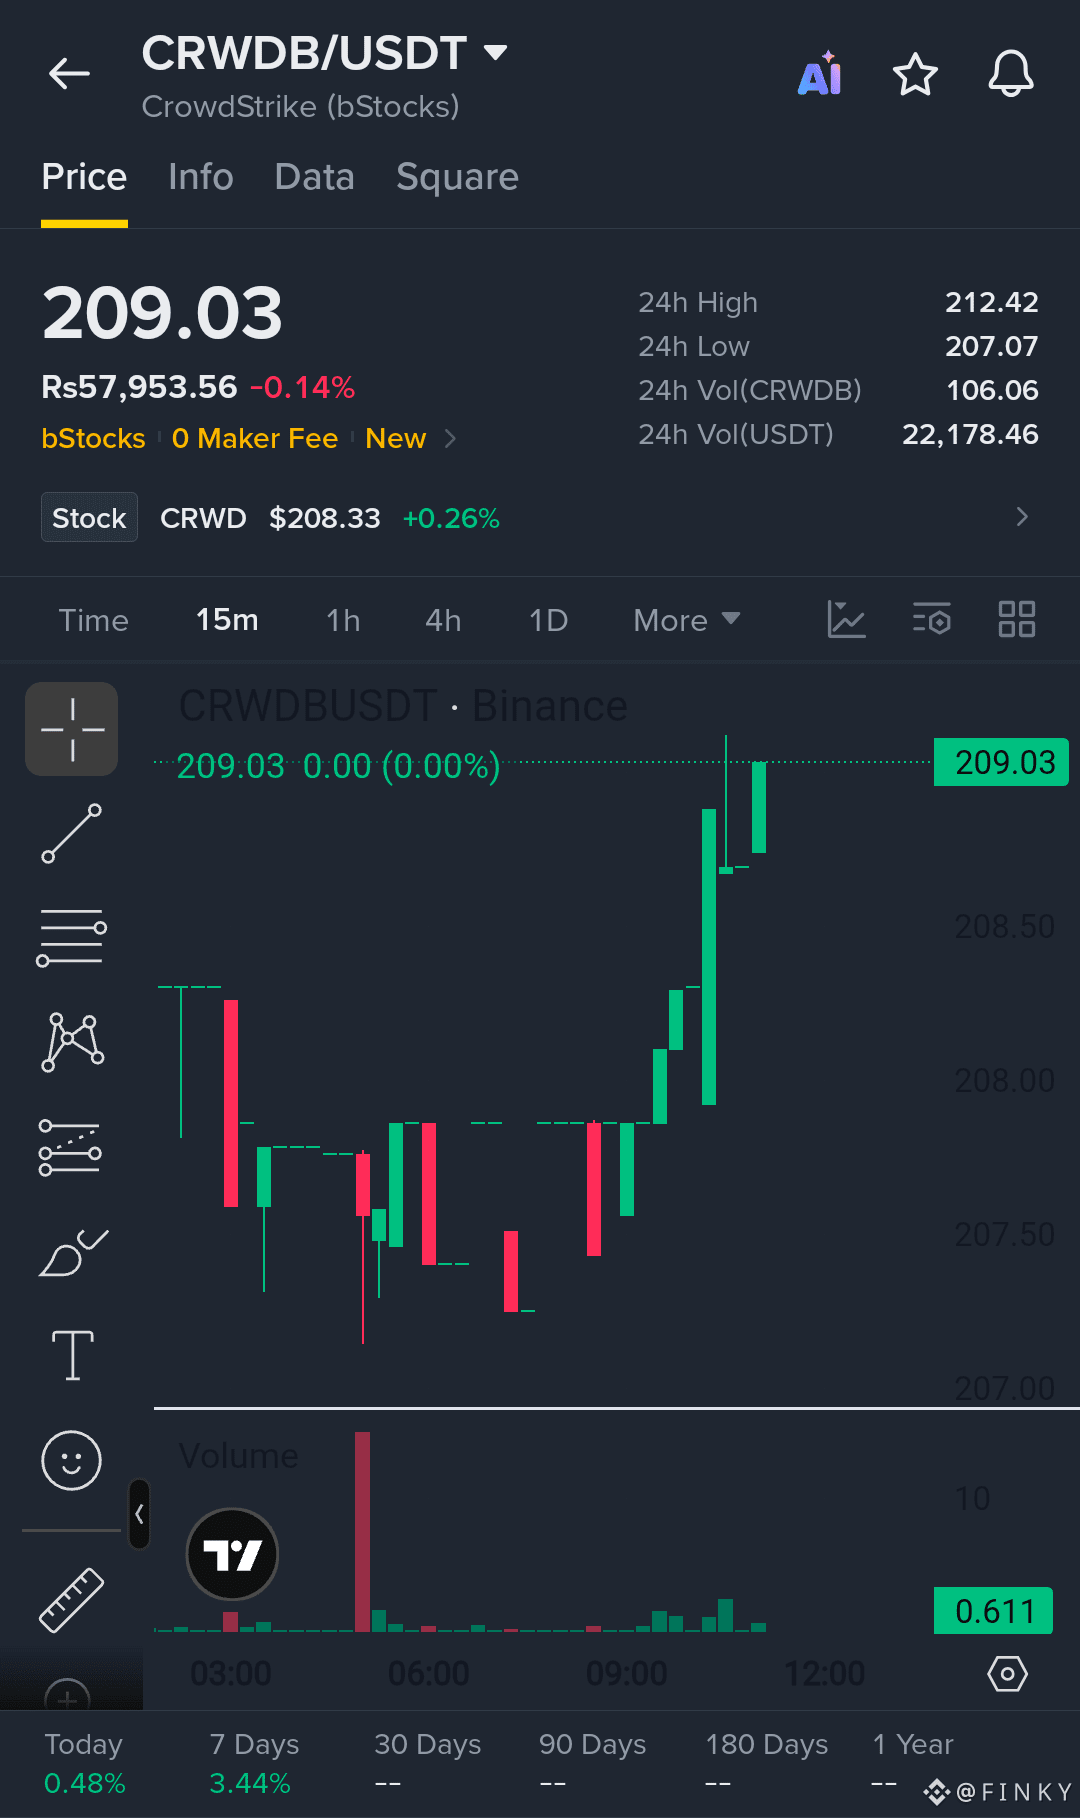
$CRWDB is showing strong bullish momentum. Buyers remain in control as the structure continues to hold.
Ep
208.70 - 209.10
TP
209.80
210.50
212.00
Sl
207.80
Liquidity was swept around 207.07 and price reacted aggressively. Buyers reclaimed the structure, and consolidation above 208.50 keeps continuation in play.
Let's go $CRWDB
$CRWDB is showing strong bullish momentum. Buyers remain in control as the structure continues to hold.
Ep
208.70 - 209.10
TP
209.80
210.50
212.00
Sl
207.80
Liquidity was swept around 207.07 and price reacted aggressively. Buyers reclaimed the structure, and consolidation above 208.50 keeps continuation in play.
Let's go $CRWDB
Ep
208.70 - 209.10
TP
209.80
210.50
212.00
Sl
207.80
Liquidity was swept around 207.07 and price reacted aggressively. Buyers reclaimed the structure, and consolidation above 208.50 keeps continuation in play.
Let's go $CRWDB
48
·
--
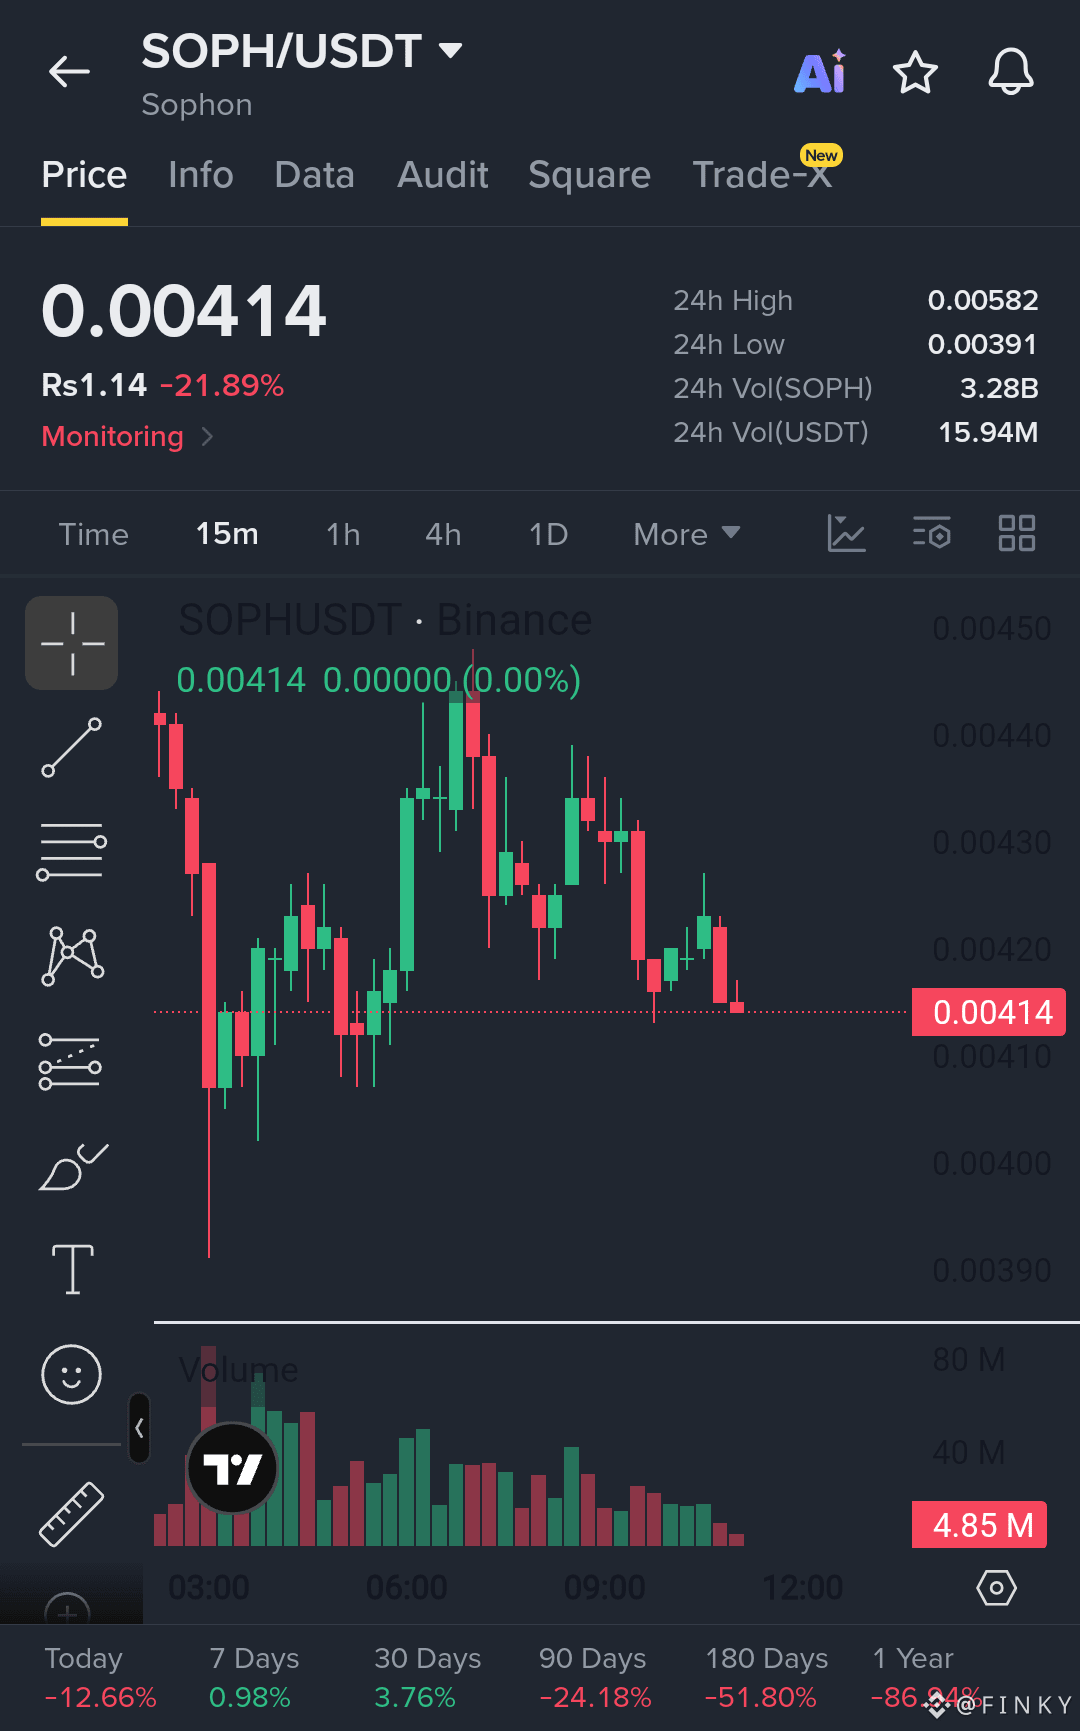
$SOPH is showing strong bullish momentum. Buyers remain in control as the structure continues to hold.
Ep
0.00410 - 0.00416
TP
0.00425
0.00435
0.00445
Sl
0.00398
Liquidity was swept around 0.00391 and price reacted aggressively. Buyers reclaimed the structure, and consolidation above 0.00410 keeps continuation in play.
Let's go $SOPH
{spot}(SOPHUSDT)
#US10YTreasuryYieldHitsHighestSinceNov2023 #RippleLobbiesToAdvanceCLARITYActVote
$SOPH is showing strong bullish momentum. Buyers remain in control as the structure continues to hold.
Ep
0.00410 - 0.00416
TP
0.00425
0.00435
0.00445
Sl
0.00398
Liquidity was swept around 0.00391 and price reacted aggressively. Buyers reclaimed the structure, and consolidation above 0.00410 keeps continuation in play.
Let's go $SOPH
#US10YTreasuryYieldHitsHighestSinceNov2023 #RippleLobbiesToAdvanceCLARITYActVote
Ep
0.00410 - 0.00416
TP
0.00425
0.00435
0.00445
Sl
0.00398
Liquidity was swept around 0.00391 and price reacted aggressively. Buyers reclaimed the structure, and consolidation above 0.00410 keeps continuation in play.
Let's go $SOPH
#US10YTreasuryYieldHitsHighestSinceNov2023 #RippleLobbiesToAdvanceCLARITYActVote
1
53
·
--
Bullish
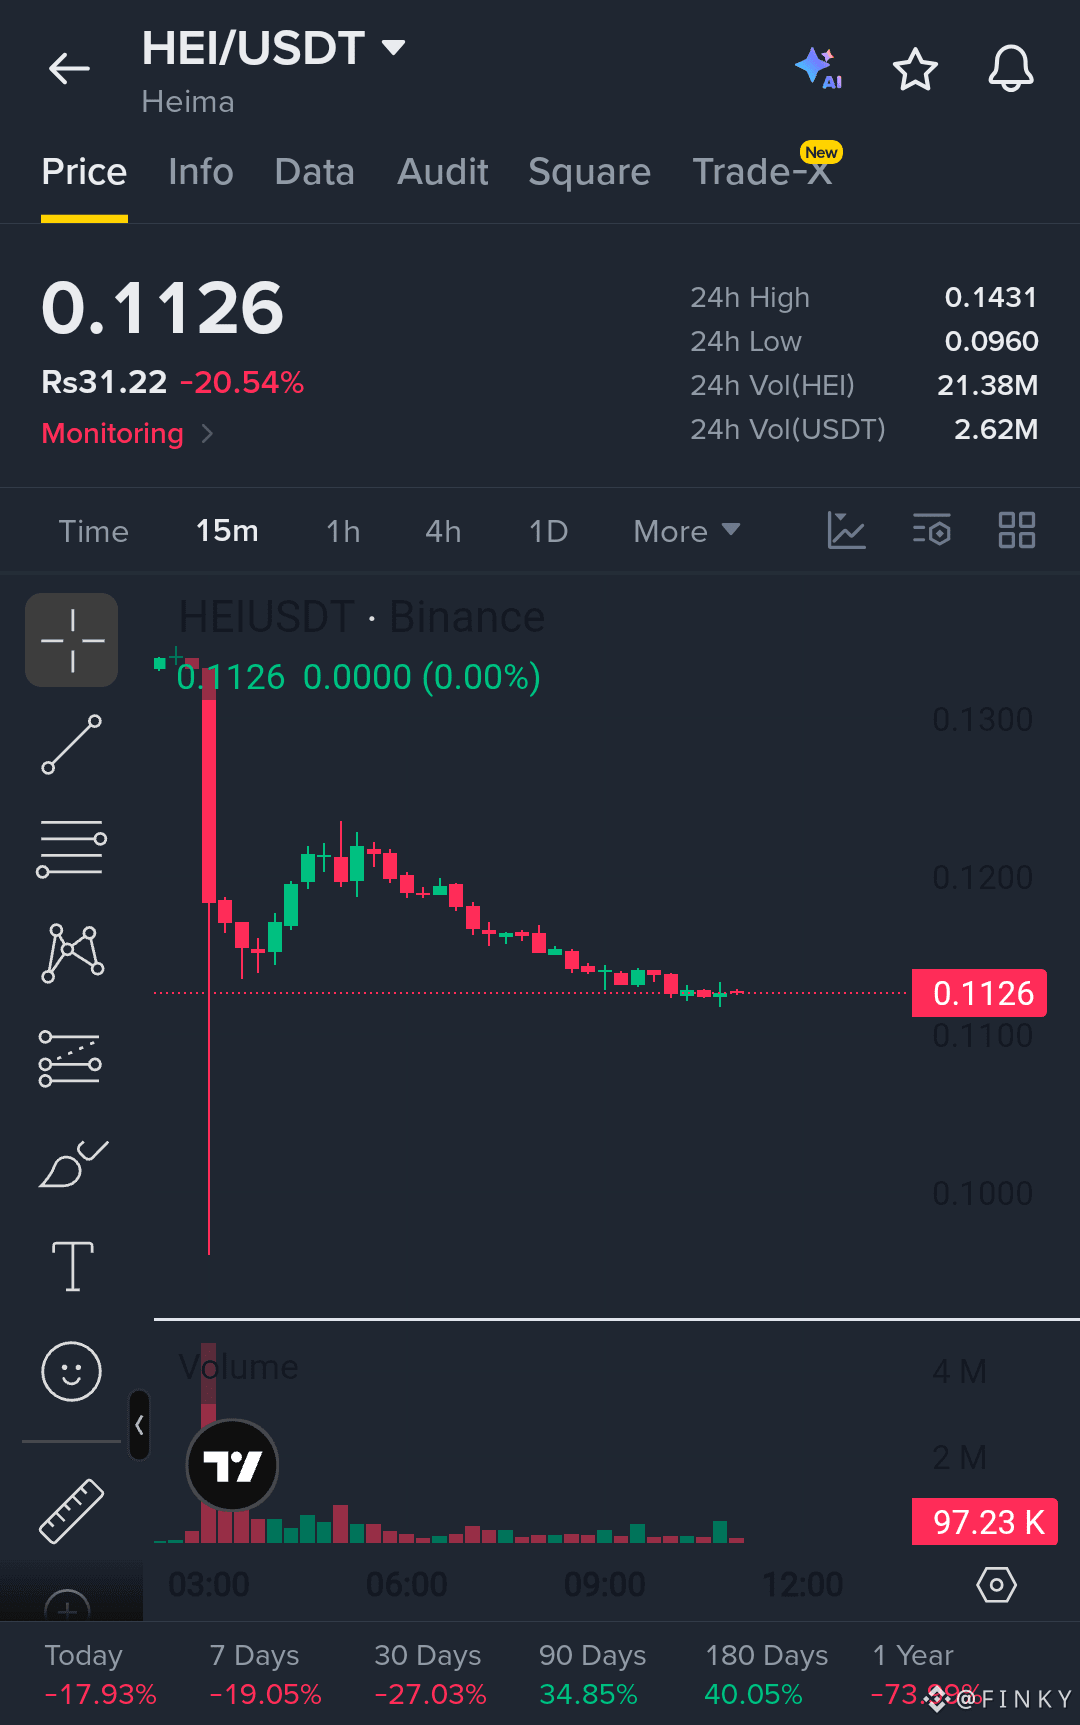
$HEI is showing strong bullish momentum. Buyers remain in control as the structure continues to hold.
Ep
0.1120 - 0.1135
TP
0.1160
0.1200
0.1240
Sl
0.1080
Liquidity was swept around 0.0960 and price reacted aggressively. Buyers reclaimed the structure, and consolidation above 0.1120 keeps continuation in play.
Let's go $HEI
{spot}(HEIUSDT)
#USADPWeeklyEmploymentRises12000 #BankOfAmericaGroupPilotsUSBDCStablecoin #RippleLobbiesToAdvanceCLARITYActVote
$HEI is showing strong bullish momentum. Buyers remain in control as the structure continues to hold.
Ep
0.1120 - 0.1135
TP
0.1160
0.1200
0.1240
Sl
0.1080
Liquidity was swept around 0.0960 and price reacted aggressively. Buyers reclaimed the structure, and consolidation above 0.1120 keeps continuation in play.
Let's go $HEI
#USADPWeeklyEmploymentRises12000 #BankOfAmericaGroupPilotsUSBDCStablecoin #RippleLobbiesToAdvanceCLARITYActVote
Ep
0.1120 - 0.1135
TP
0.1160
0.1200
0.1240
Sl
0.1080
Liquidity was swept around 0.0960 and price reacted aggressively. Buyers reclaimed the structure, and consolidation above 0.1120 keeps continuation in play.
Let's go $HEI
#USADPWeeklyEmploymentRises12000 #BankOfAmericaGroupPilotsUSBDCStablecoin #RippleLobbiesToAdvanceCLARITYActVote
50
·
--
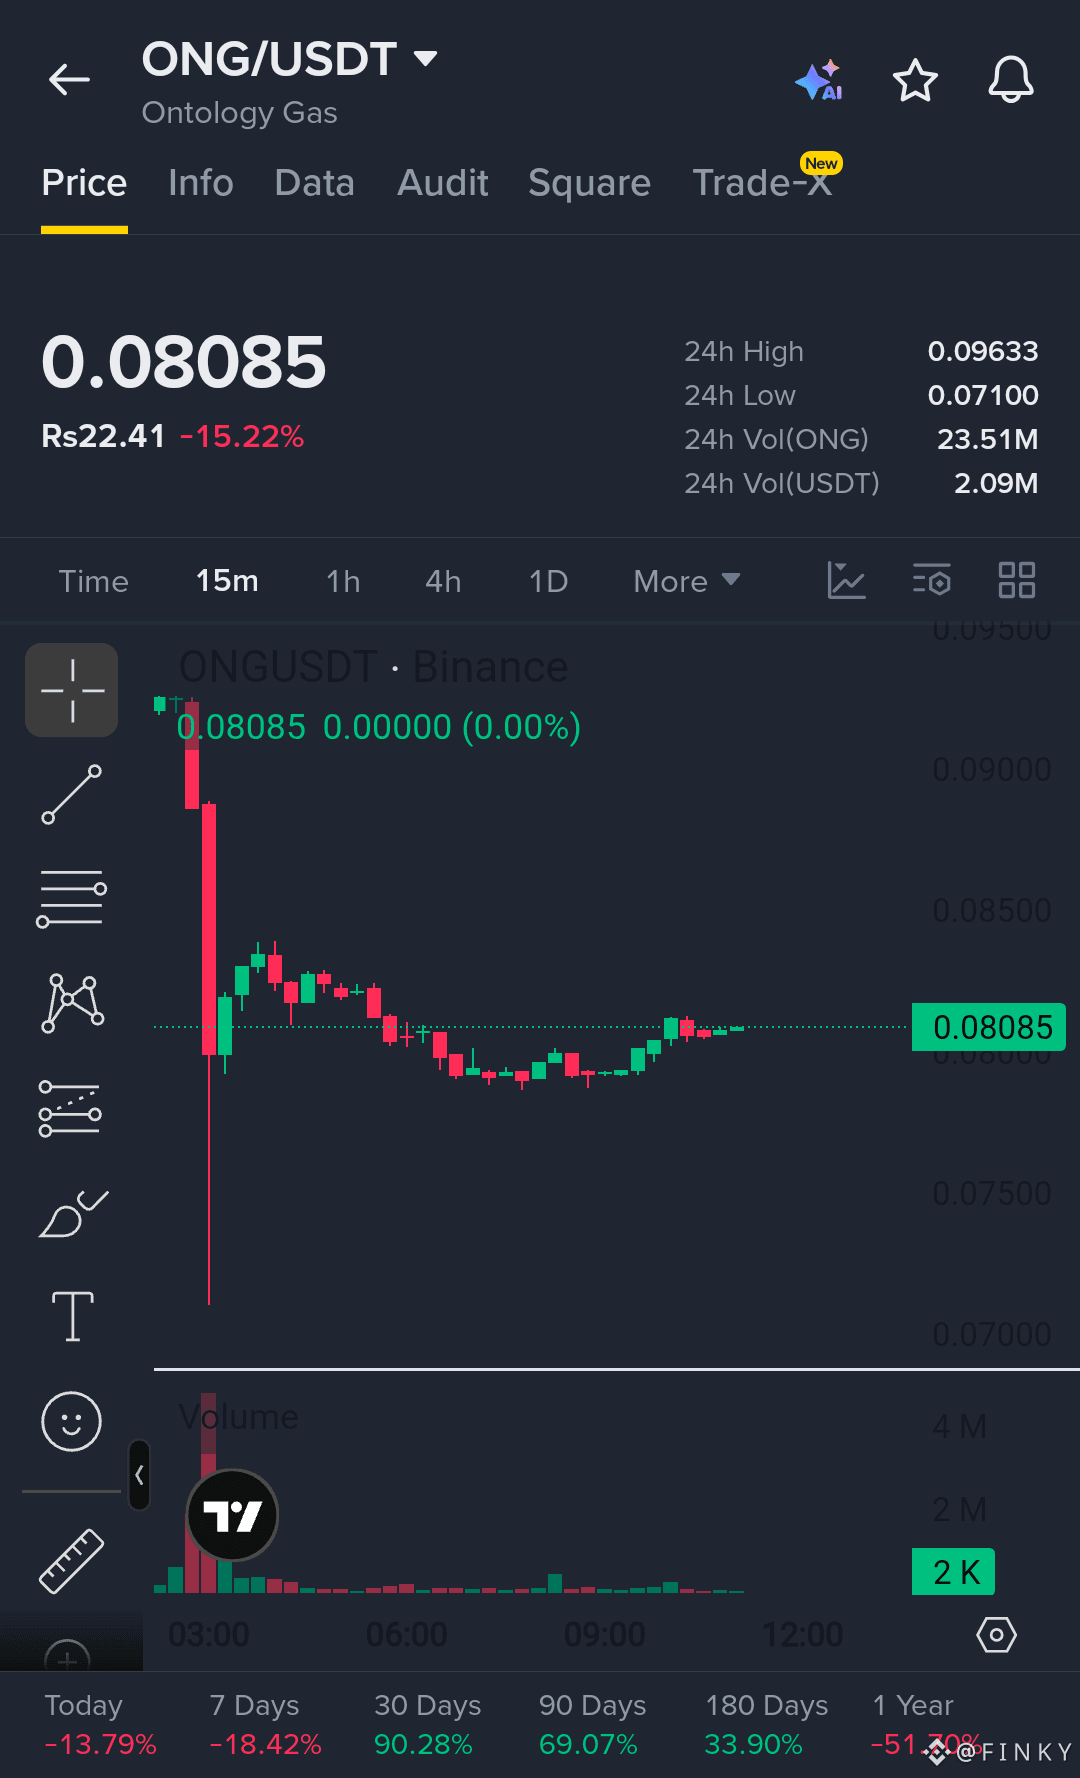
$ONG is showing strong bullish momentum. Buyers remain in control as the structure continues to hold.
Ep
0.0800 - 0.0810
TP
0.0830
0.0850
0.0880
Sl
0.0775
Liquidity was swept around 0.07100 and price reacted aggressively. Buyers reclaimed the structure, and consolidation above 0.0800 keeps continuation in play.
Let's go $ONG
{spot}(ONGUSDT)
#RippleLobbiesToAdvanceCLARITYActVote
$ONG is showing strong bullish momentum. Buyers remain in control as the structure continues to hold.
Ep
0.0800 - 0.0810
TP
0.0830
0.0850
0.0880
Sl
0.0775
Liquidity was swept around 0.07100 and price reacted aggressively. Buyers reclaimed the structure, and consolidation above 0.0800 keeps continuation in play.
Let's go $ONG
#RippleLobbiesToAdvanceCLARITYActVote
Ep
0.0800 - 0.0810
TP
0.0830
0.0850
0.0880
Sl
0.0775
Liquidity was swept around 0.07100 and price reacted aggressively. Buyers reclaimed the structure, and consolidation above 0.0800 keeps continuation in play.
Let's go $ONG
#RippleLobbiesToAdvanceCLARITYActVote
32
·
--
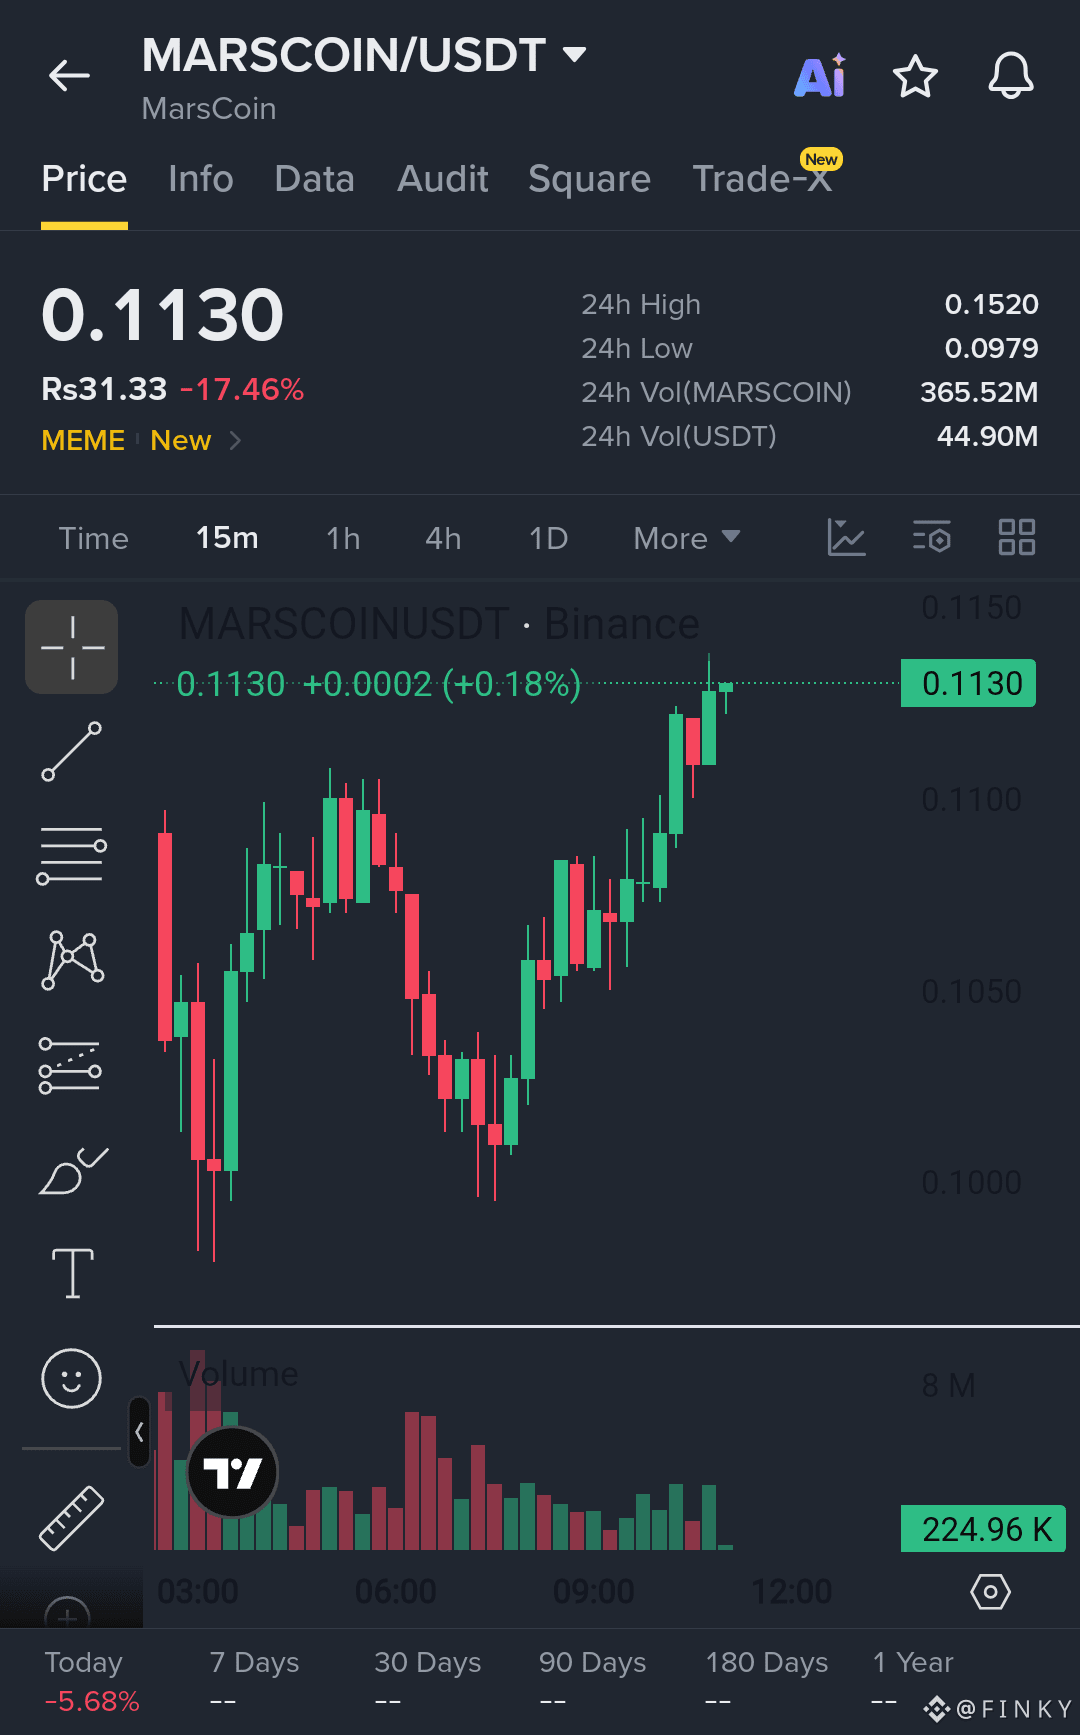
$MARSCOIN is showing strong bullish momentum. Buyers remain in control as the structure continues to hold.
Ep
0.1120 - 0.1135
TP
0.1150
0.1180
0.1220
Sl
0.1080
Liquidity was swept around 0.0979 and price reacted aggressively. Buyers reclaimed the structure, and consolidation above 0.1100 keeps continuation in play.
Let's go $MARSCOIN
{spot}(MARSCOINUSDT)
$MARSCOIN is showing strong bullish momentum. Buyers remain in control as the structure continues to hold.
Ep
0.1120 - 0.1135
TP
0.1150
0.1180
0.1220
Sl
0.1080
Liquidity was swept around 0.0979 and price reacted aggressively. Buyers reclaimed the structure, and consolidation above 0.1100 keeps continuation in play.
Let's go $MARSCOIN
Ep
0.1120 - 0.1135
TP
0.1150
0.1180
0.1220
Sl
0.1080
Liquidity was swept around 0.0979 and price reacted aggressively. Buyers reclaimed the structure, and consolidation above 0.1100 keeps continuation in play.
Let's go $MARSCOIN
1
243
·
--
Bullish
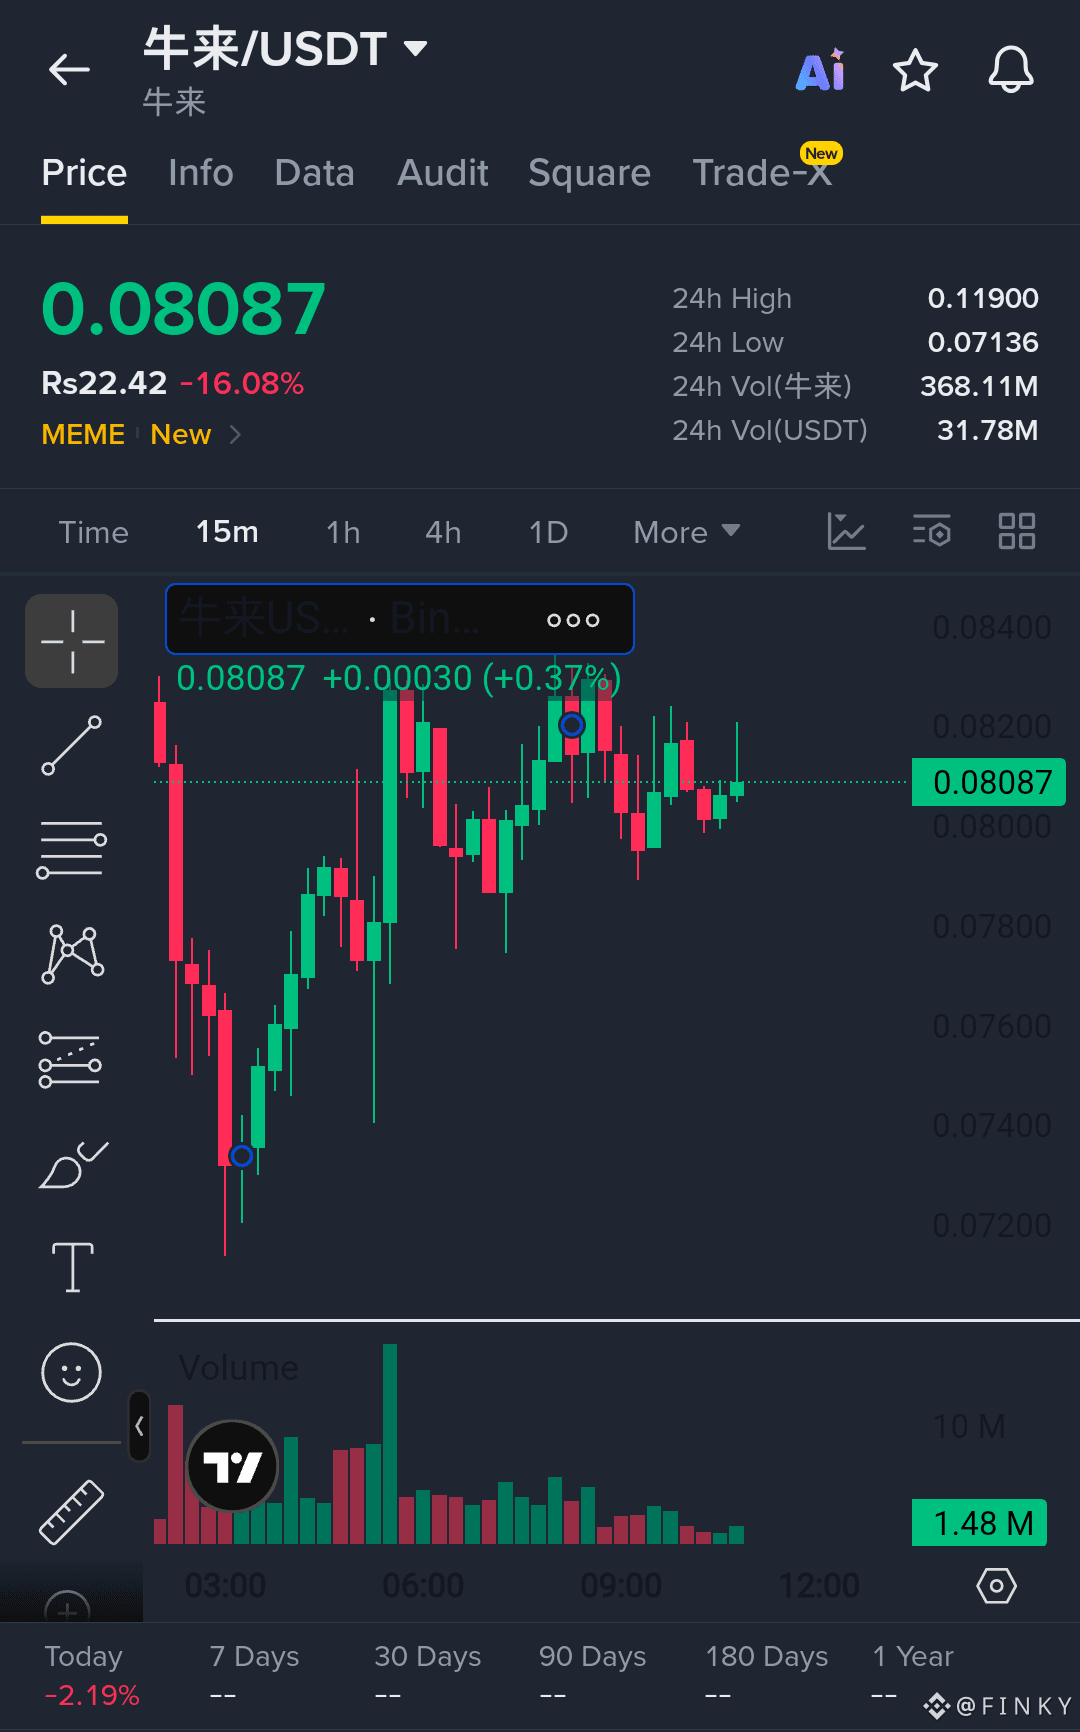
$牛来 is showing strong bullish momentum. Buyers remain in control as the structure continues to hold.
Ep
0.0800 - 0.0810
TP
0.0820
0.0840
0.0870
Sl
0.0770
Liquidity was swept around 0.07136 and price reacted aggressively. Buyers reclaimed the structure, and consolidation above 0.0800 keeps continuation in play.
Let's go $牛来
{spot}(牛来USDT)
$牛来 is showing strong bullish momentum. Buyers remain in control as the structure continues to hold.
Ep
0.0800 - 0.0810
TP
0.0820
0.0840
0.0870
Sl
0.0770
Liquidity was swept around 0.07136 and price reacted aggressively. Buyers reclaimed the structure, and consolidation above 0.0800 keeps continuation in play.
Let's go $牛来
Ep
0.0800 - 0.0810
TP
0.0820
0.0840
0.0870
Sl
0.0770
Liquidity was swept around 0.07136 and price reacted aggressively. Buyers reclaimed the structure, and consolidation above 0.0800 keeps continuation in play.
Let's go $牛来
281
·
--
Bullish
🚨👈Fresh Market Watch — Some New Names Are Getting Attention
The market is showing some interesting new entries, and the numbers are definitely worth watching.
$牛来 is trading around 0.07988, with a 24h change of -17.10%. That is a sharp move and puts it on the radar for traders looking for high-volatility opportunities.
CRMB — Salesforce (bStocks)
Price: 244.44
Approx. value: Rs67,797.88
24h change: -1.88%
HIMSB — Hims & Hers (bStocks)
Price: 27.84
Approx. value: Rs7,721.7
24h change: -1.17%
$MARSCOIN — MarsCoin
Price: 0.1068
Approx. value: Rs29.62
24h change: -17.27%
CRWDB — CrowdStrike (bStocks)
Price: 207.69
Approx. value: Rs57,604.9
24h change: -0.96%
What stands out immediately is the difference in volatility. MARSCOIN and 牛来 are showing moves above 17% in 24 hours, while CRWDB, $HIMSB , and CRMB are moving much less.
These are the kind of numbers that can change quickly, so keep an eye on price action, volume, and market conditions before making any decision.
The screen is showing movement — now the real game is watching what happens next.
{spot}(牛来USDT)
{spot}(HIMSBUSDT)
{spot}(MARSCOINUSDT)
#US10YTreasuryYieldHitsHighestSinceNov2023 #BankOfAmericaGroupPilotsUSBDCStablecoin #RippleLobbiesToAdvanceCLARITYActVote #USADPWeeklyEmploymentRises12000 #RippleLobbiesToAdvanceCLARITYActVote
🚨👈Fresh Market Watch — Some New Names Are Getting Attention
The market is showing some interesting new entries, and the numbers are definitely worth watching.
$牛来 is trading around 0.07988, with a 24h change of -17.10%. That is a sharp move and puts it on the radar for traders looking for high-volatility opportunities.
CRMB — Salesforce (bStocks)
Price: 244.44
Approx. value: Rs67,797.88
24h change: -1.88%
HIMSB — Hims & Hers (bStocks)
Price: 27.84
Approx. value: Rs7,721.7
24h change: -1.17%
$MARSCOIN — MarsCoin
Price: 0.1068
Approx. value: Rs29.62
24h change: -17.27%
CRWDB — CrowdStrike (bStocks)
Price: 207.69
Approx. value: Rs57,604.9
24h change: -0.96%
What stands out immediately is the difference in volatility. MARSCOIN and 牛来 are showing moves above 17% in 24 hours, while CRWDB, $HIMSB , and CRMB are moving much less.
These are the kind of numbers that can change quickly, so keep an eye on price action, volume, and market conditions before making any decision.
The screen is showing movement — now the real game is watching what happens next.
#US10YTreasuryYieldHitsHighestSinceNov2023 #BankOfAmericaGroupPilotsUSBDCStablecoin #RippleLobbiesToAdvanceCLARITYActVote #USADPWeeklyEmploymentRises12000 #RippleLobbiesToAdvanceCLARITYActVote
The market is showing some interesting new entries, and the numbers are definitely worth watching.
$牛来 is trading around 0.07988, with a 24h change of -17.10%. That is a sharp move and puts it on the radar for traders looking for high-volatility opportunities.
CRMB — Salesforce (bStocks)
Price: 244.44
Approx. value: Rs67,797.88
24h change: -1.88%
HIMSB — Hims & Hers (bStocks)
Price: 27.84
Approx. value: Rs7,721.7
24h change: -1.17%
$MARSCOIN — MarsCoin
Price: 0.1068
Approx. value: Rs29.62
24h change: -17.27%
CRWDB — CrowdStrike (bStocks)
Price: 207.69
Approx. value: Rs57,604.9
24h change: -0.96%
What stands out immediately is the difference in volatility. MARSCOIN and 牛来 are showing moves above 17% in 24 hours, while CRWDB, $HIMSB , and CRMB are moving much less.
These are the kind of numbers that can change quickly, so keep an eye on price action, volume, and market conditions before making any decision.
The screen is showing movement — now the real game is watching what happens next.
#US10YTreasuryYieldHitsHighestSinceNov2023 #BankOfAmericaGroupPilotsUSBDCStablecoin #RippleLobbiesToAdvanceCLARITYActVote #USADPWeeklyEmploymentRises12000 #RippleLobbiesToAdvanceCLARITYActVote
3
587
·
--
Bullish
🚨The Alpha board is heating up, and there are some serious moves happening right now.
A quick look at the market shows a mix of strong momentum and heavy pullbacks. Some tokens are moving fast, while others are facing sharp pressure.
$4Stock (4STOCK)
Last Price: 0.033171
PKR: Rs 9.19706
24H Change: -36.45%
$MEME
Last Price: 0.064986
PKR: Rs 18.01
24H Change: -21.54%
Canopy (CNPY)
Last Price: 0.20275
PKR: Rs 56.21
24H Change: +2.17%
Palu (PALU)
Last Price: 0.0023609
PKR: Rs 0.65459
24H Change: +45.58%
$BTR Token (BTR)
Last Price: 0.062863
PKR: Rs 17.42
24H Change: +23.73%
The biggest move on this screen is PALU with a massive +45.58%, followed by BTR at +23.73%. On the other side, 4Stock is down -36.45%, making this a very active and volatile market snapshot.
These numbers can change quickly, so keep your eyes on price action and manage your risk carefully.
The Alpha board is moving. Stay alert, watch the levels, and$ trade smart.
{future}(BTRUSDT)
{alpha}(46630x385f4f8ae47651ce5f58f5265395a669f8281e18)
#US10YTreasuryYieldHitsHighestSinceNov2023 #USADPWeeklyEmploymentRises12000 #RippleLobbiesToAdvanceCLARITYActVote #LAPTOPFoundationXAccountSuspended #LAPTOPFoundationXAccountSuspended
🚨The Alpha board is heating up, and there are some serious moves happening right now.
A quick look at the market shows a mix of strong momentum and heavy pullbacks. Some tokens are moving fast, while others are facing sharp pressure.
$4Stock (4STOCK)
Last Price: 0.033171
PKR: Rs 9.19706
24H Change: -36.45%
$MEME
Last Price: 0.064986
PKR: Rs 18.01
24H Change: -21.54%
Canopy (CNPY)
Last Price: 0.20275
PKR: Rs 56.21
24H Change: +2.17%
Palu (PALU)
Last Price: 0.0023609
PKR: Rs 0.65459
24H Change: +45.58%
$BTR Token (BTR)
Last Price: 0.062863
PKR: Rs 17.42
24H Change: +23.73%
The biggest move on this screen is PALU with a massive +45.58%, followed by BTR at +23.73%. On the other side, 4Stock is down -36.45%, making this a very active and volatile market snapshot.
These numbers can change quickly, so keep your eyes on price action and manage your risk carefully.
The Alpha board is moving. Stay alert, watch the levels, and$ trade smart.
#US10YTreasuryYieldHitsHighestSinceNov2023 #USADPWeeklyEmploymentRises12000 #RippleLobbiesToAdvanceCLARITYActVote #LAPTOPFoundationXAccountSuspended #LAPTOPFoundationXAccountSuspended
A quick look at the market shows a mix of strong momentum and heavy pullbacks. Some tokens are moving fast, while others are facing sharp pressure.
$4Stock (4STOCK)
Last Price: 0.033171
PKR: Rs 9.19706
24H Change: -36.45%
$MEME
Last Price: 0.064986
PKR: Rs 18.01
24H Change: -21.54%
Canopy (CNPY)
Last Price: 0.20275
PKR: Rs 56.21
24H Change: +2.17%
Palu (PALU)
Last Price: 0.0023609
PKR: Rs 0.65459
24H Change: +45.58%
$BTR Token (BTR)
Last Price: 0.062863
PKR: Rs 17.42
24H Change: +23.73%
The biggest move on this screen is PALU with a massive +45.58%, followed by BTR at +23.73%. On the other side, 4Stock is down -36.45%, making this a very active and volatile market snapshot.
These numbers can change quickly, so keep your eyes on price action and manage your risk carefully.
The Alpha board is moving. Stay alert, watch the levels, and$ trade smart.
#US10YTreasuryYieldHitsHighestSinceNov2023 #USADPWeeklyEmploymentRises12000 #RippleLobbiesToAdvanceCLARITYActVote #LAPTOPFoundationXAccountSuspended #LAPTOPFoundationXAccountSuspended
Canopy
4Stock
MEME
BTR
8 hr(s) left
3
1.7k
·
--
Bullish
$IOST is making some serious noise right now.
The market is heating up, and IOST is standing out with a massive +94.41% move in 24 hours. Price is currently around 0.001668, showing strong momentum and heavy attention from traders.
But IOST isn’t the only one moving. The gainers list is getting interesting:
$IOST — 0.001668 | +94.41%
$VTHO — 0.000727 | +63.00%
$KAT — 0.00580 | +19.10%
$MINA — 0.0929 | +13.71%
— 0.000850 | +13.03%
These numbers show just how quickly momentum can build in the crypto market. is clearly grabbing the spotlight, while is also showing a strong move.
Keep your eyes open, manage risk carefully, and watch the market closely. Moves like these can change fast.
The action is getting interesting. Let’s see what comes next.
{spot}(SCUSDT)
{spot}(VTHOUSDT)
{spot}(IOSTUSDT)
#USADPWeeklyEmploymentRises12000 #BankOfAmericaGroupPilotsUSBDCStablecoin #RippleLobbiesToAdvanceCLARITYActVote #LAPTOPFoundationXAccountSuspended #ChinaAugustCPIRises0.8%YoY
$IOST is making some serious noise right now.
The market is heating up, and IOST is standing out with a massive +94.41% move in 24 hours. Price is currently around 0.001668, showing strong momentum and heavy attention from traders.
But IOST isn’t the only one moving. The gainers list is getting interesting:
$IOST — 0.001668 | +94.41%
$VTHO — 0.000727 | +63.00%
$KAT — 0.00580 | +19.10%
$MINA — 0.0929 | +13.71%
— 0.000850 | +13.03%
These numbers show just how quickly momentum can build in the crypto market. is clearly grabbing the spotlight, while is also showing a strong move.
Keep your eyes open, manage risk carefully, and watch the market closely. Moves like these can change fast.
The action is getting interesting. Let’s see what comes next.
#USADPWeeklyEmploymentRises12000 #BankOfAmericaGroupPilotsUSBDCStablecoin #RippleLobbiesToAdvanceCLARITYActVote #LAPTOPFoundationXAccountSuspended #ChinaAugustCPIRises0.8%YoY
The market is heating up, and IOST is standing out with a massive +94.41% move in 24 hours. Price is currently around 0.001668, showing strong momentum and heavy attention from traders.
But IOST isn’t the only one moving. The gainers list is getting interesting:
$IOST — 0.001668 | +94.41%
$VTHO — 0.000727 | +63.00%
$KAT — 0.00580 | +19.10%
$MINA — 0.0929 | +13.71%
— 0.000850 | +13.03%
These numbers show just how quickly momentum can build in the crypto market. is clearly grabbing the spotlight, while is also showing a strong move.
Keep your eyes open, manage risk carefully, and watch the market closely. Moves like these can change fast.
The action is getting interesting. Let’s see what comes next.
#USADPWeeklyEmploymentRises12000 #BankOfAmericaGroupPilotsUSBDCStablecoin #RippleLobbiesToAdvanceCLARITYActVote #LAPTOPFoundationXAccountSuspended #ChinaAugustCPIRises0.8%YoY
$SC
$VTHO
$IOST
$MINA
6 hr(s) left
1
2.9k
·
--
Bullish
$ZAMA — A fresh move is taking shape
$ZAMA is holding strong around 0.05237 USDT, with a +1.97% gain over the last 24 hours.
The 15m chart shows a solid recovery after the pullback near 0.0509, followed by a series of higher moves back toward the 0.0525 area. Price is now trading close to the 24H high, keeping the setup interesting.
Current Price: 0.05237 USDT
24H High: 0.05251 USDT
24H Low: 0.05051 USDT
24H Volume: 46.81M ZAMA
24H USDT Volume: 2.40M USDT
Performance:
Today: +3.25%
7 Days: +5.35%
30 Days: +17.29%
90 Days: +69.07%
180 Days: +143.42%
The recent candles show buyers stepping back in after the dip, while trading activity remains active. With sitting near its daily high, the next moves could be interesting to watch.
Strong recovery. Active volume. $ZAMA is getting attention.
Let's go and Trade now
{spot}(ZAMAUSDT)
#USADPWeeklyEmploymentRises12000 #RippleLobbiesToAdvanceCLARITYActVote #ChinaAugustCPIRises0.8%YoY #USStrikesTargetsNearHormuzAndJask #OilRisesToHighestSinceJuly
$ZAMA — A fresh move is taking shape
$ZAMA is holding strong around 0.05237 USDT, with a +1.97% gain over the last 24 hours.
The 15m chart shows a solid recovery after the pullback near 0.0509, followed by a series of higher moves back toward the 0.0525 area. Price is now trading close to the 24H high, keeping the setup interesting.
Current Price: 0.05237 USDT
24H High: 0.05251 USDT
24H Low: 0.05051 USDT
24H Volume: 46.81M ZAMA
24H USDT Volume: 2.40M USDT
Performance:
Today: +3.25%
7 Days: +5.35%
30 Days: +17.29%
90 Days: +69.07%
180 Days: +143.42%
The recent candles show buyers stepping back in after the dip, while trading activity remains active. With sitting near its daily high, the next moves could be interesting to watch.
Strong recovery. Active volume. $ZAMA is getting attention.
Let's go and Trade now
#USADPWeeklyEmploymentRises12000 #RippleLobbiesToAdvanceCLARITYActVote #ChinaAugustCPIRises0.8%YoY #USStrikesTargetsNearHormuzAndJask #OilRisesToHighestSinceJuly
$ZAMA is holding strong around 0.05237 USDT, with a +1.97% gain over the last 24 hours.
The 15m chart shows a solid recovery after the pullback near 0.0509, followed by a series of higher moves back toward the 0.0525 area. Price is now trading close to the 24H high, keeping the setup interesting.
Current Price: 0.05237 USDT
24H High: 0.05251 USDT
24H Low: 0.05051 USDT
24H Volume: 46.81M ZAMA
24H USDT Volume: 2.40M USDT
Performance:
Today: +3.25%
7 Days: +5.35%
30 Days: +17.29%
90 Days: +69.07%
180 Days: +143.42%
The recent candles show buyers stepping back in after the dip, while trading activity remains active. With sitting near its daily high, the next moves could be interesting to watch.
Strong recovery. Active volume. $ZAMA is getting attention.
Let's go and Trade now
#USADPWeeklyEmploymentRises12000 #RippleLobbiesToAdvanceCLARITYActVote #ChinaAugustCPIRises0.8%YoY #USStrikesTargetsNearHormuzAndJask #OilRisesToHighestSinceJuly
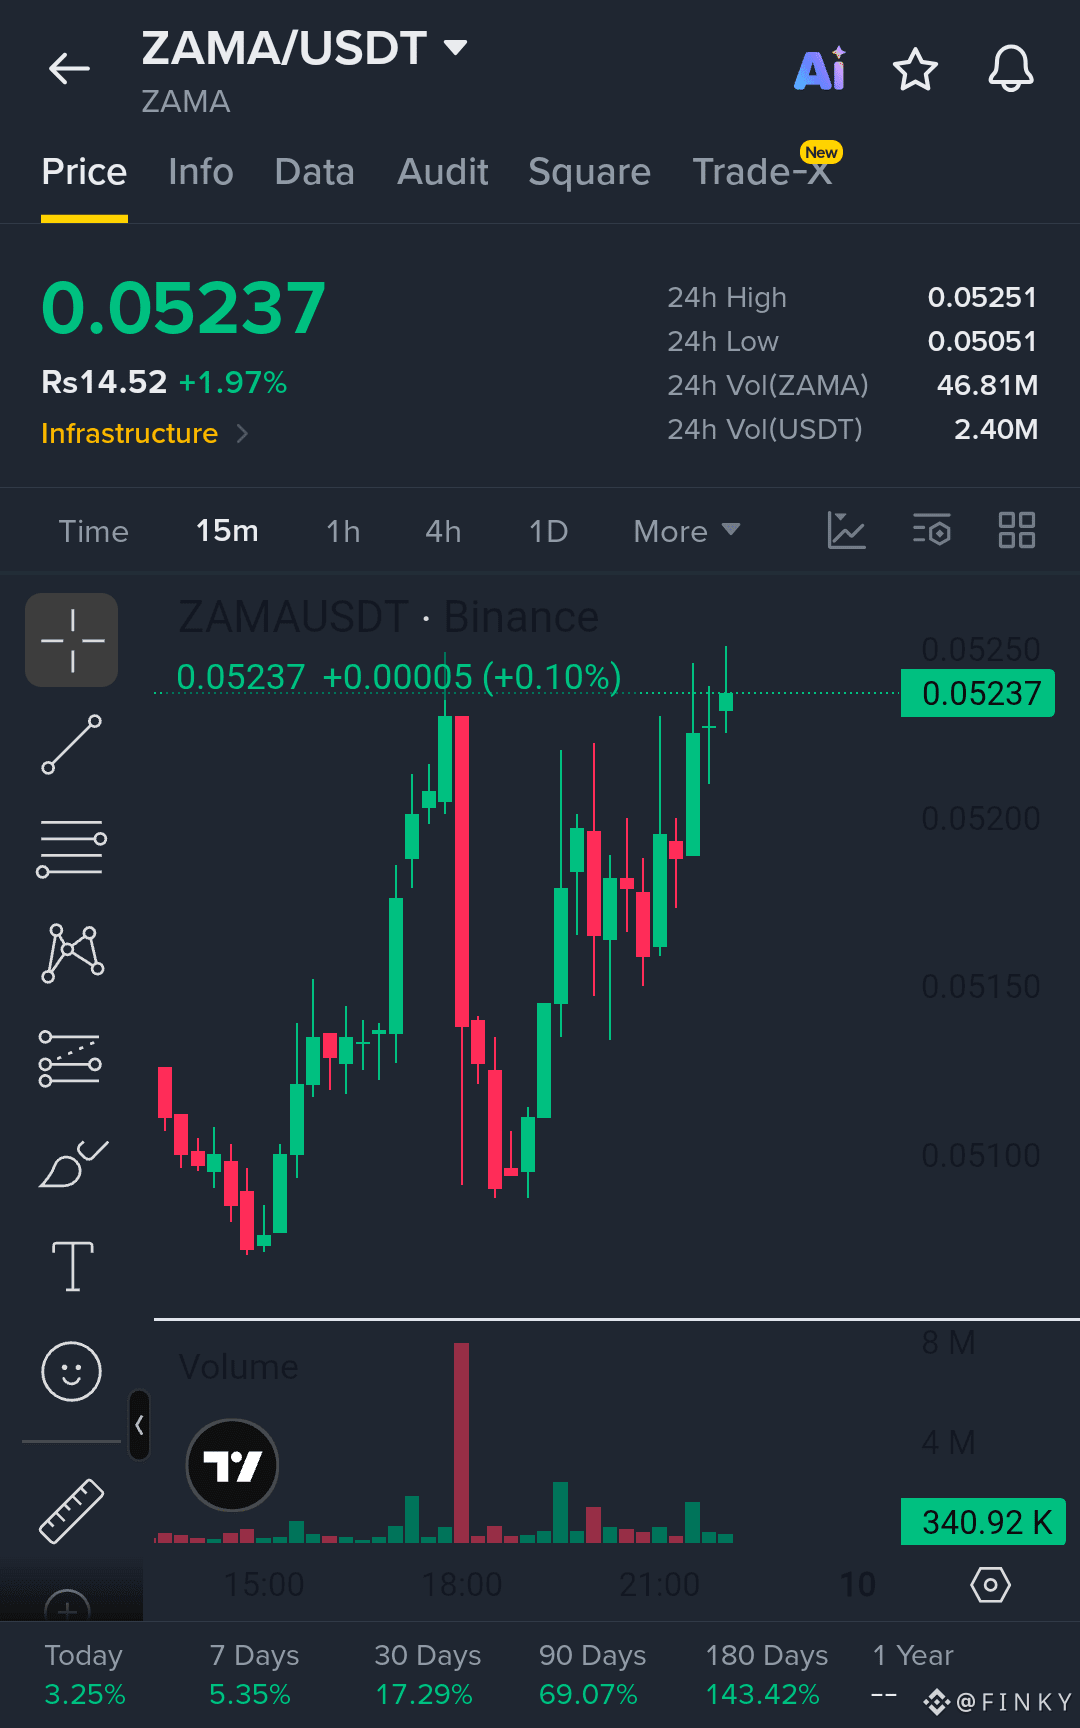
1
65
Log in to explore more content
Join global crypto users on Binance Square
⚡️ Get latest and useful information about crypto.
💬 Trusted by the world’s largest crypto exchange.
👍 Discover real insights from verified creators.
Email / Phone number
Trending Topics
USAugustPPIRisesLessThanExpected
28,701 views
596 Discussing
🚨 US AUG PPI: Rises LESS Than Expected! Bullish for Crypto? 🚀
PPI +0.4% MoM as expected, but CORE PPI only +0.2% vs +0.3% expected - cooling!
What it means:
• Wholesale inflation softer than feared
• Fed rate hike chance now 62% - but dovish signals coming
• Core PCE revisions expected downward - bullish
• BTC usually pumps on softer PPI
Fed meeting Sep 15-16 - Market now expects pause, not hike?
Is this the green light for Q4 rally?
#Bitcoin #PPI #Fed #CryptoNews #BTC#usaugustppiriseslessthanexpected
True News
·1 Likes
·1.3k views
SECApprovesNasdaqTexasCommodityTrustRule
18,671 views
456 Discussing
ECBRaisesRatesSecondTimeTo2.5%
15,472 views
336 Discussing