


On the morning of the 6th, the market went sideways for a week, and then started to rise continuously at noon, with an increase of 2.5%, reaching a high of 31557. The rising market indicators are very beautiful. According to the quantitative indicator model, at 17:20, the first falling green column appeared on the 10-minute line, and it is necessary to be alert to the trend change. If two green columns are drawn in succession, consider selling long orders to stop profit and consider shorting positions.
The strategy model can give clear indicators of the market's downward trend 10 minutes in advance at 17:20-17:30. Combined with yesterday's bearish outlook at 30,000 points, the decline reached about 4%. Friends who followed the short-term trend and went short in the afternoon will have their profits doubled directly, and you can have chicken legs for lunch tomorrow!
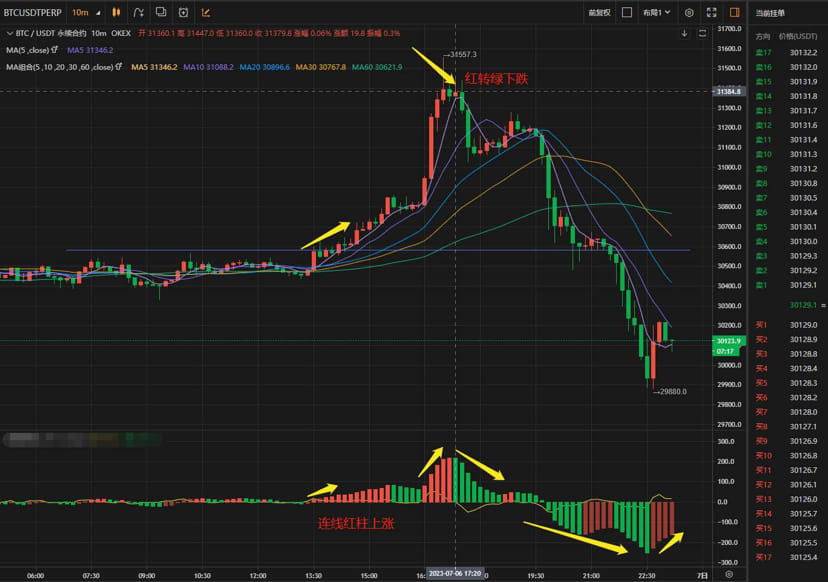
In the evening market, the 15-minute line seemed to be bottoming out and rebounding, and today it also fell to the 30,000 point position, with a minimum of 29,880. However, those who are conservative in the hourly K-line still need to wait for 30,000 points to take long orders. Aggressive ones can enter with small positions, and a two-way hedging strategy is also acceptable.
The rebound of the 15-minute line is not very strong, and there is no support from trading volume. I am not optimistic that the 15-minute short-term line will directly pull up, and it is more likely to continue to fall.
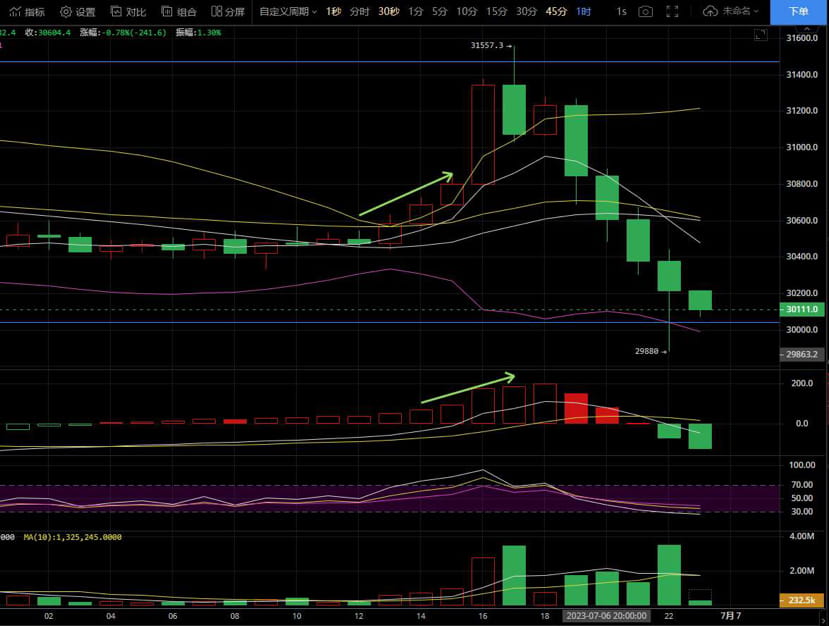
Trading suggestion: Take long orders at 30,000 points, and rebound to 30,300 and 30,520. Move upward after passing the pressure level, but the daily and 4-hour lines are still bearish.
Pay attention to the quantitative strategy model, use the data model to reduce the dimension, and do a good job of trading risk control! If you are interested, you can pay attention to it, cooperate for mutual benefit, and counterattack together! $BTC $ETH