
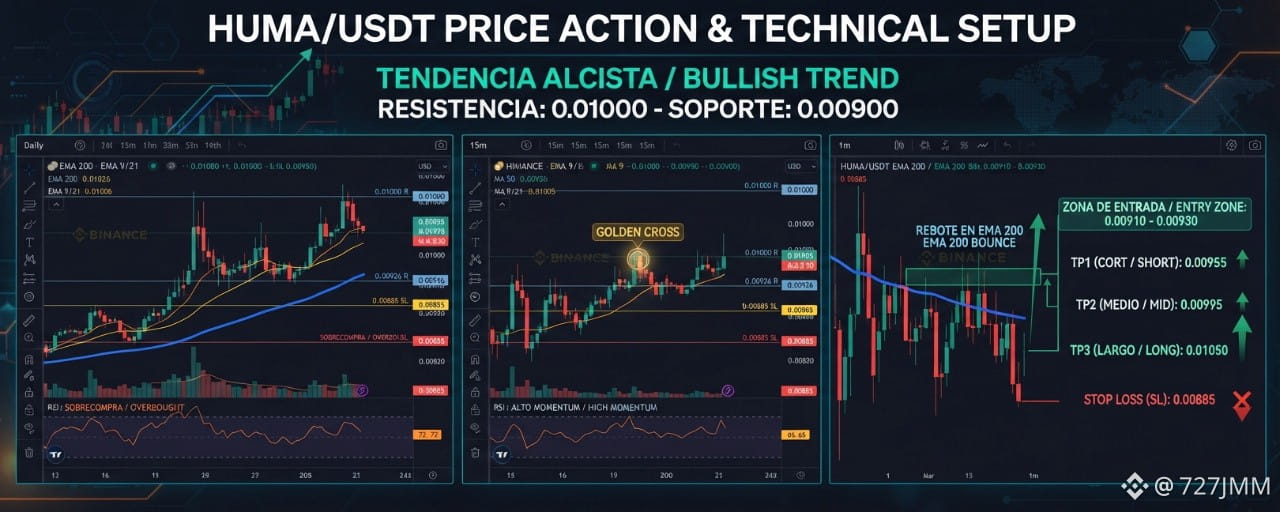


Situation analysis
EMA (9, 21, 200) and MA (50, 100): On the daily timeframe, the price’s relative position to the EMA 200 and MA 100 defines the macro bias, while crossovers between EMA 9/21 and MA 50 signal short-term momentum on the 15m and 1m timeframes (watching for possible Golden or Death Crosses depending on momentum).
Key levels and Fibonacci: Watch the psychological level of $0.00900 as immediate support and $0.01000 as psychological resistance, along with Fibonacci retracements/extensions from the latest significant swing.
RSI and Volume: Check whether the RSI shows divergences or exits oversold/overbought territory on 15m/1m, always confirming with volume expansion (avoid entries on breakouts without volume).
Structure: Identify whether the price is consolidating in a range/accumulation or breaking structure with a clear direction.
Trade Setup (Reference Setup)
Ideal entry zone: $0.00910 – $0.00930 (subject to confirmation on 15m/1m).
TP1 (Conservative): $0.00955
TP2 (Intermediate): $0.00995
TP3 (Moonshot): $0.01050
Stop Loss (SL): $0.00885 (mandatory invalidation if support and structure fail)
Trade Range We enter only if the price defends the nearby support zone at $0.00910–$0.00930 with a clear reaction on 1m/15m and accompanying volume; if it breaks and closes below $0.00885, the setup is invalidated.