
👋 Hello buddies! Hope you're doing great!
Let's check two interesting charts today: SUI and HYPE. Both are showing important price reactions, but their potential setups are quite different. 👀
Let's break them down!
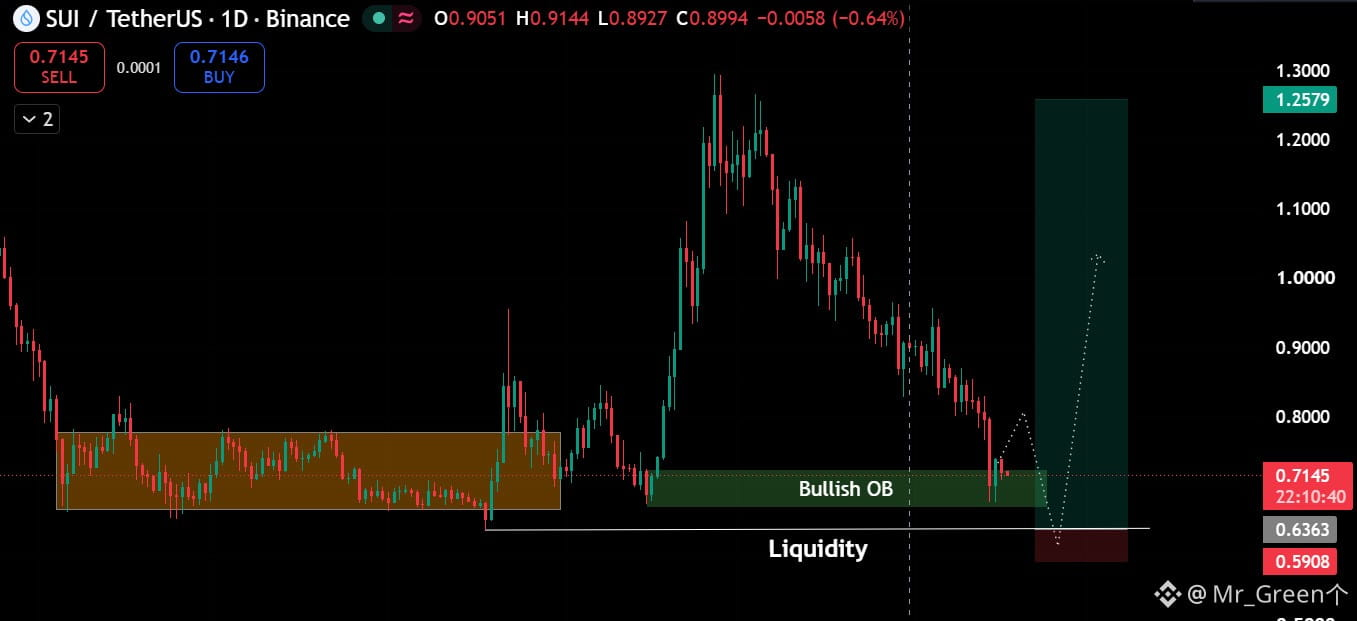
🔵 1. $SUI — BULLISH OB + LIQUIDITY SWEEP?
SUI has been under considerable selling pressure after falling from the $1.30 region. However, price is now approaching an interesting bullish order block around $0.66–$0.72.
Here's what I'm watching:
$0.66–$0.72: Important bullish OB zone.
$0.636: Liquidity level below support.
$0.59: Potential invalidation area.
$0.80: First recovery target.
$1.00–$1.05: Further upside resistance.
My expectation is that SUI could sweep liquidity below $0.636, react from the demand zone, and potentially begin a recovery.
But remember, we need confirmation from buyers before calling it a reversal.
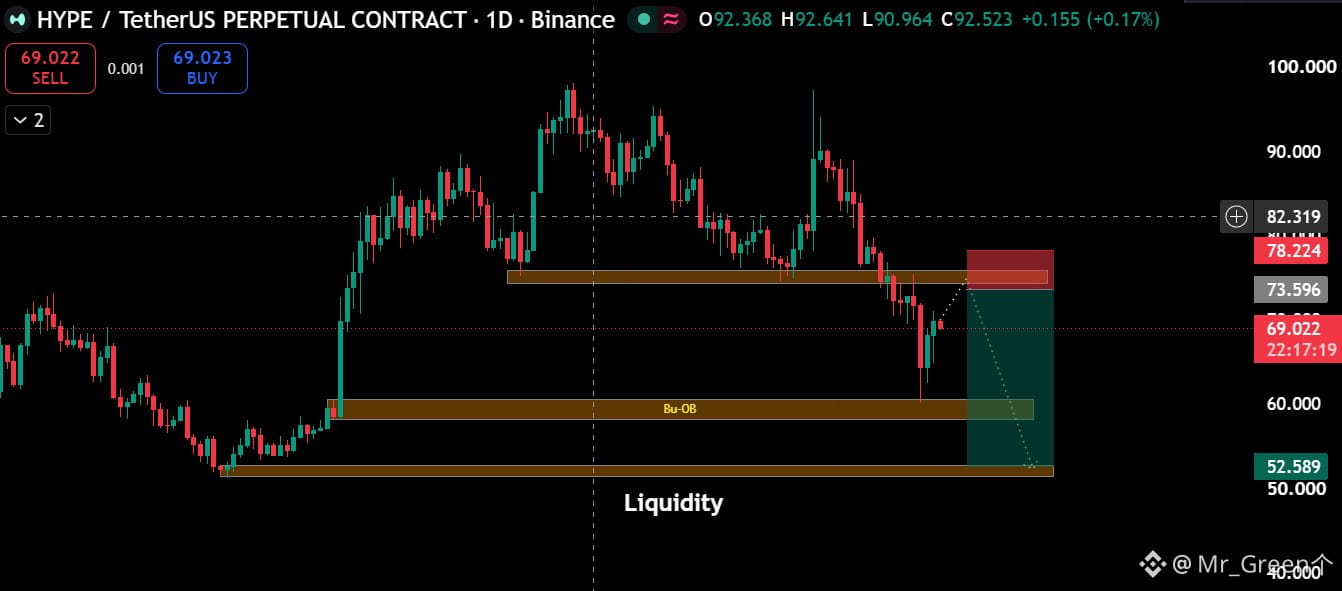
🔴 2. $HYPE — BEARISH STRUCTURE, MORE DOWNSIDE POSSIBLE!
HYPE has also experienced a significant correction after reaching the $95–$100 region.
The previous support around $73–$76 has been broken, and price is currently trading near $69.
Key levels:
$73–$76: Broken support, now resistance.
$78.22: Potential invalidation level.
$59–$60: Important bearish OB / demand zone.
$52.59: Major liquidity target.
I'm watching for a possible relief bounce toward $73–$76 before another bearish move.
If sellers regain control around that resistance, HYPE could move toward $60 and potentially $52.59.
⚠️ MY TAKE:
Both charts are interesting, but I'm watching different opportunities.
For $SUI, I'm looking for a potential liquidity sweep followed by bullish confirmation.
For $HYPE, I'm watching a possible resistance retest before bearish continuation.
Nothing is confirmed yet, so patience is important!
💬 What do you think, buddies? Which setup looks more interesting to you — SUI recovery or HYPE downside?
Follow for more crypto chart analysis! ❤️
#BinanceSquare
Let's check two interesting charts today: SUI and HYPE. Both are showing important price reactions, but their potential setups are quite different. 👀
Let's break them down!
🔵 1. $SUI — BULLISH OB + LIQUIDITY SWEEP?
SUI has been under considerable selling pressure after falling from the $1.30 region. However, price is now approaching an interesting bullish order block around $0.66–$0.72.
Here's what I'm watching:
$0.66–$0.72: Important bullish OB zone.
$0.636: Liquidity level below support.
$0.59: Potential invalidation area.
$0.80: First recovery target.
$1.00–$1.05: Further upside resistance.
My expectation is that SUI could sweep liquidity below $0.636, react from the demand zone, and potentially begin a recovery.
But remember, we need confirmation from buyers before calling it a reversal.
🔴 2. $HYPE — BEARISH STRUCTURE, MORE DOWNSIDE POSSIBLE!
HYPE has also experienced a significant correction after reaching the $95–$100 region.
The previous support around $73–$76 has been broken, and price is currently trading near $69.
Key levels:
$73–$76: Broken support, now resistance.
$78.22: Potential invalidation level.
$59–$60: Important bearish OB / demand zone.
$52.59: Major liquidity target.
I'm watching for a possible relief bounce toward $73–$76 before another bearish move.
If sellers regain control around that resistance, HYPE could move toward $60 and potentially $52.59.
⚠️ MY TAKE:
Both charts are interesting, but I'm watching different opportunities.
For $SUI, I'm looking for a potential liquidity sweep followed by bullish confirmation.
For $HYPE, I'm watching a possible resistance retest before bearish continuation.
Nothing is confirmed yet, so patience is important!
💬 What do you think, buddies? Which setup looks more interesting to you — SUI recovery or HYPE downside?
Follow for more crypto chart analysis! ❤️
#BinanceSquare