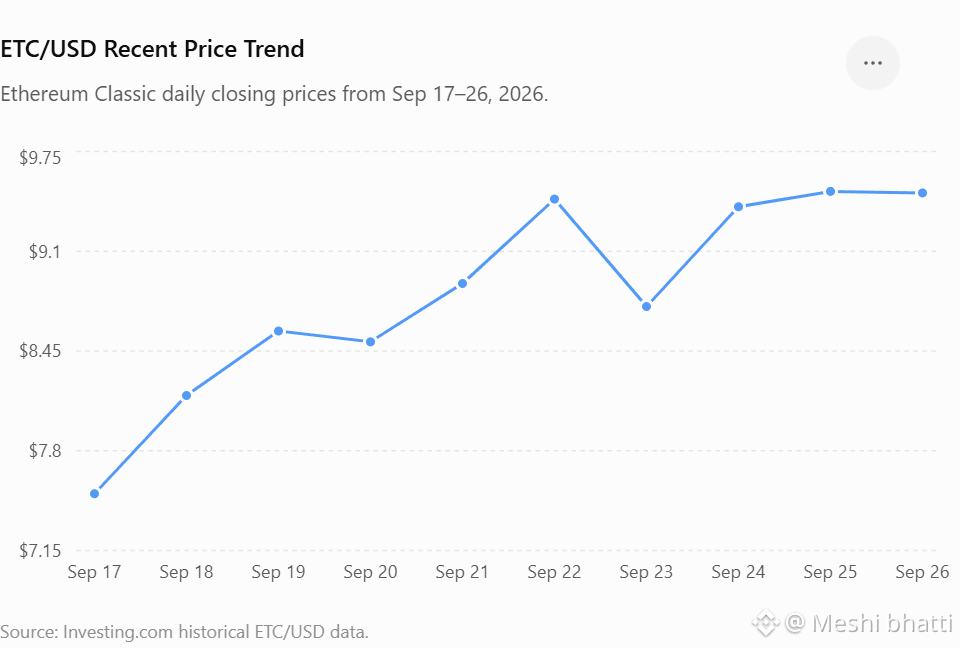
$ETC has shown strong short-term volatility in September. It moved from about $7.52 on Sep 17 to around $9.49 on Sep 26, with a sharp move to an intraday high near $10.40 on Sep 24.
Current area: ~$9.5 Near support: $9.0–$9.3 Resistance: $10.0–$10.4 Bullish signal: A sustained break above $10.4 could indicate stronger momentum. Risk: Falling below the $9 area could bring renewed selling pressure. $ETC remains highly volatile, so these levels are technical reference points, not guaranteed targets.
#StrategyStriveAdd2305BitcoinThisWeek
#TrumpRejectsIranHormuzReopening
#CircleTetherFreezeBitgetHackerWallet
Current area: ~$9.5 Near support: $9.0–$9.3 Resistance: $10.0–$10.4 Bullish signal: A sustained break above $10.4 could indicate stronger momentum. Risk: Falling below the $9 area could bring renewed selling pressure. $ETC remains highly volatile, so these levels are technical reference points, not guaranteed targets.
#StrategyStriveAdd2305BitcoinThisWeek
#TrumpRejectsIranHormuzReopening
#CircleTetherFreezeBitgetHackerWallet