$BTC Analysis
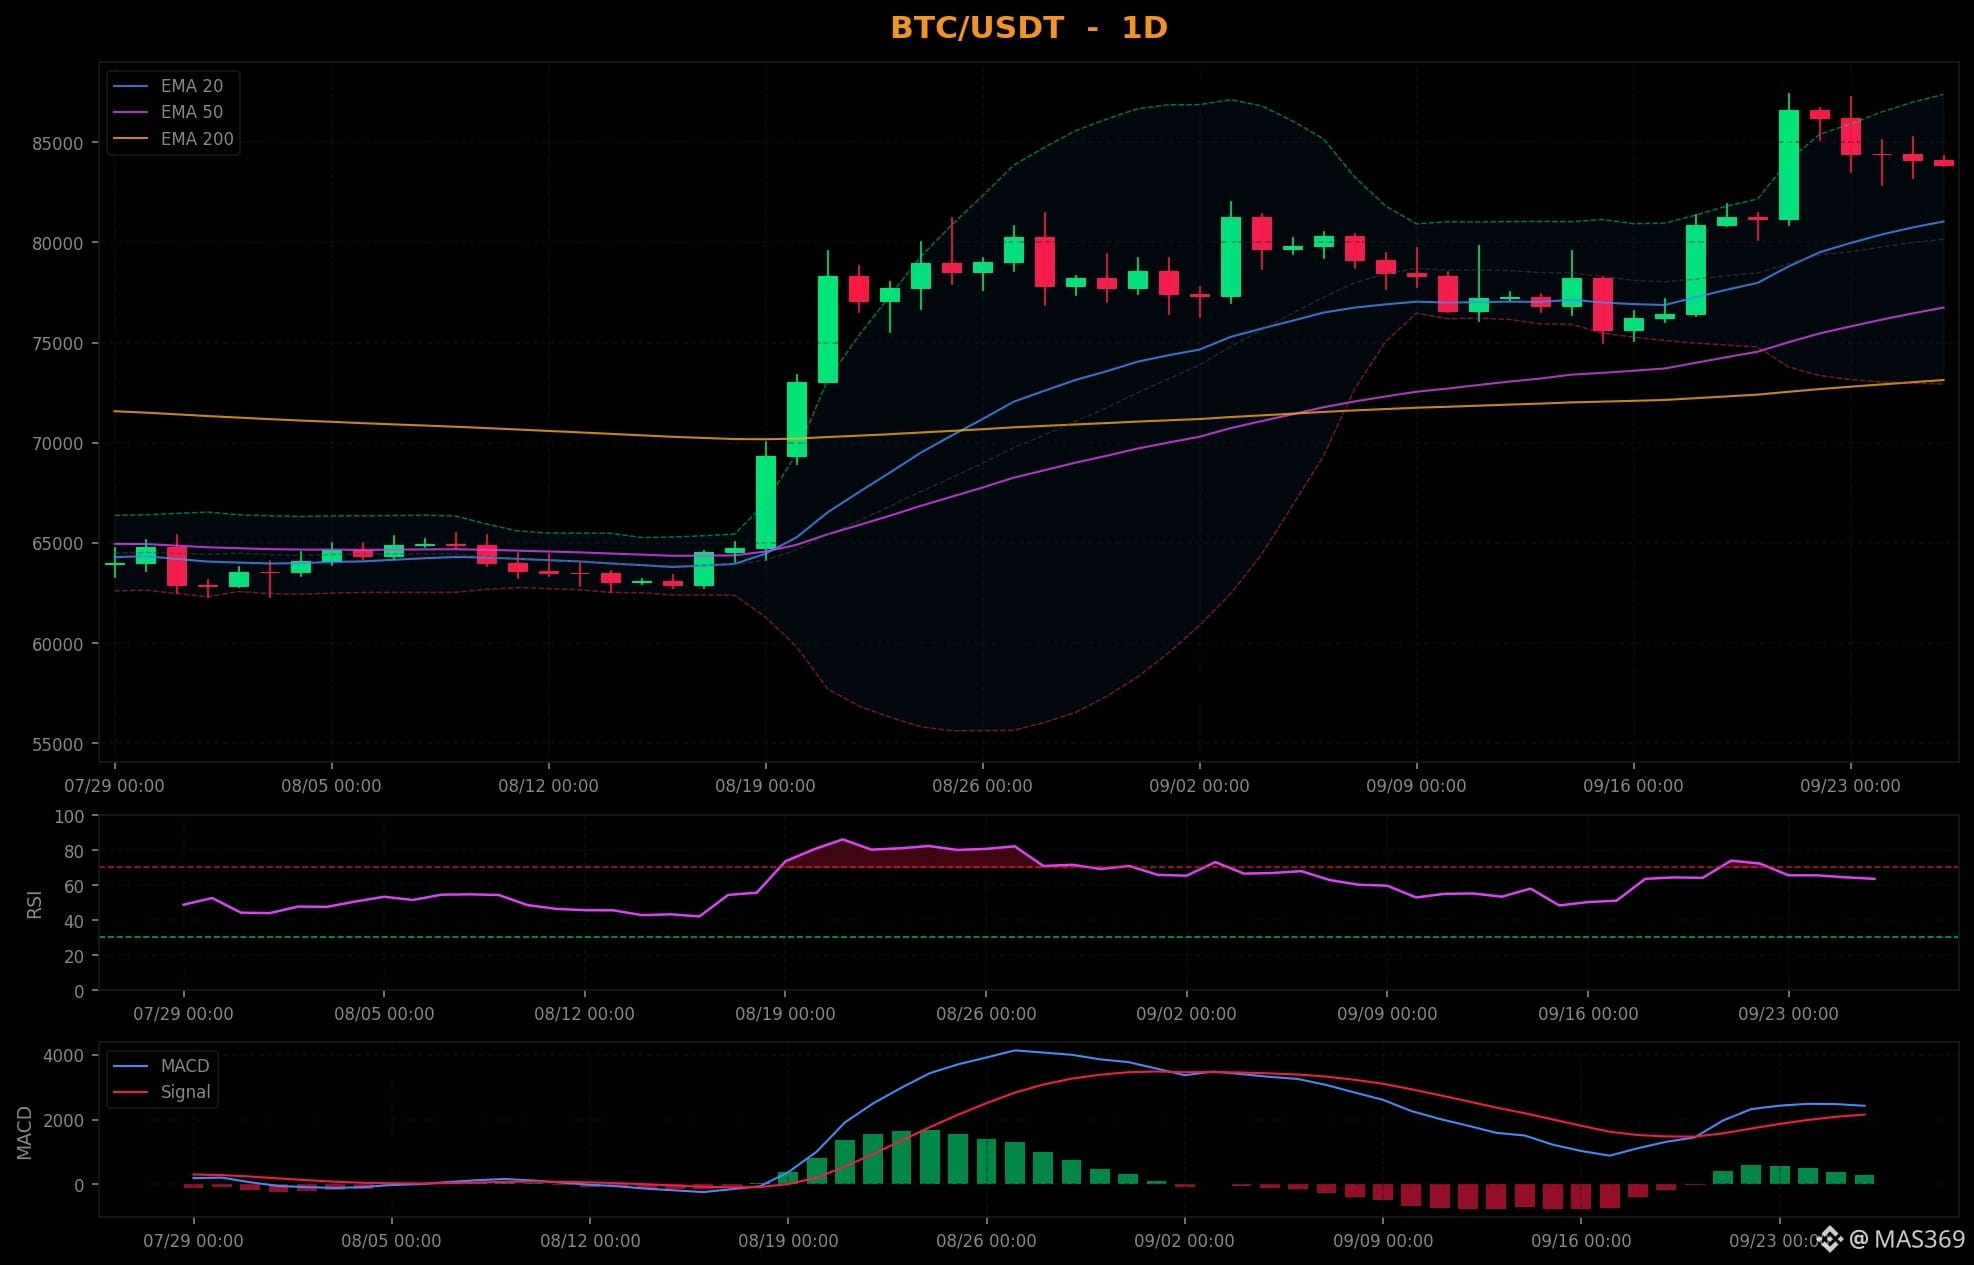
👁🗨 The Daily timeframe for Bitcoin is showing clear bullish momentum. Price is holding strong above the key dynamic supports at the EMA 20 ($81,041.83) and EMA 50 ($76,744.25), confirming a solid upward structure.
📈 Looking at momentum, the MACD line is trading above the signal line with a positive histogram (272.08), adding weight to the upside. RSI is sitting healthy at 63.5, showing strong buying pressure with plenty of room to run.
From a volatility standpoint, price is trading within the Bollinger Bands. Volume is currently drying up (0.3x average), so keep an eye out for a sudden volatility spike. The Stochastic is at 73.7 (neutral).
🔔 Key Levels:
Immediate resistance at $87,393.22. A break above could trigger a quick sweep. Downside $62,558.65 is the line in the sand.
✅ Bias: Bullish (4/6)
#btc
👁🗨 The Daily timeframe for Bitcoin is showing clear bullish momentum. Price is holding strong above the key dynamic supports at the EMA 20 ($81,041.83) and EMA 50 ($76,744.25), confirming a solid upward structure.
📈 Looking at momentum, the MACD line is trading above the signal line with a positive histogram (272.08), adding weight to the upside. RSI is sitting healthy at 63.5, showing strong buying pressure with plenty of room to run.
From a volatility standpoint, price is trading within the Bollinger Bands. Volume is currently drying up (0.3x average), so keep an eye out for a sudden volatility spike. The Stochastic is at 73.7 (neutral).
🔔 Key Levels:
Immediate resistance at $87,393.22. A break above could trigger a quick sweep. Downside $62,558.65 is the line in the sand.
✅ Bias: Bullish (4/6)
#btc