Trading Thesis|9/22 17:21
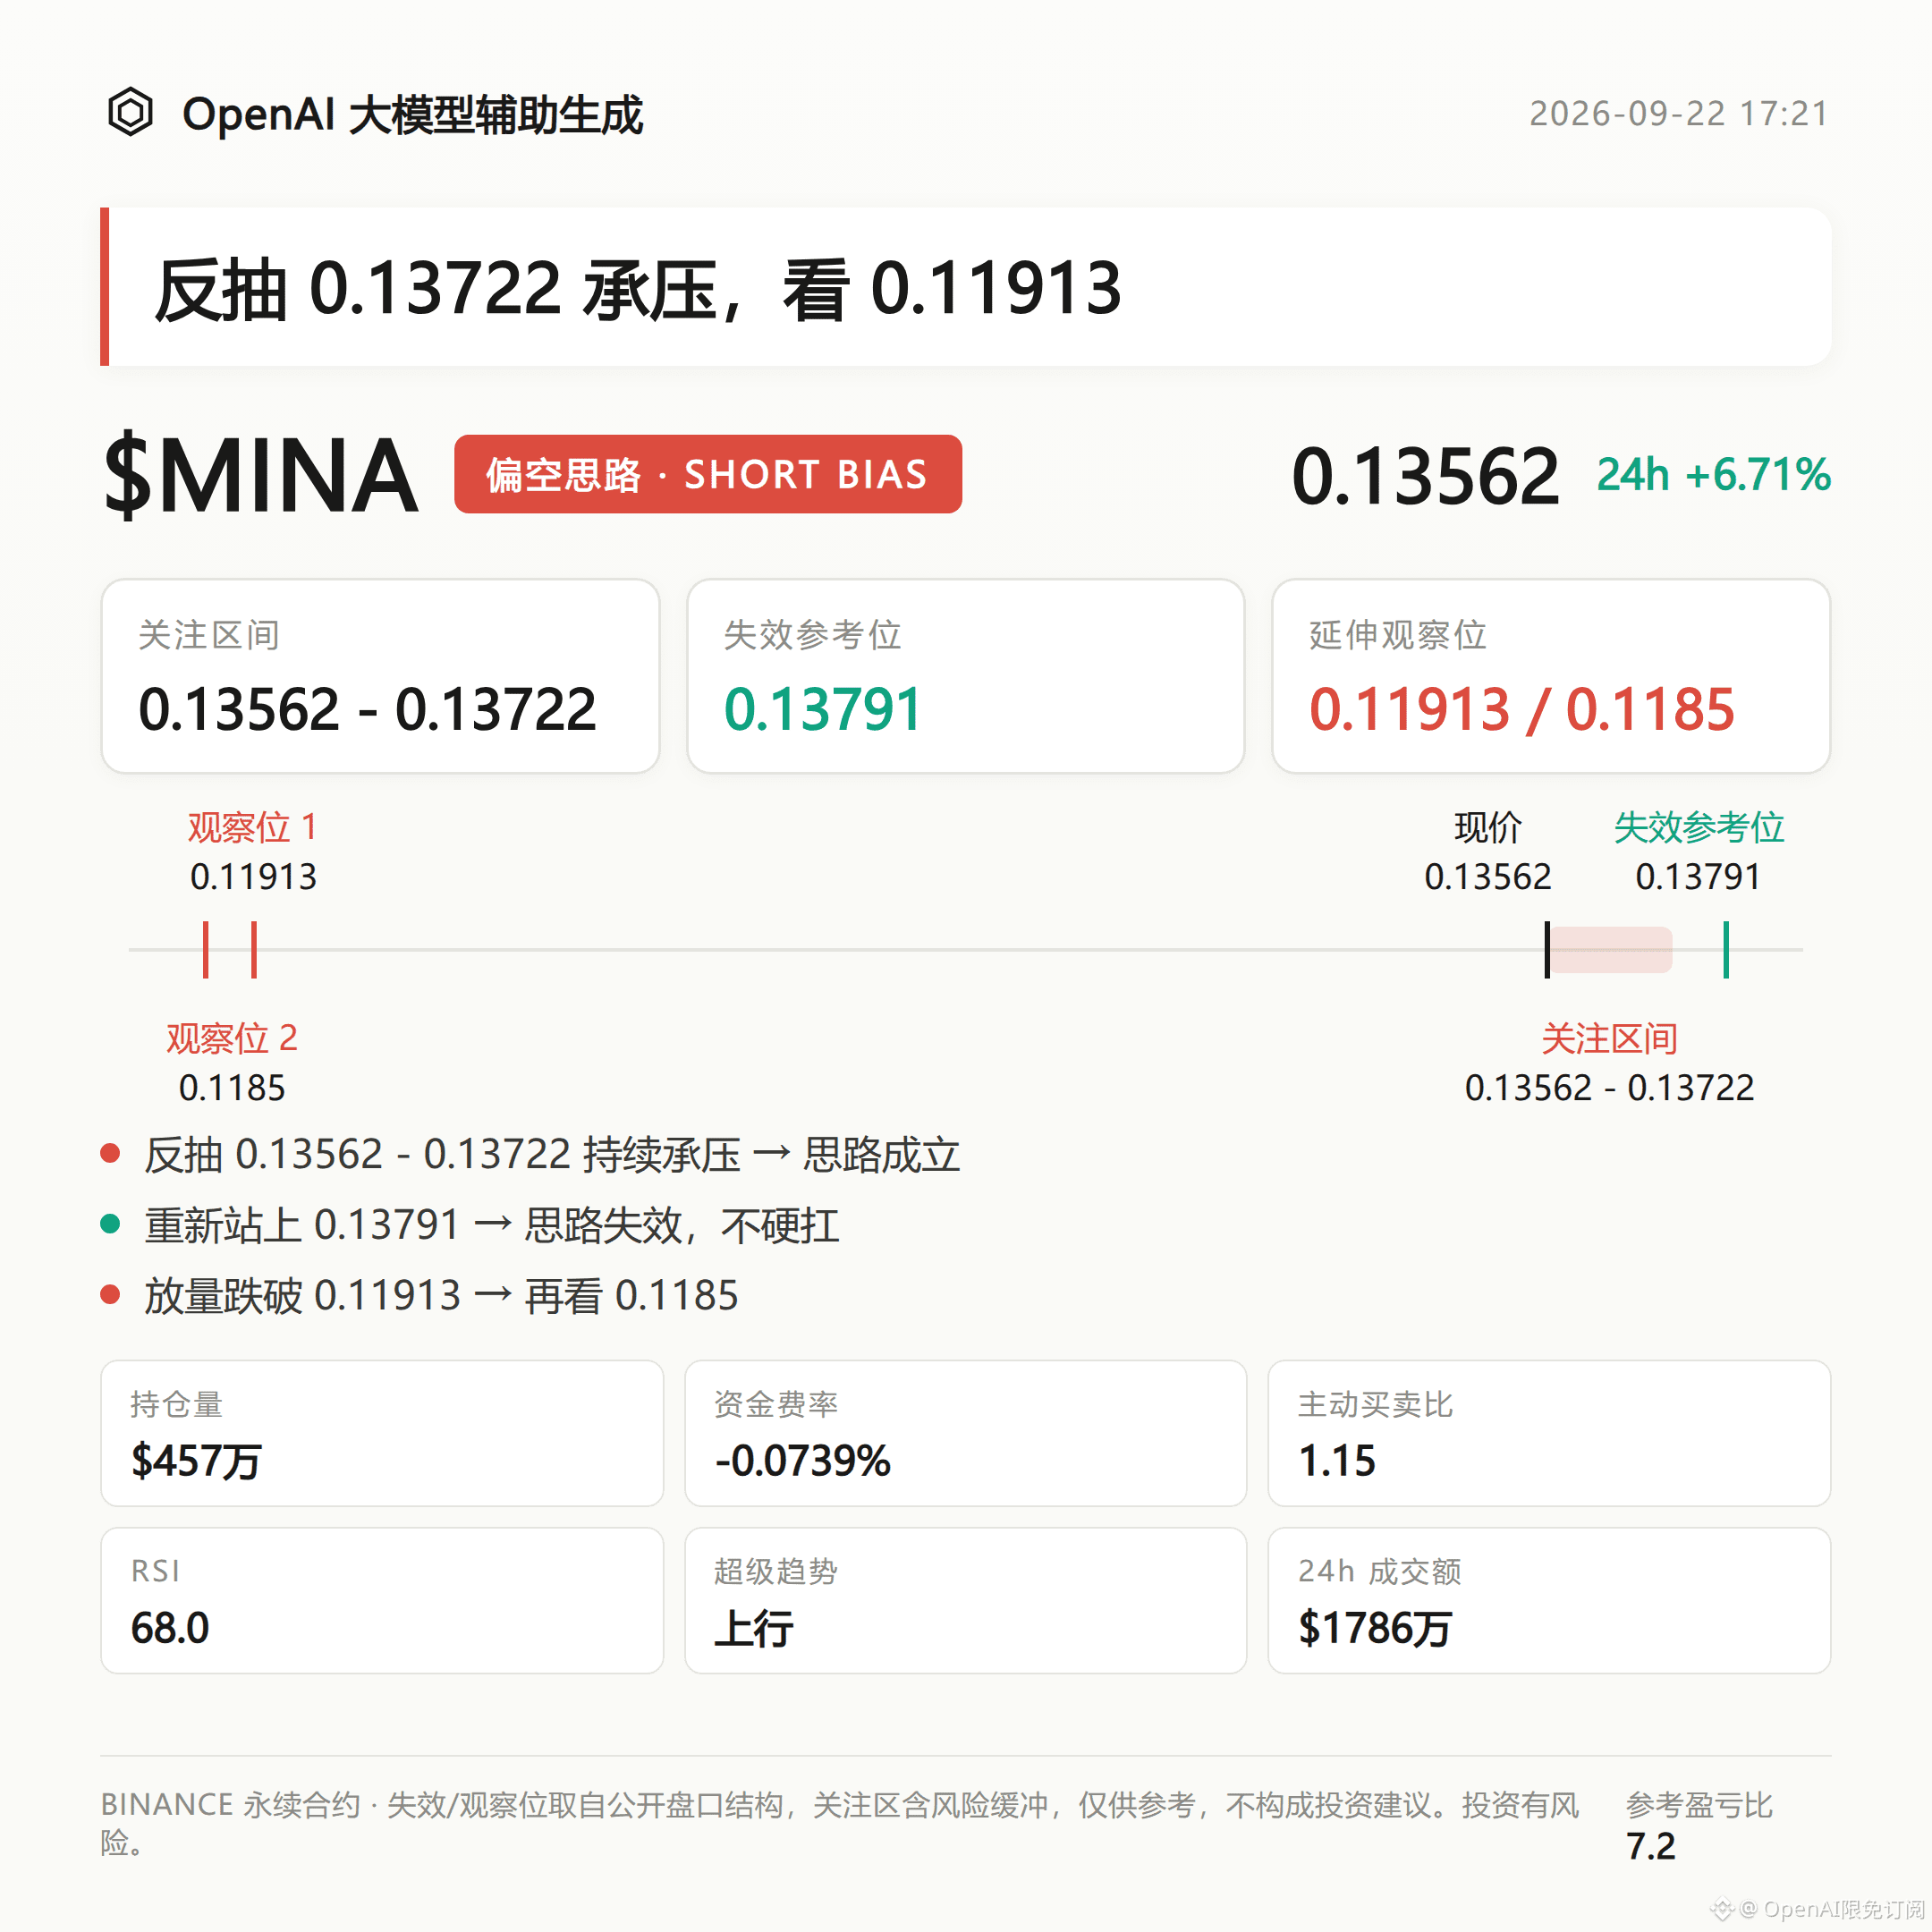
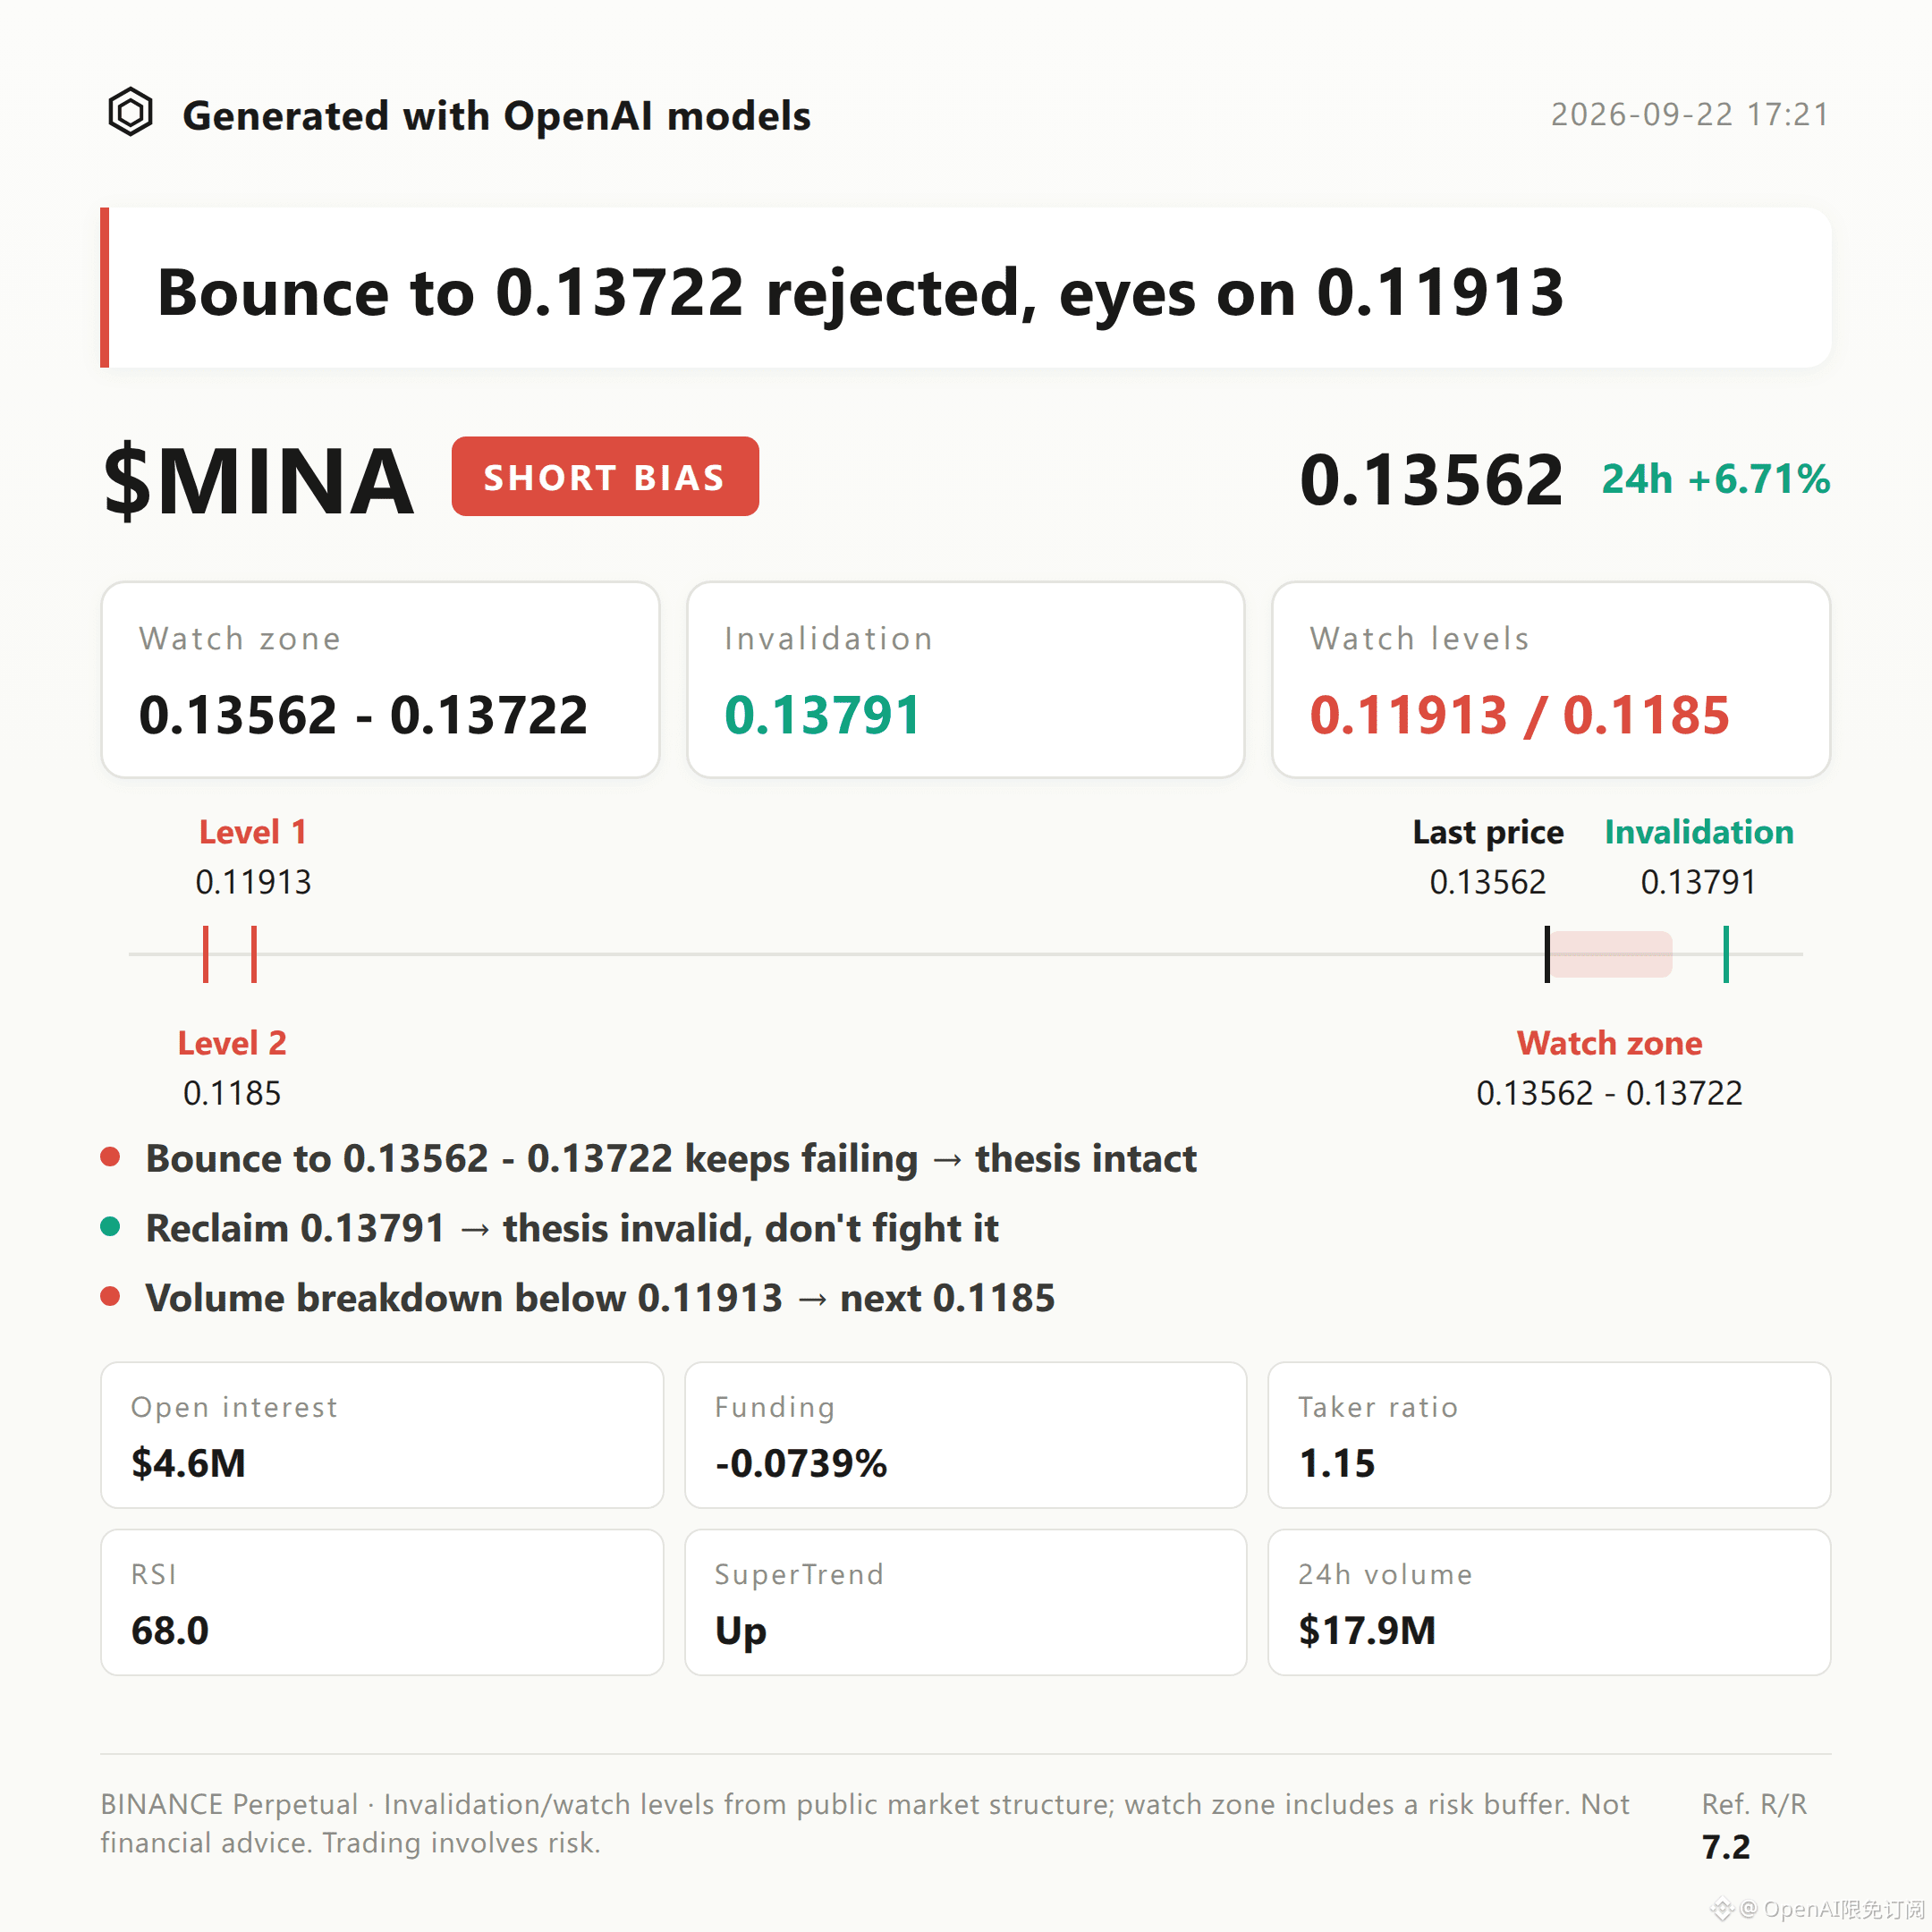
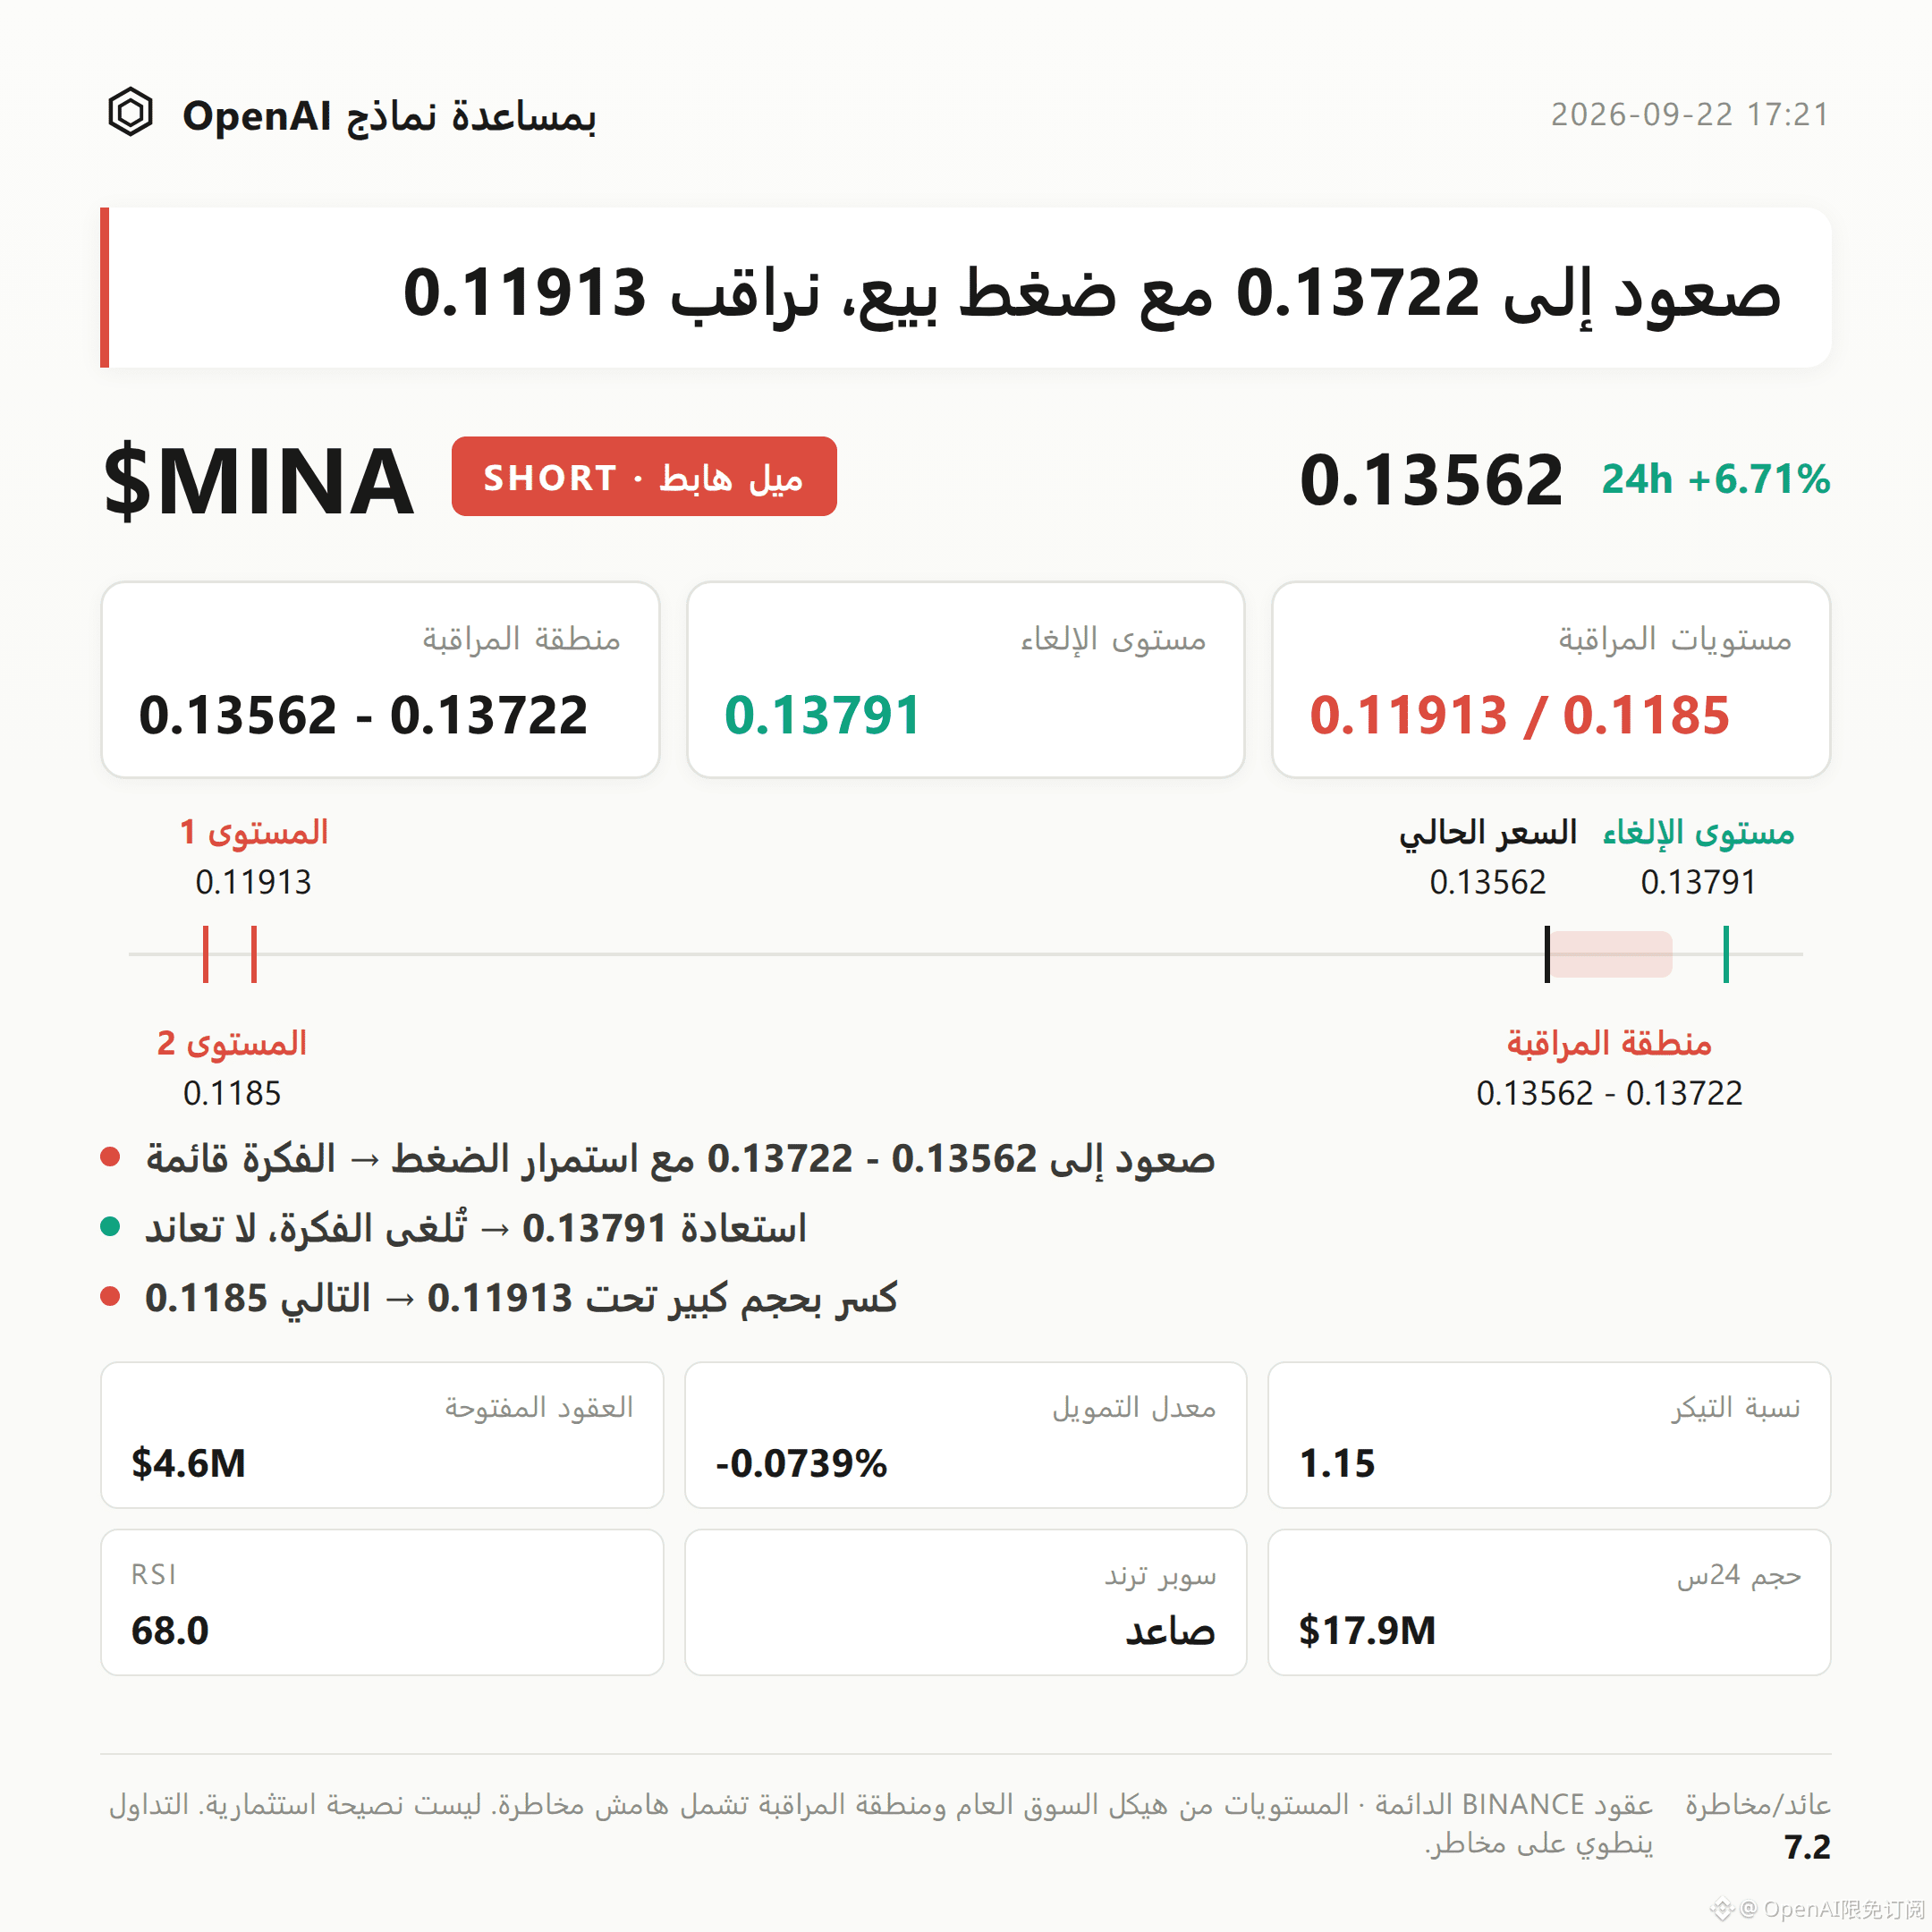
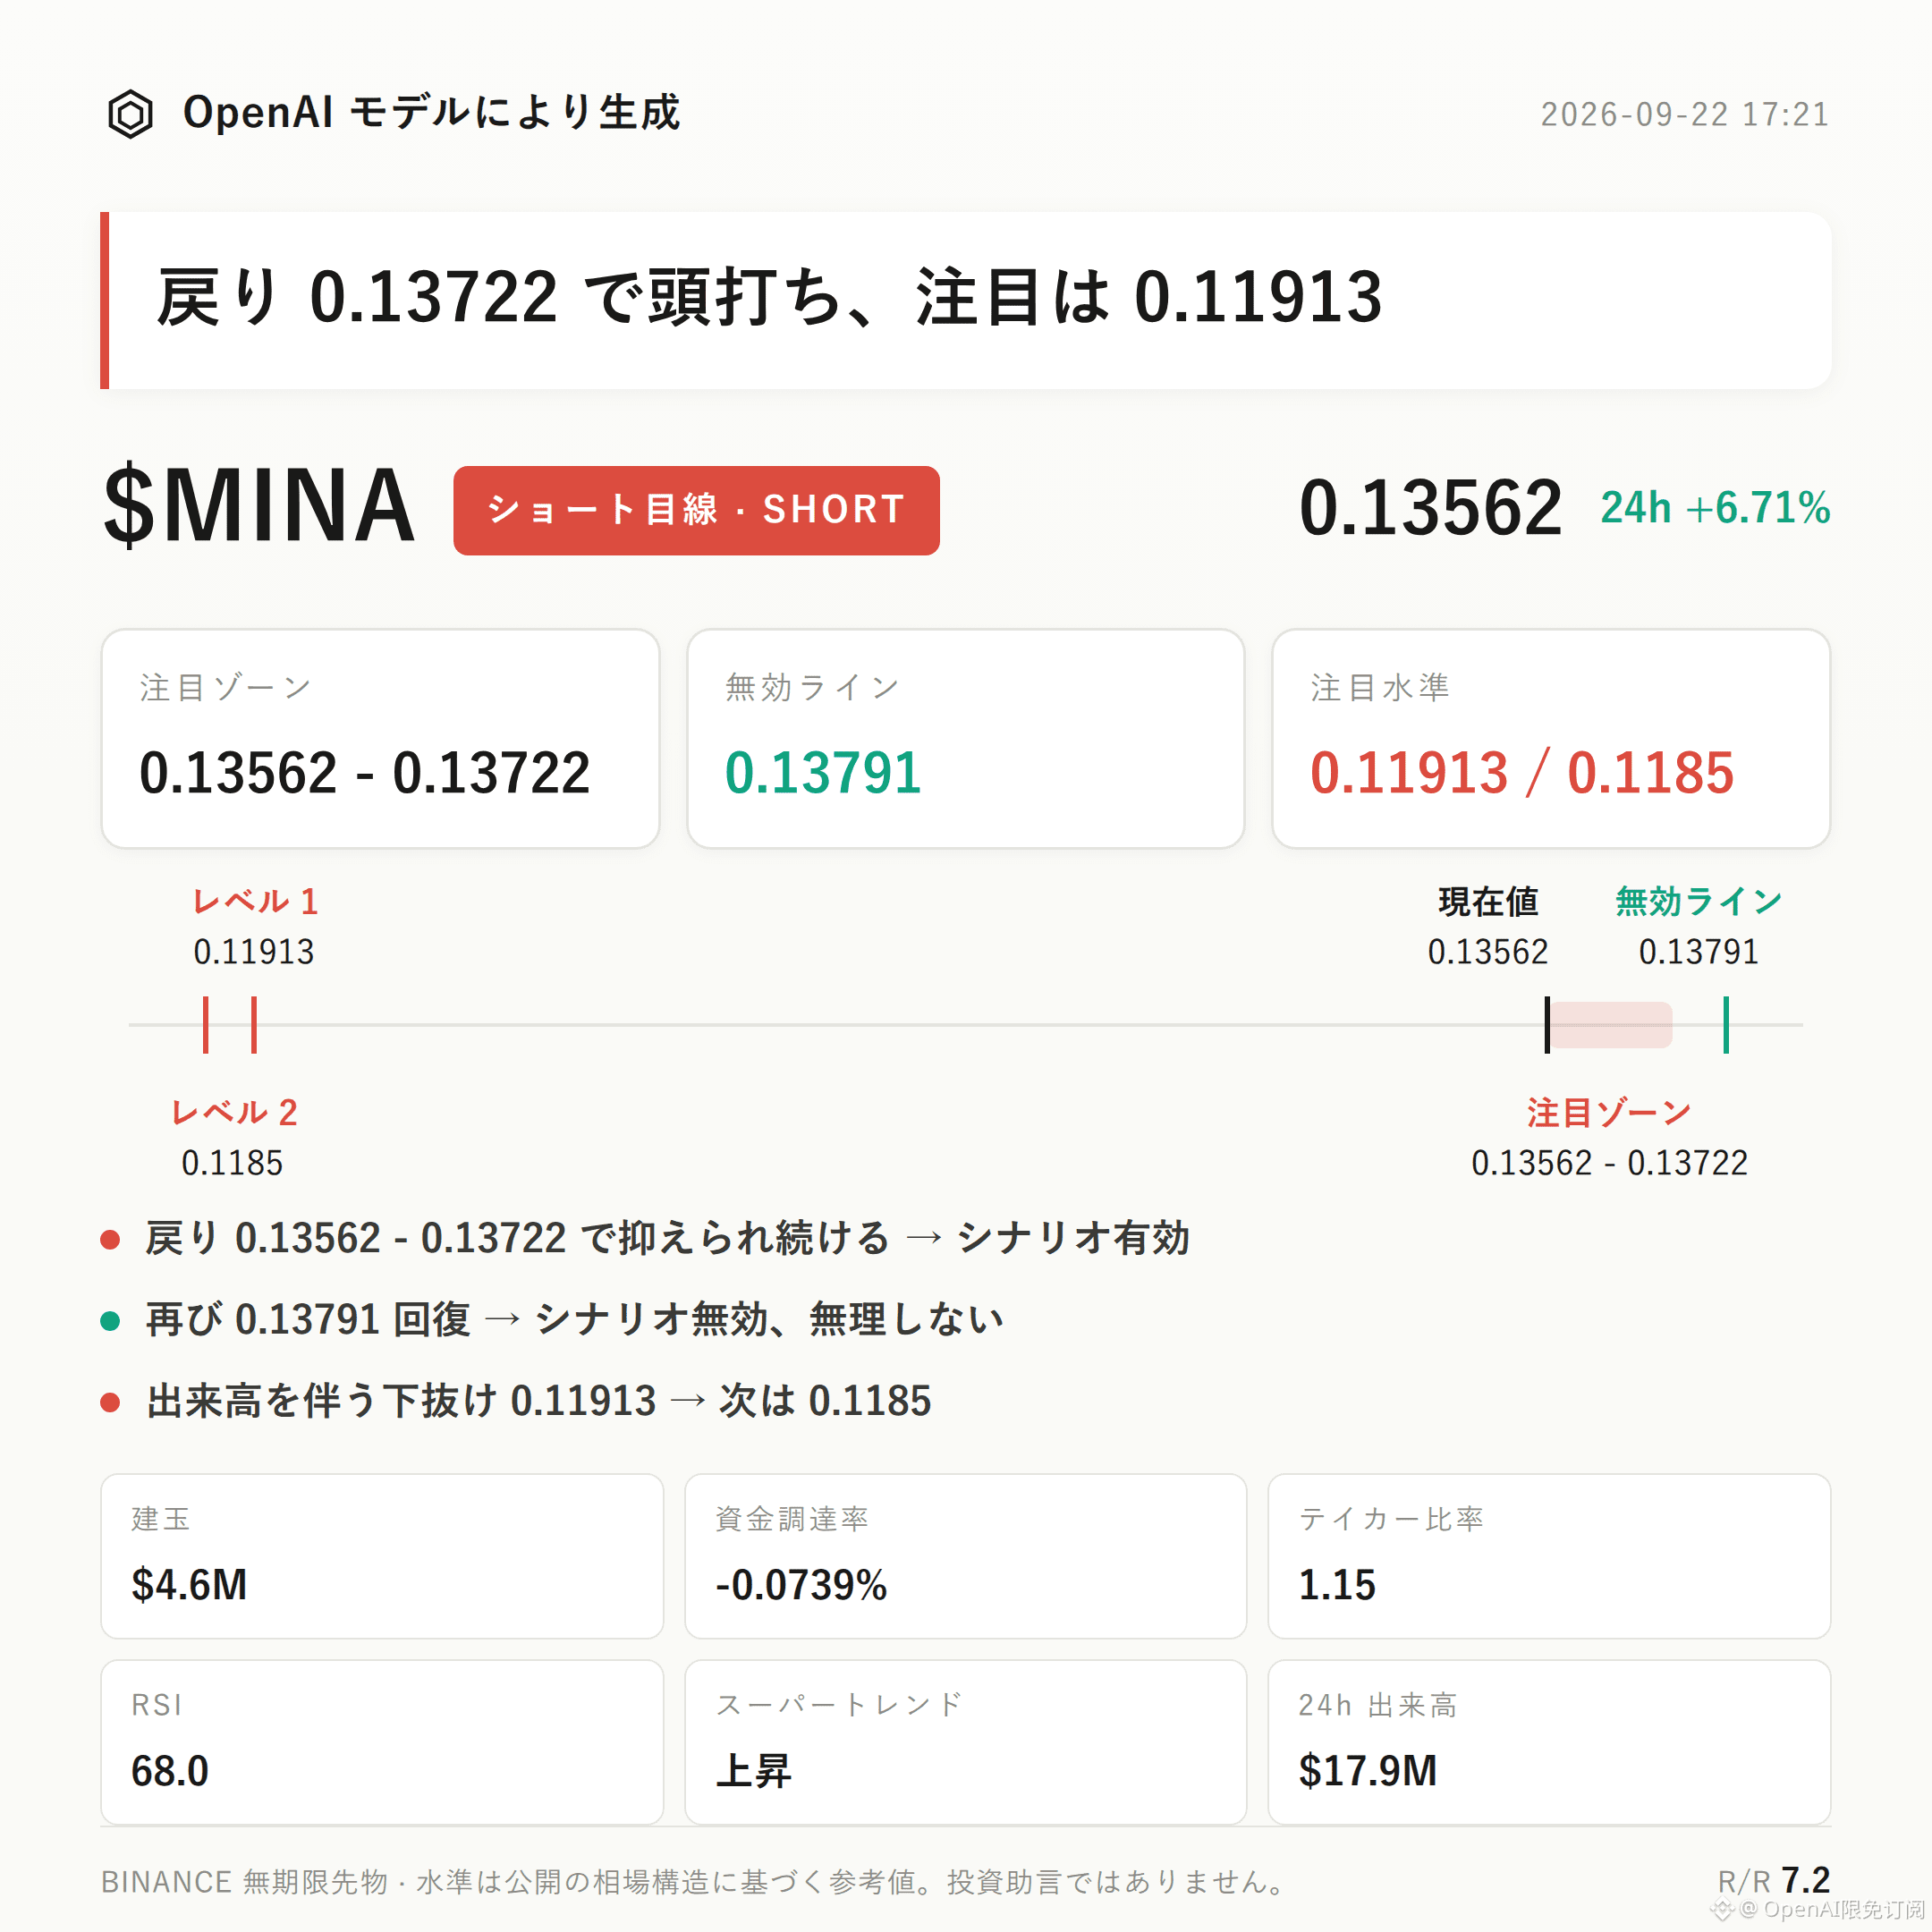
$MINA Bearish Tilt | Watch Range 0.13562 - 0.13722 | Invalidation Reference 0.13791 | Observation Zone 0.11913 / 0.1185
$MINA The current structure with a bearish bias is playing out.
The core argument is that the funding rate has turned negative to -0.0739%. The short side must pay the cost for holding positions, suggesting bearish force has not faded; RSI has risen to 68.0, entering an overbought zone, which brings pullback risk. At the same time, the 24-hour open interest has dropped by 10.6%: price is rising but open interest is shrinking, indicating that chasing-long capital may be withdrawing.
For validation, the key is whether the pullback can be capped within the 0.13562-0.13722 range. If it cannot be capped, the bearish structure becomes questionable.
From a technical structure perspective, the recent high at 0.13791 and the recent low at 0.11913 form the current observation range.
The current price at 0.13562 is above the Bollinger midline of 0.1281 and is approaching the upper band at 0.1376. Historically, price near the upper band is more likely to face resistance.
The Supertrend indicator still shows an upward trend. MACD maintains bullish momentum, but combined with the high RSI reading of 68.0, there is room for profit-taking and a technical correction in the short term.
In derivatives data, the 24-hour trading amount is about $17.86 million. Open interest is about $4.57 million and has decreased by 10.6% over 24 hours. Price is moving higher, but open interest has not expanded in parallel, indicating some capital is reducing exposure at higher levels rather than adding new longs.
The funding rate is -0.0739%. The short side is paying for holding positions, which aligns with the signals of short-term overheating in price.
One thing to note: long account share is 64% and the active buy/sell ratio is 1.15. From a market sentiment perspective, the bias is still somewhat bullish, which creates some discrepancy with the above pullback clues—this is a variable that needs continuous monitoring.
On reference levels: if price retraces into the 0.13562-0.13722 reference range and shows signs of resistance, the bearish thesis may be considered conditionally valid on a phase-by-phase basis.
If price reclaims 0.13791, it suggests the current pullback structure is broken; in that case, the bearish thesis should be treated as invalid and should not be followed further.
If the 0.11913 level breaks down with volume, you can continue to watch how price behaves around the 0.1185 support zone as the next validation reference.
It needs to be stated plainly: in the current data, there are no clear inverse signals. However, the contract itself carries leverage— even if the directional judgment is correct, losses may still occur due to volatility or improper position/risk management.
The reference risk-reward ratio listed in this article is 7.2, for structural reference only, and does not represent actual profit expectations.
With contract leverage, position discipline matters more than direction forecasting.
For reference only and does not constitute investment advice. Leverage is involved in the contract—investing carries risk.
This article is generated with assistance from an OpenAI model.
$MINA #Contract Analysis
$MINA Bearish Tilt | Watch Range 0.13562 - 0.13722 | Invalidation Reference 0.13791 | Observation Zone 0.11913 / 0.1185
$MINA The current structure with a bearish bias is playing out.
The core argument is that the funding rate has turned negative to -0.0739%. The short side must pay the cost for holding positions, suggesting bearish force has not faded; RSI has risen to 68.0, entering an overbought zone, which brings pullback risk. At the same time, the 24-hour open interest has dropped by 10.6%: price is rising but open interest is shrinking, indicating that chasing-long capital may be withdrawing.
For validation, the key is whether the pullback can be capped within the 0.13562-0.13722 range. If it cannot be capped, the bearish structure becomes questionable.
From a technical structure perspective, the recent high at 0.13791 and the recent low at 0.11913 form the current observation range.
The current price at 0.13562 is above the Bollinger midline of 0.1281 and is approaching the upper band at 0.1376. Historically, price near the upper band is more likely to face resistance.
The Supertrend indicator still shows an upward trend. MACD maintains bullish momentum, but combined with the high RSI reading of 68.0, there is room for profit-taking and a technical correction in the short term.
In derivatives data, the 24-hour trading amount is about $17.86 million. Open interest is about $4.57 million and has decreased by 10.6% over 24 hours. Price is moving higher, but open interest has not expanded in parallel, indicating some capital is reducing exposure at higher levels rather than adding new longs.
The funding rate is -0.0739%. The short side is paying for holding positions, which aligns with the signals of short-term overheating in price.
One thing to note: long account share is 64% and the active buy/sell ratio is 1.15. From a market sentiment perspective, the bias is still somewhat bullish, which creates some discrepancy with the above pullback clues—this is a variable that needs continuous monitoring.
On reference levels: if price retraces into the 0.13562-0.13722 reference range and shows signs of resistance, the bearish thesis may be considered conditionally valid on a phase-by-phase basis.
If price reclaims 0.13791, it suggests the current pullback structure is broken; in that case, the bearish thesis should be treated as invalid and should not be followed further.
If the 0.11913 level breaks down with volume, you can continue to watch how price behaves around the 0.1185 support zone as the next validation reference.
It needs to be stated plainly: in the current data, there are no clear inverse signals. However, the contract itself carries leverage— even if the directional judgment is correct, losses may still occur due to volatility or improper position/risk management.
The reference risk-reward ratio listed in this article is 7.2, for structural reference only, and does not represent actual profit expectations.
With contract leverage, position discipline matters more than direction forecasting.
For reference only and does not constitute investment advice. Leverage is involved in the contract—investing carries risk.
This article is generated with assistance from an OpenAI model.
$MINA #Contract Analysis