75,000 became the turning point.
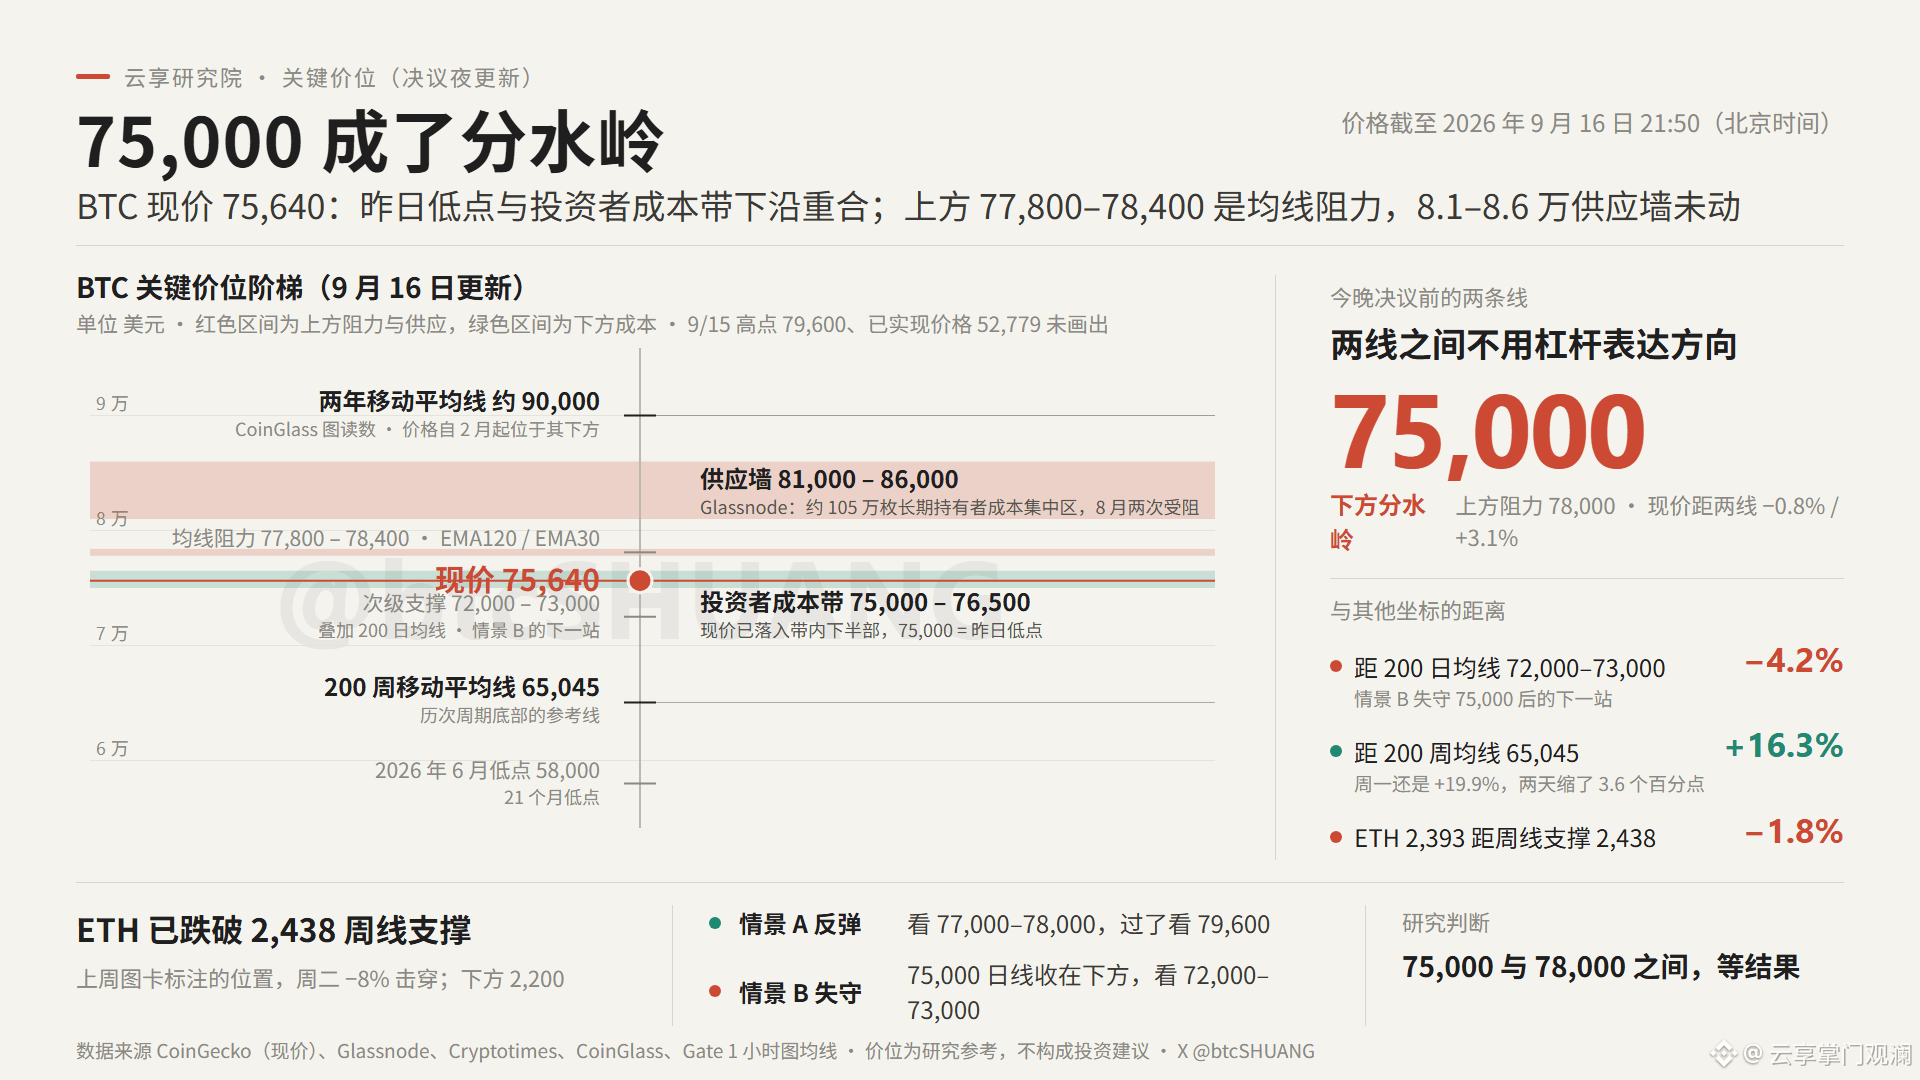
BTC current price is 75,640. Yesterday’s low and the lower edge of the investors’ cost band at 75,000–76,500 overlap; above that, 77,800–78,400 is the resistance zone formed by the 1-hour chart’s EMA120 and EMA30. The supply wall in the 81,000–86,000 range hasn’t moved.
There is still 4.2% to the 200-day moving average at 72,000–73,000; 16.3% to the 200-week moving average at 65,045. As for Monday, this figure is still 19.9%.
ETH is weaker: 2,393. The weekly support at 2,438 marked last week has already been broken through, and it hasn’t been able to reclaim it. Any rebound is only a correction.
Between 75,000 and 78,000, there’s no need to use leverage to express direction—just wait for the 02:00 result.
Prices are for research reference only and do not constitute investment advice
BTC current price is 75,640. Yesterday’s low and the lower edge of the investors’ cost band at 75,000–76,500 overlap; above that, 77,800–78,400 is the resistance zone formed by the 1-hour chart’s EMA120 and EMA30. The supply wall in the 81,000–86,000 range hasn’t moved.
There is still 4.2% to the 200-day moving average at 72,000–73,000; 16.3% to the 200-week moving average at 65,045. As for Monday, this figure is still 19.9%.
ETH is weaker: 2,393. The weekly support at 2,438 marked last week has already been broken through, and it hasn’t been able to reclaim it. Any rebound is only a correction.
Between 75,000 and 78,000, there’s no need to use leverage to express direction—just wait for the 02:00 result.
Prices are for research reference only and do not constitute investment advice