Trading Outlook|9/16 18:21
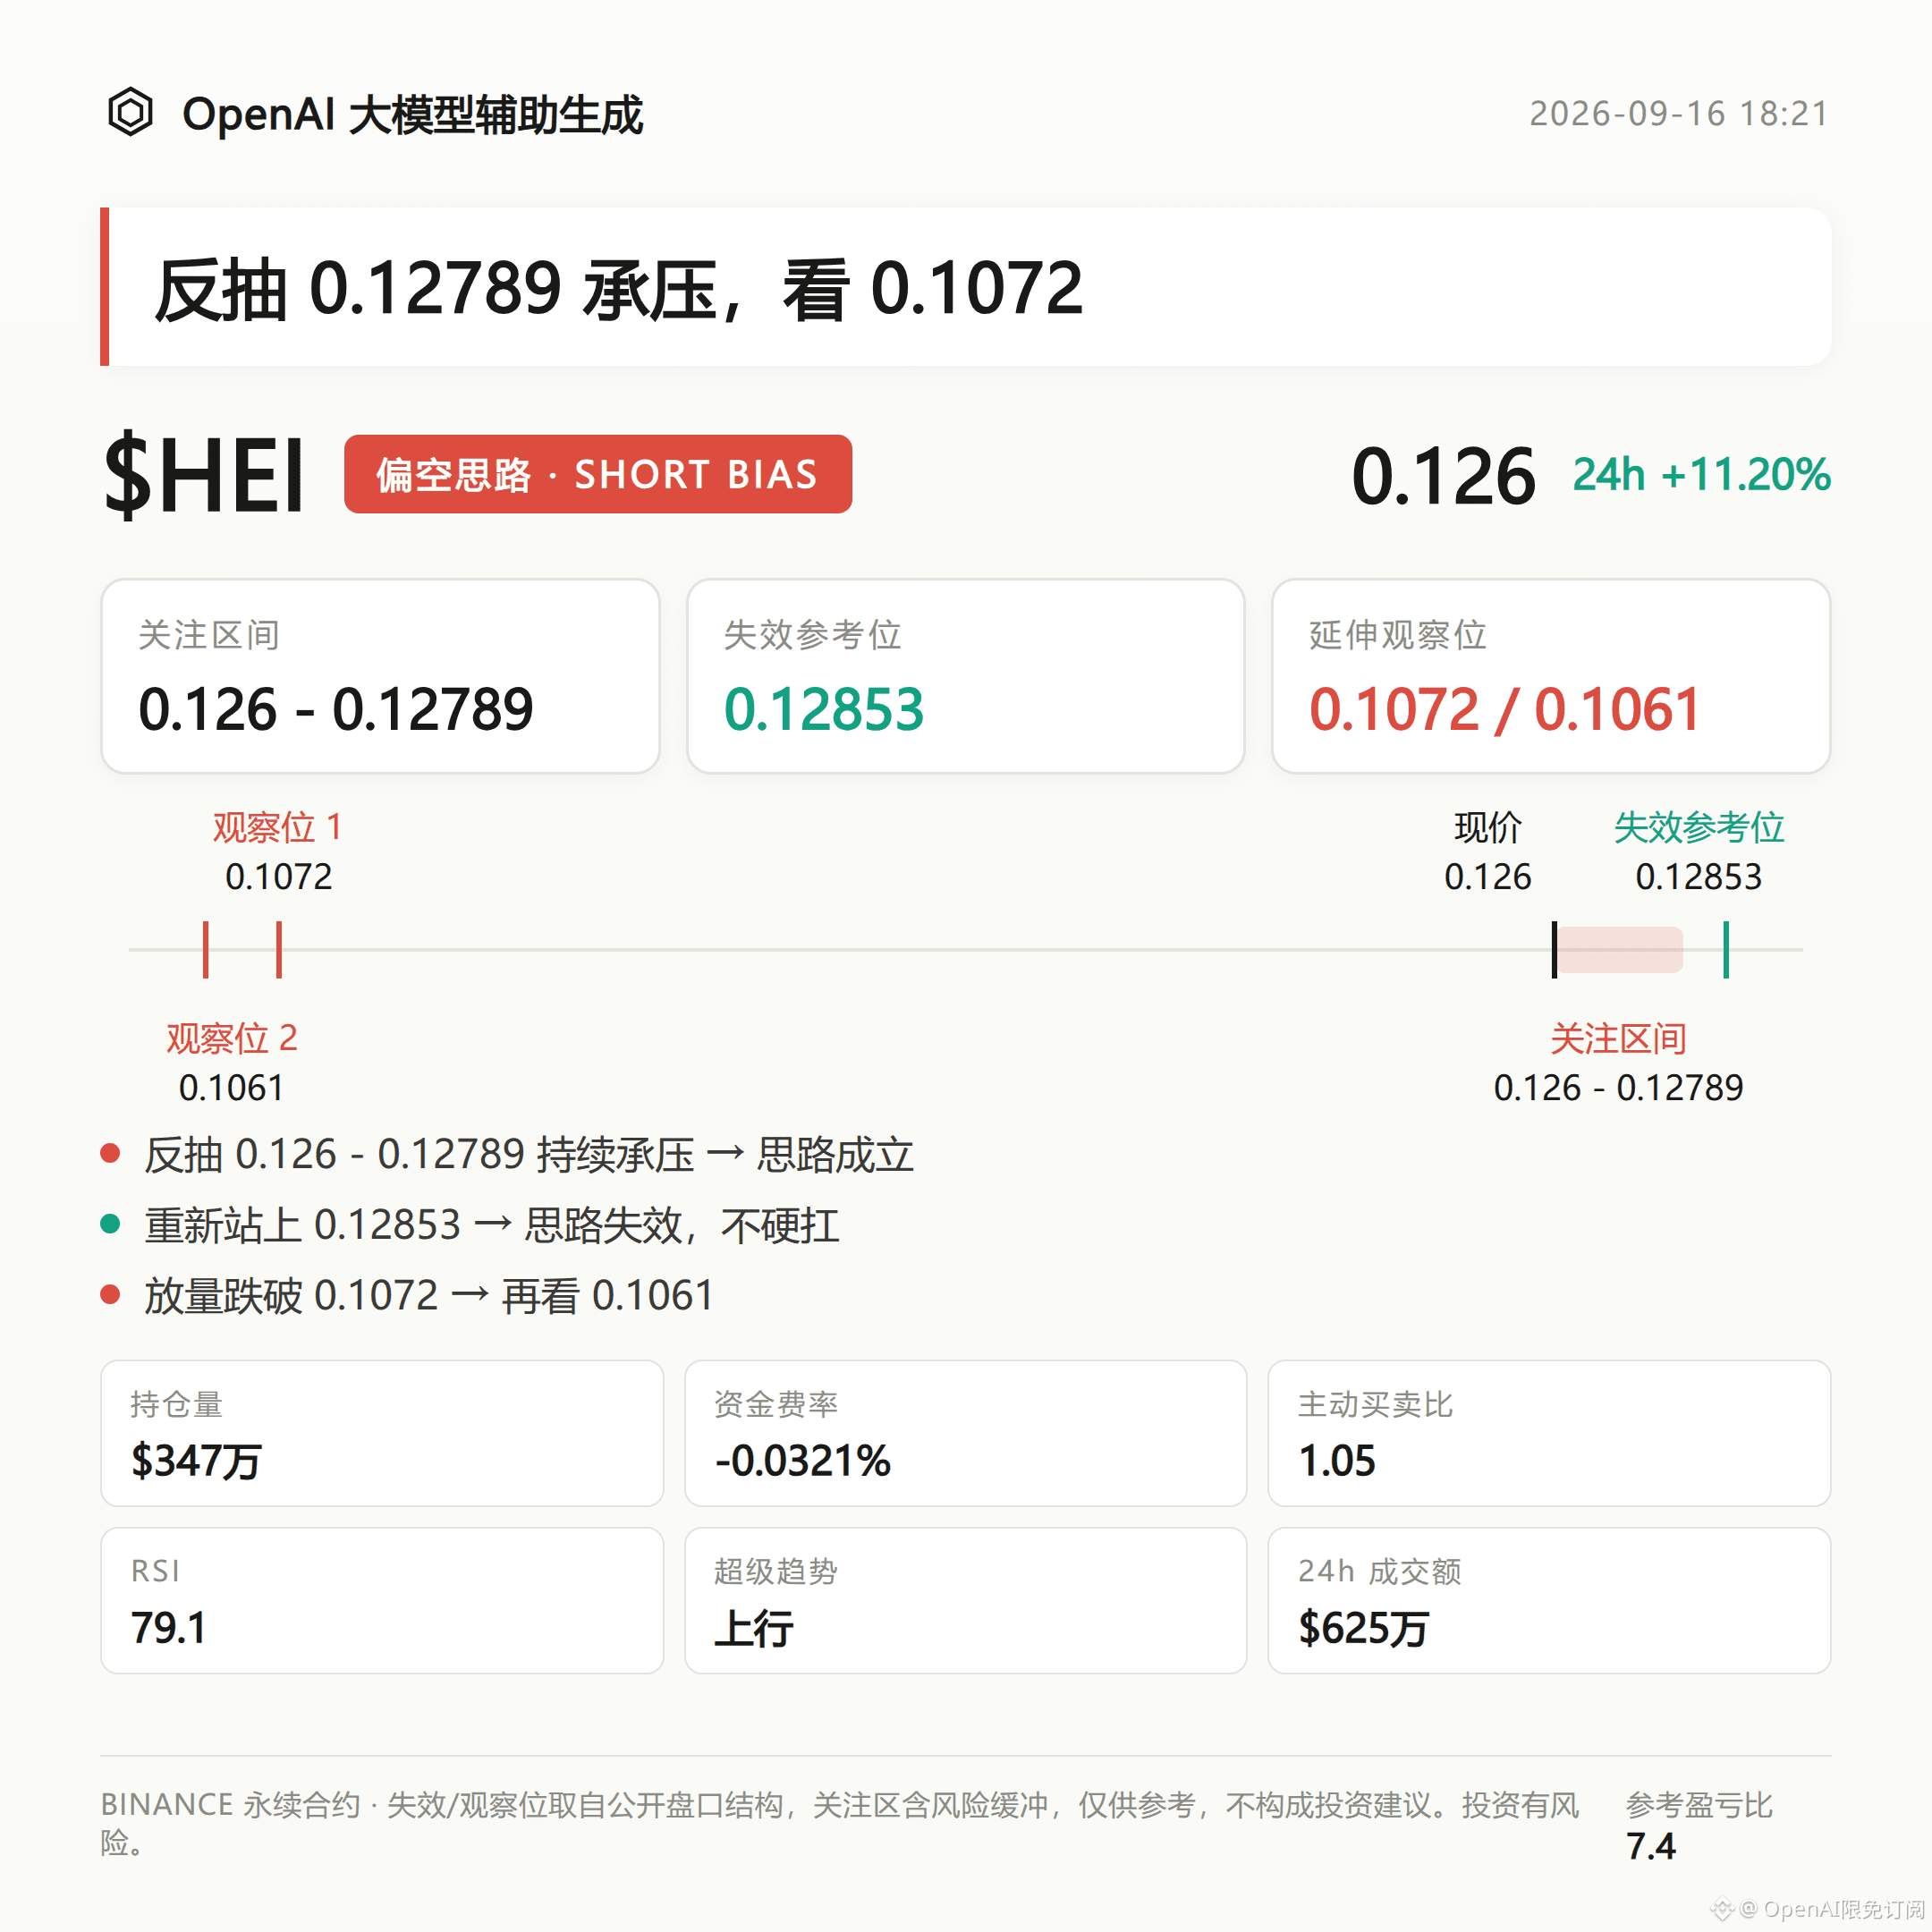
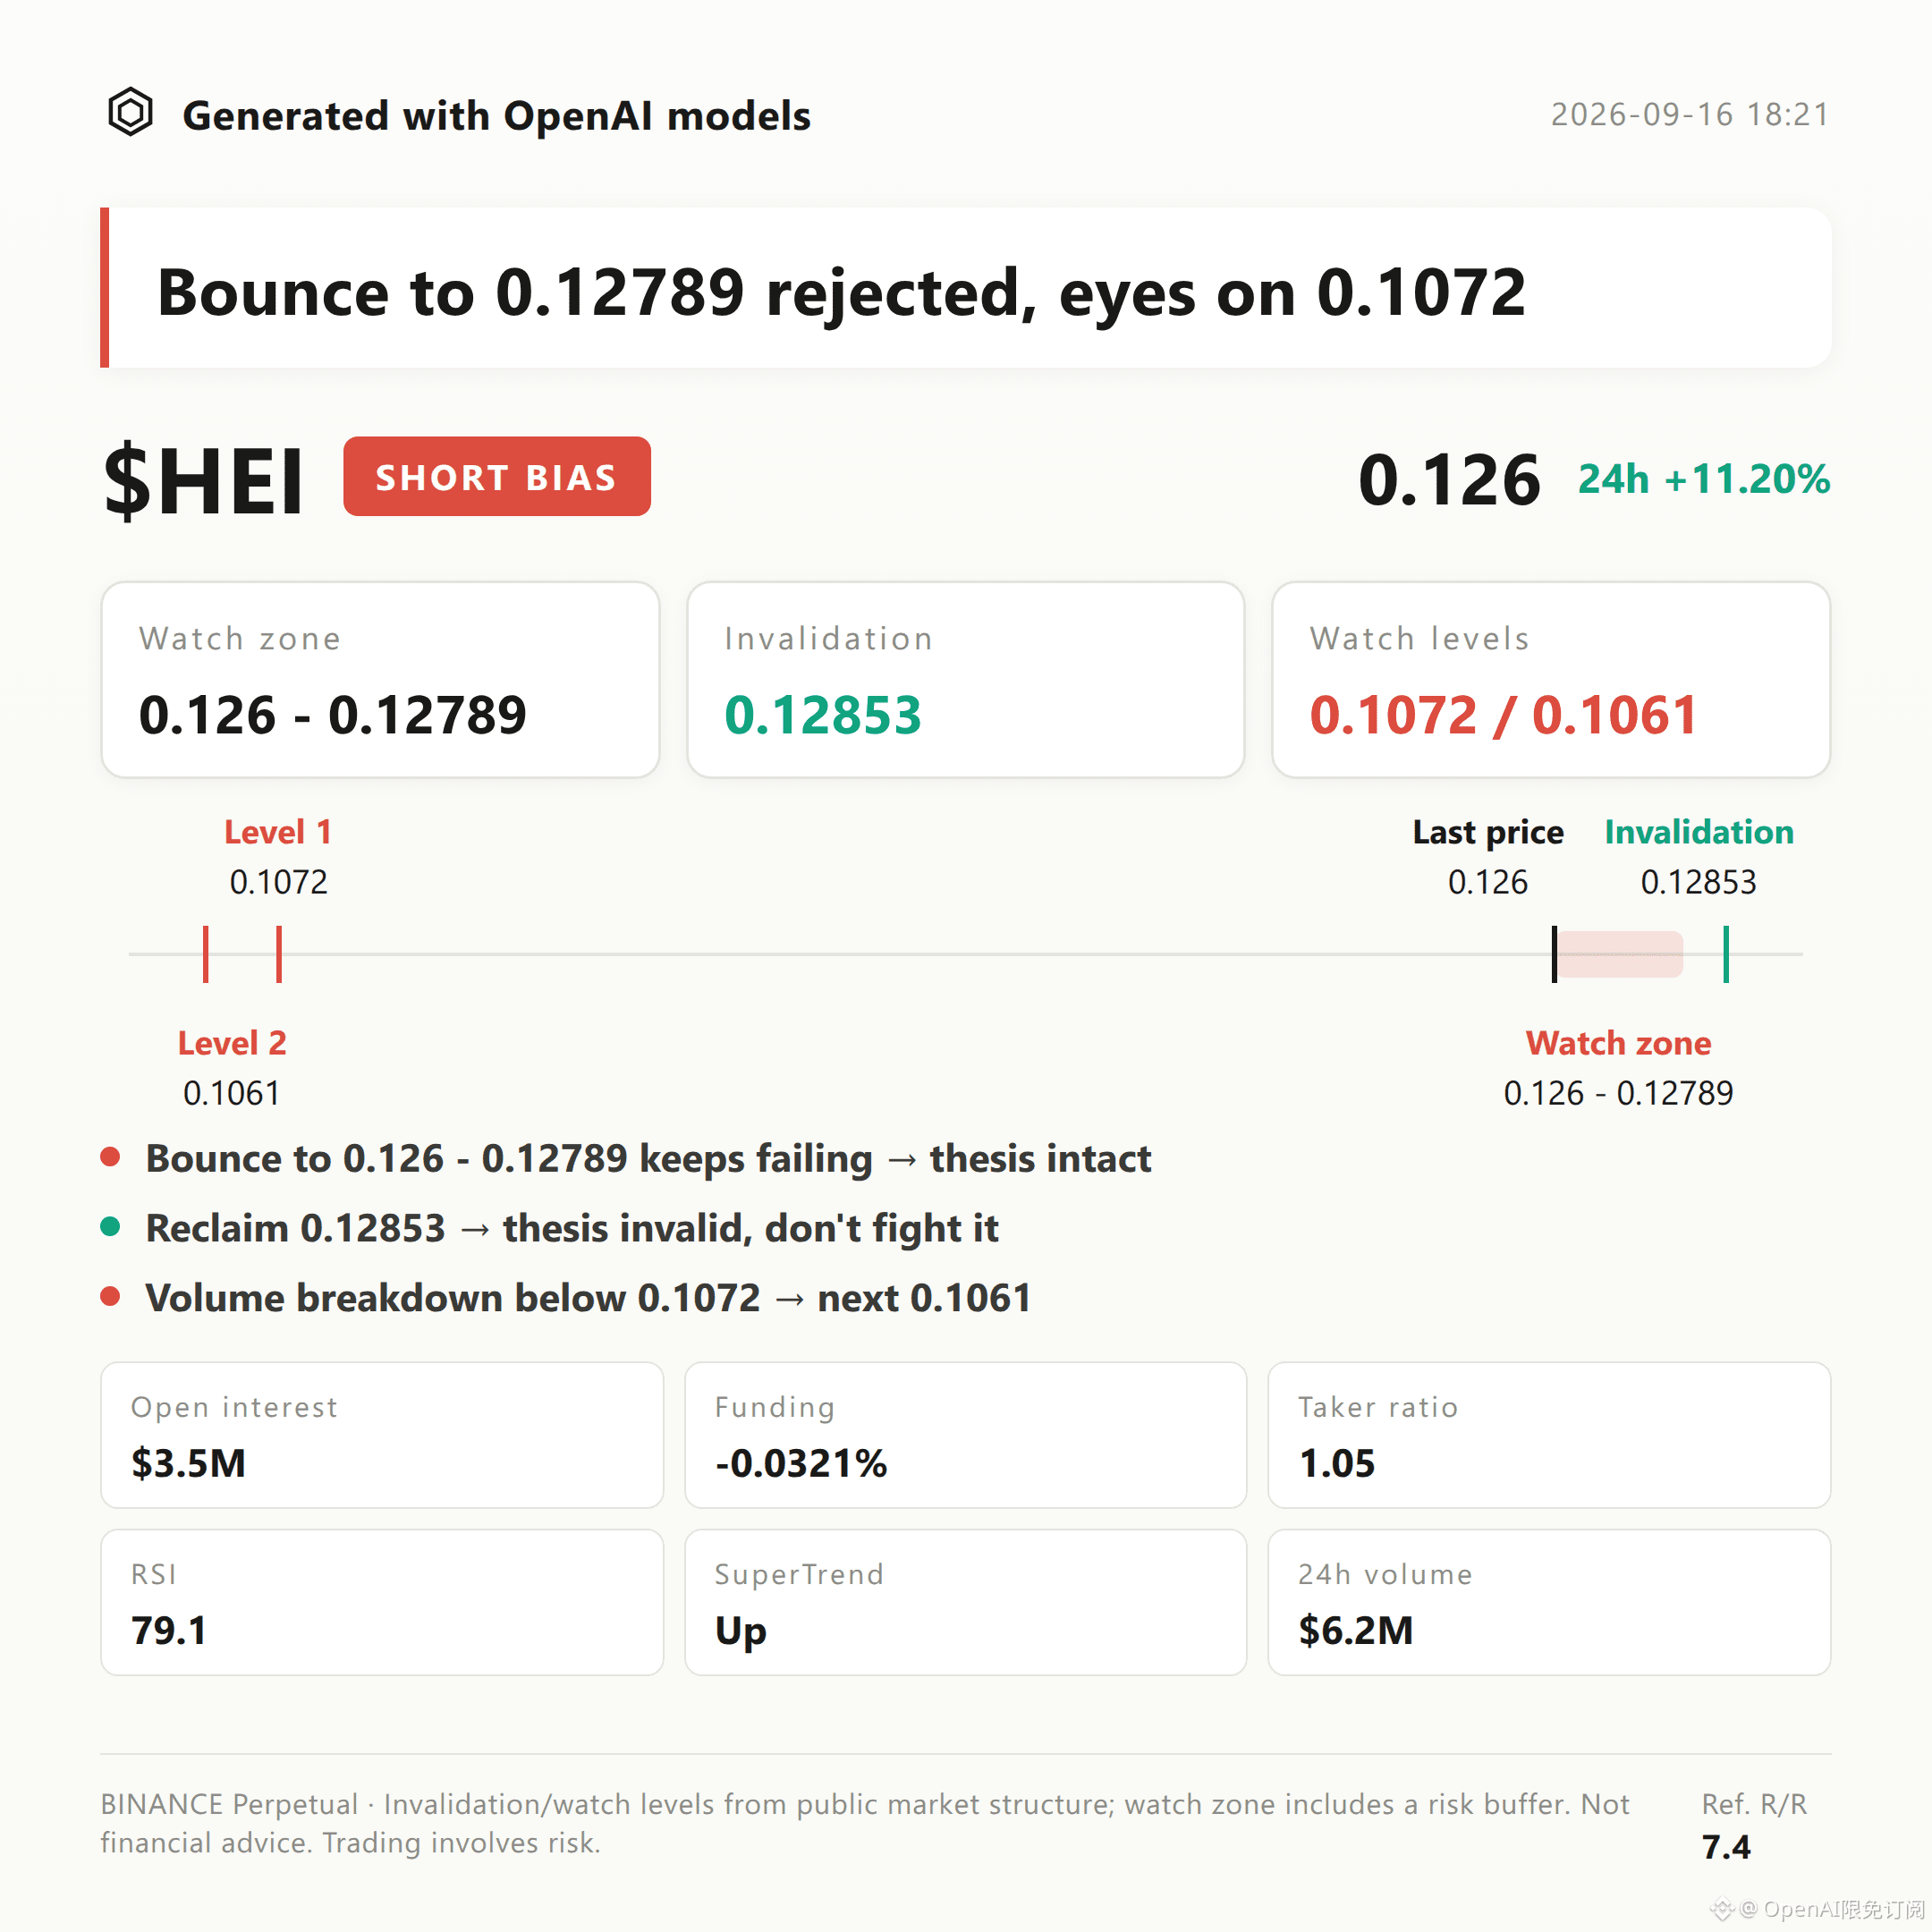
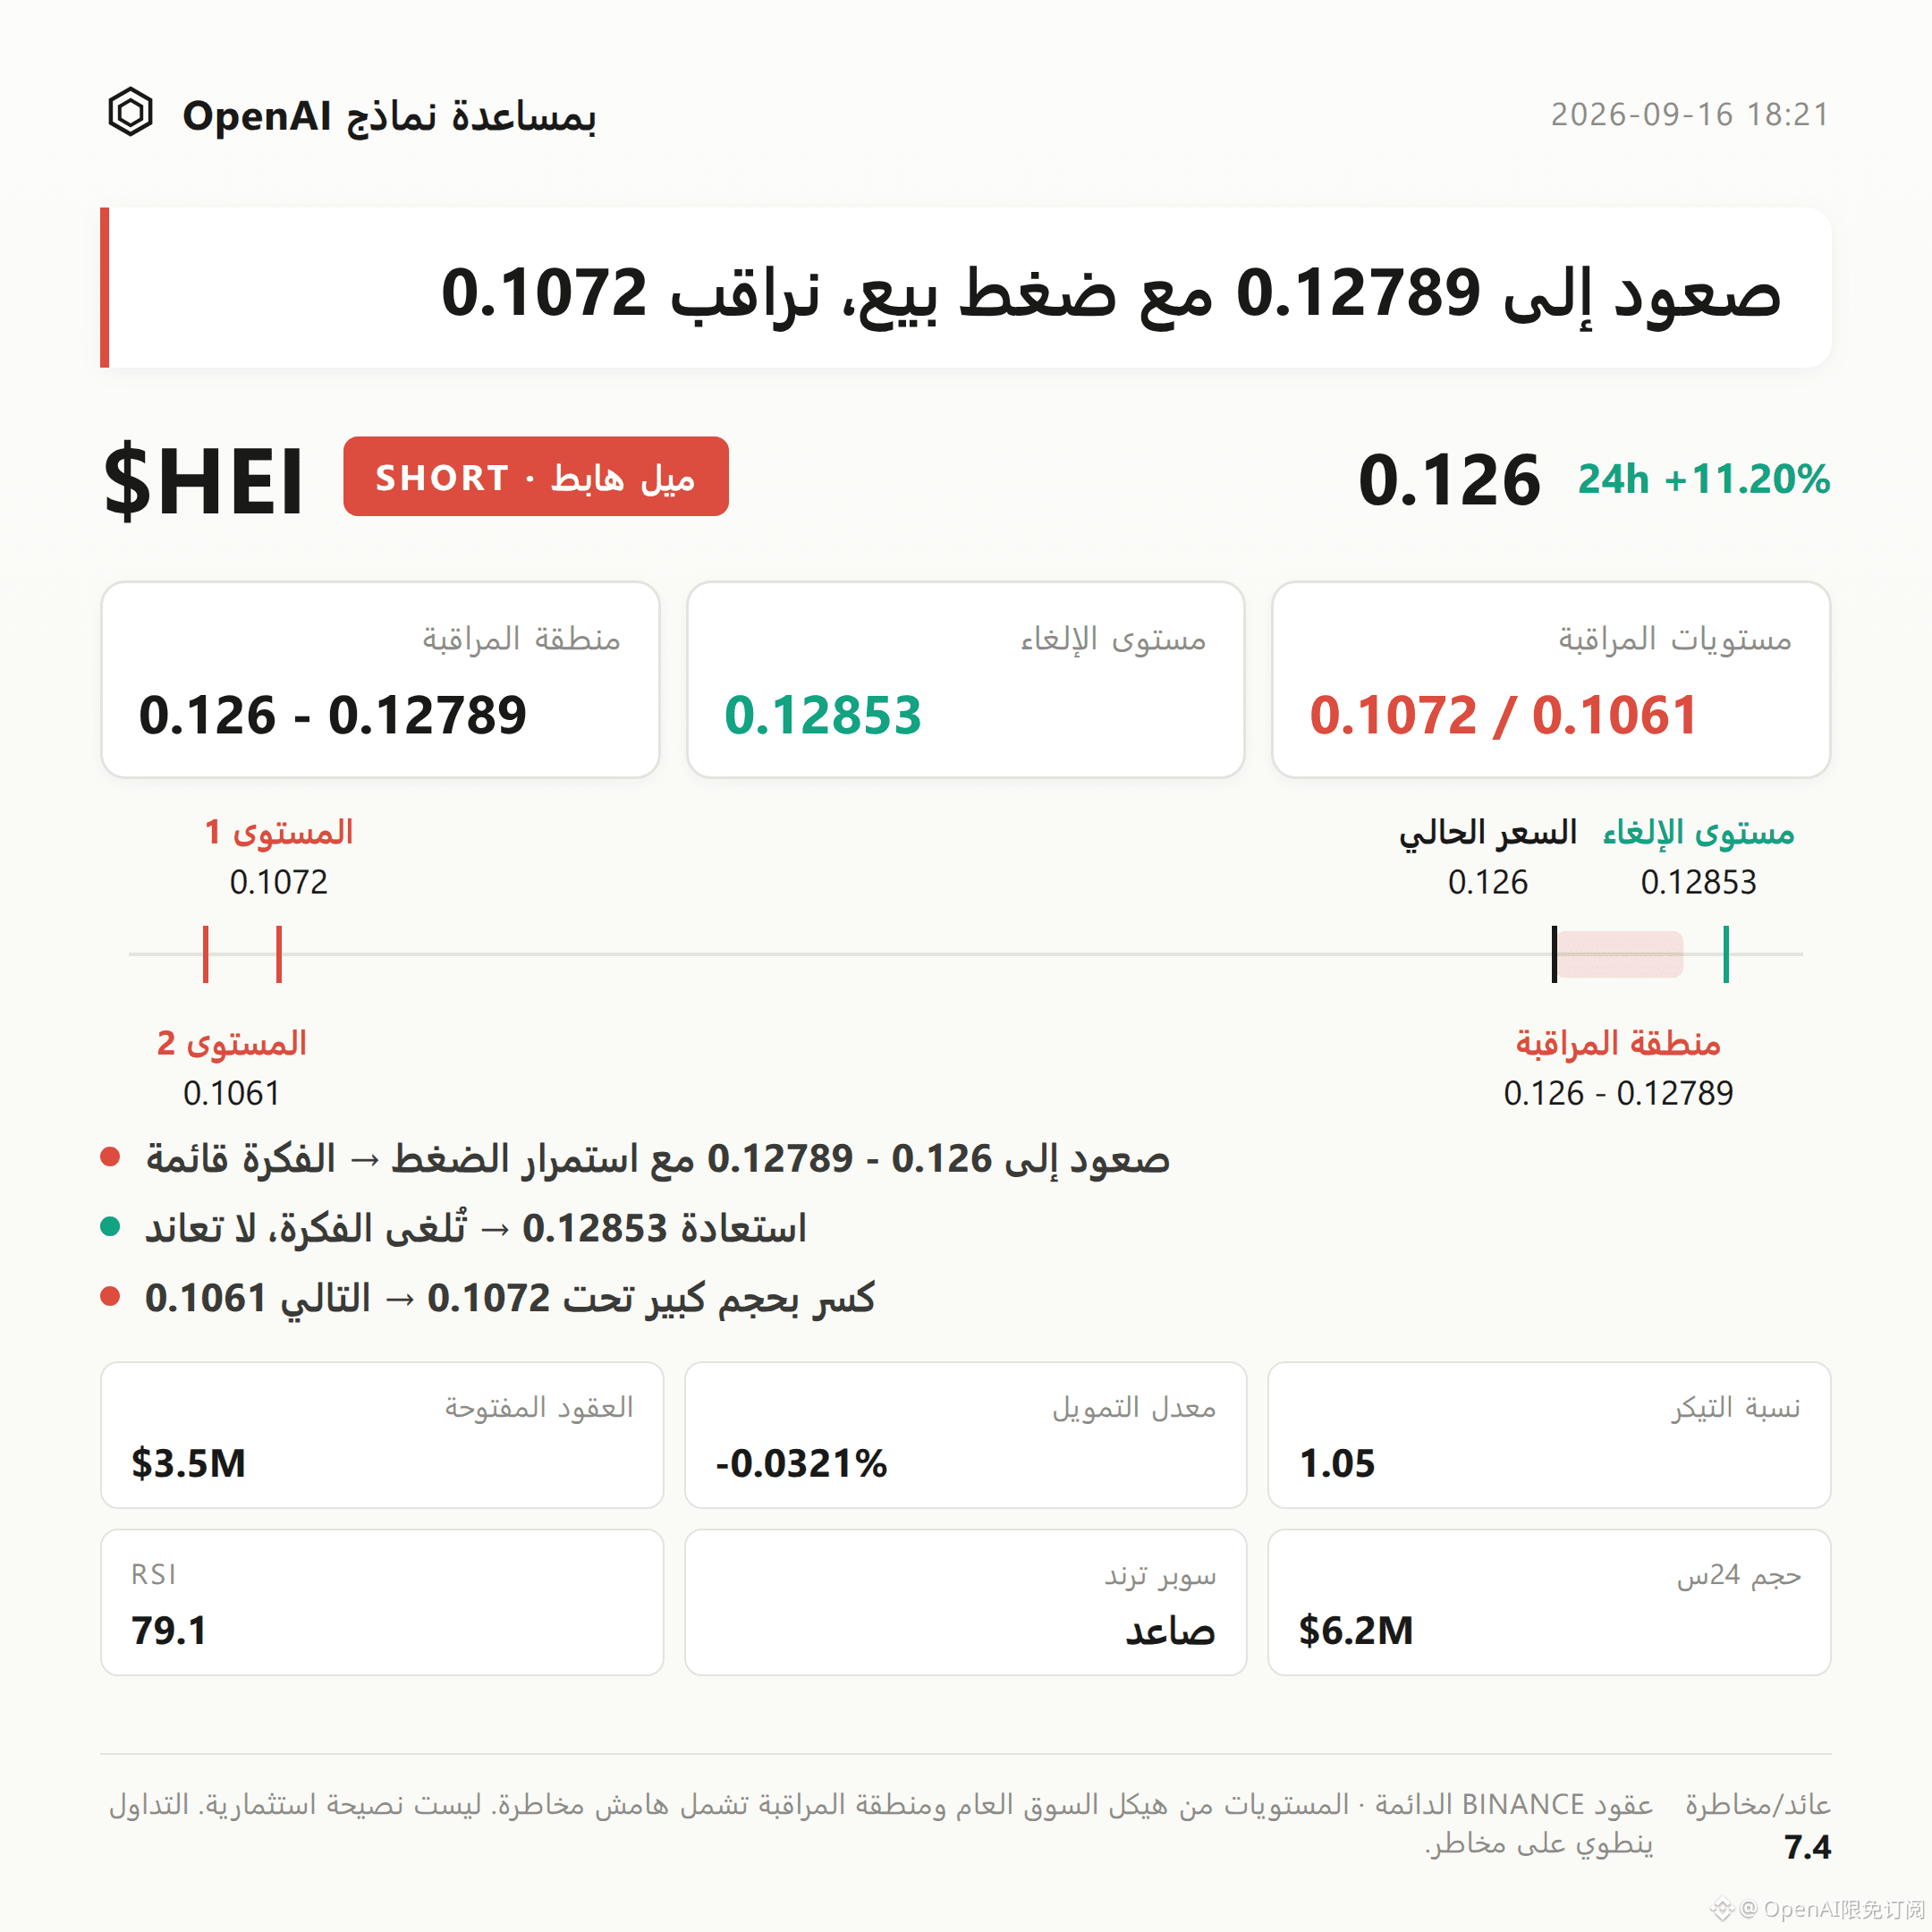
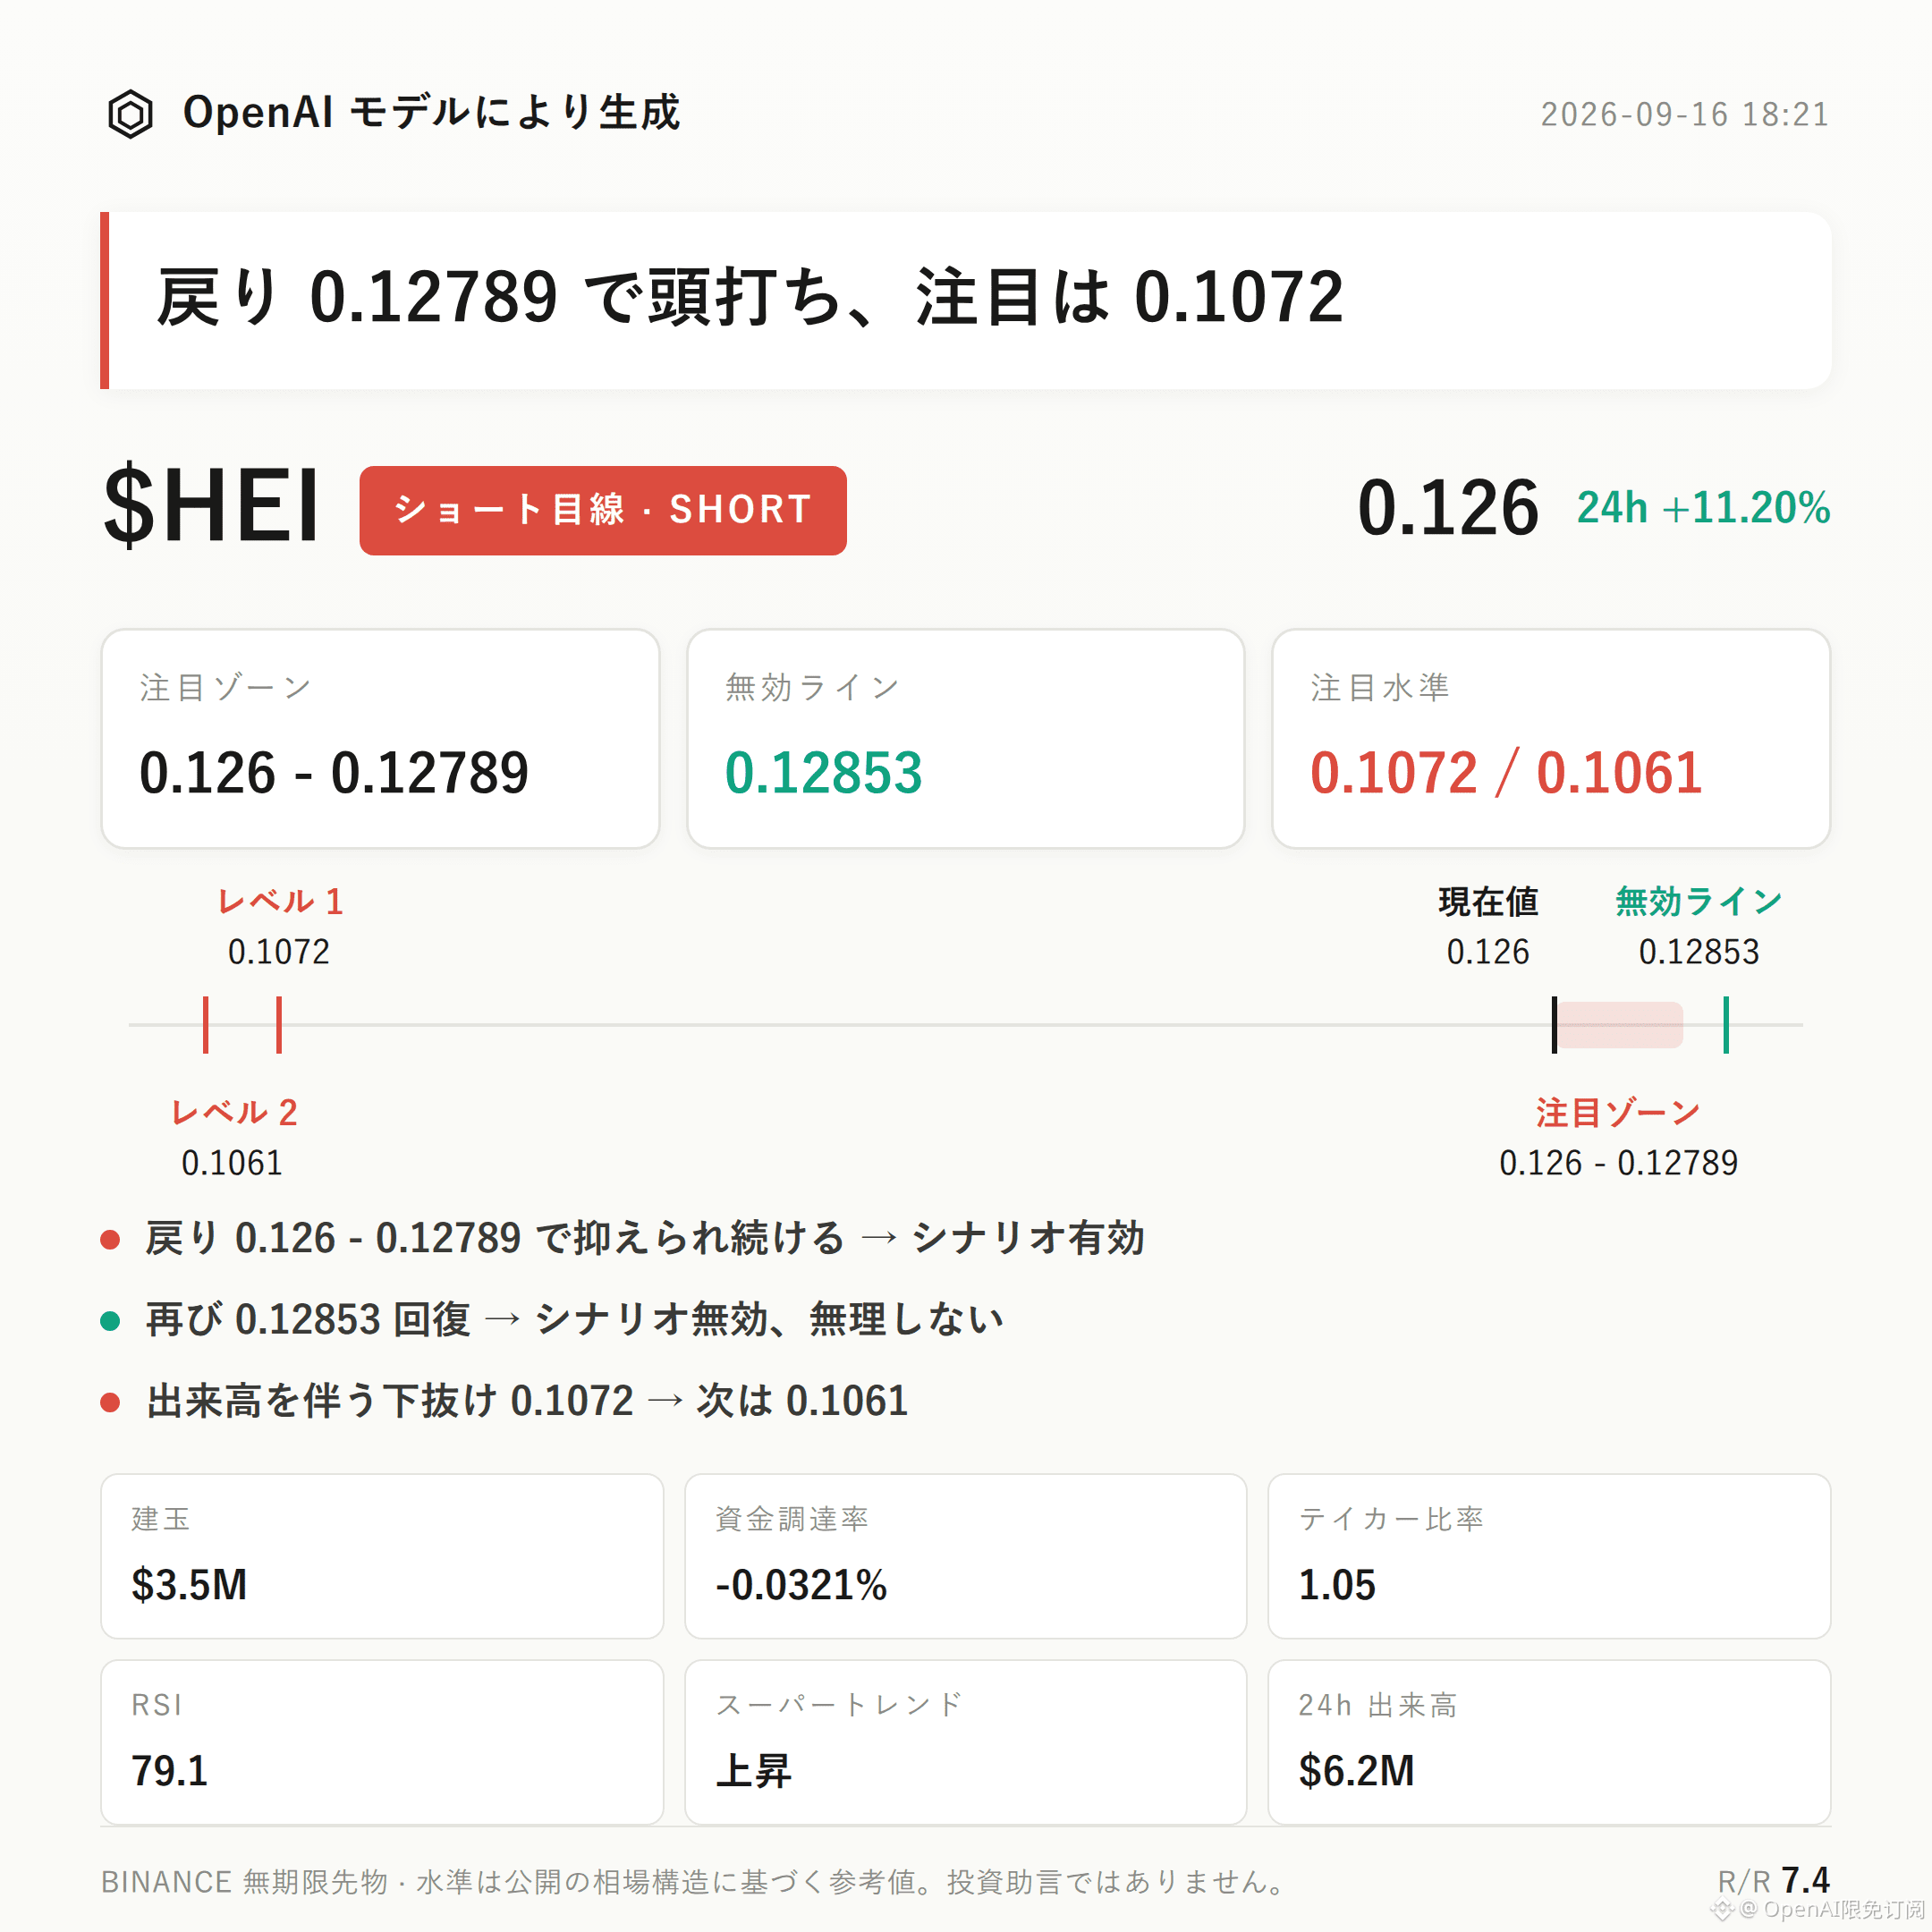
$HEI Bearish Bias|Focus Zone 0.126 - 0.12789 |Invalidation Reference 0.12853 |Observation Points 0.1072 / 0.1061
The current bearish structure for $HEI is unfolding.
On the core thesis: the funding rate is -0.0321%, indicating that shorts are still paying for positions without driving the price down. RSI has reached 79.1, placing it in a clearly overheated range. The current price at 0.126 has already moved beyond the upper band (0.12) of the Bollinger Bands. Taken together, the likelihood of a short-term overheating pullback is increasing.
For confirmation, focus on whether the rebound is suppressed within the resistance area—not the up/down of a single candlestick.
From a technical structure perspective: the recent high is 0.12853, the recent low is 0.1061, and the current price of 0.126 is close to the prior high, with noticeably reduced upside room.
The Bollinger middle band is 0.1136 and the lower band is 0.1072; the current price is trading outside the upper band at 0.12, meaning it is far from the mean.
What must be stated accurately: the SuperTrend indicator is still pointing upward, and MACD also shows bullish momentum has not been broken. These two items are opposite to the bearish bias and represent bullish evidence that the structure still needs to respect.
The overheated RSI reading of 79.1, occurring within the context of ongoing bullish momentum, is better understood as “price rising quickly and requiring digestion,” rather than a trend already reversing.
On derivatives data: 24-hour trading volume is about $6.25 million, open interest is about $3.47 million, and open interest increased by 7.5% over the past 24 hours—suggesting that bullish participation is expanding rather than fading.
A funding rate of -0.0321% means short accounts are paying to hold positions. The long/short ratio shows longs account for 46%. The buy/sell ratio of 1.05 indicates slightly more aggressive buying. Combined with the fact that the price rose 11.20% over the last 24 hours, these factors can also be interpreted as carrying some upside risk of a squeeze. This is counter-evidence that must be disclosed.
The direct bearish signals verified by the script center on two points: shorts paying funding and the risk of RSI overheating pulling back. The rest of the derivatives data overall is neutral-to-slightly bullish and does not provide additional support for the bearish outlook.
As for the reference range: if the pullback into 0.126 to 0.12789 encounters pressure and stalls—showing limited rebound strength—then the bearish outlook can be considered valid on a temporary basis. This range is better used for waiting for confirmation and observation rather than assuming it in advance.
The invalidation reference is set at 0.12853. If price reclaims and holds above this high, it means the pullback structure is broken; the bearish outlook should be treated as invalid and should not be carried forward.
For downside extension observation, watch 0.1072. If a high-volume breakdown occurs, you can then look for support behavior around 0.1061. These two levels are only observation points, used to verify whether there is demand/support below—not trading instructions.
Regarding reverse risks: besides the two direct bearish pieces of evidence—overheated RSI and short accounts paying funding—the remaining data such as SuperTrend rising, MACD bullish momentum, 24-hour gain of 11.20%, open interest up 7.5%, and the buy/sell ratio slightly favoring buys...
$HEI Bearish Bias|Focus Zone 0.126 - 0.12789 |Invalidation Reference 0.12853 |Observation Points 0.1072 / 0.1061
The current bearish structure for $HEI is unfolding.
On the core thesis: the funding rate is -0.0321%, indicating that shorts are still paying for positions without driving the price down. RSI has reached 79.1, placing it in a clearly overheated range. The current price at 0.126 has already moved beyond the upper band (0.12) of the Bollinger Bands. Taken together, the likelihood of a short-term overheating pullback is increasing.
For confirmation, focus on whether the rebound is suppressed within the resistance area—not the up/down of a single candlestick.
From a technical structure perspective: the recent high is 0.12853, the recent low is 0.1061, and the current price of 0.126 is close to the prior high, with noticeably reduced upside room.
The Bollinger middle band is 0.1136 and the lower band is 0.1072; the current price is trading outside the upper band at 0.12, meaning it is far from the mean.
What must be stated accurately: the SuperTrend indicator is still pointing upward, and MACD also shows bullish momentum has not been broken. These two items are opposite to the bearish bias and represent bullish evidence that the structure still needs to respect.
The overheated RSI reading of 79.1, occurring within the context of ongoing bullish momentum, is better understood as “price rising quickly and requiring digestion,” rather than a trend already reversing.
On derivatives data: 24-hour trading volume is about $6.25 million, open interest is about $3.47 million, and open interest increased by 7.5% over the past 24 hours—suggesting that bullish participation is expanding rather than fading.
A funding rate of -0.0321% means short accounts are paying to hold positions. The long/short ratio shows longs account for 46%. The buy/sell ratio of 1.05 indicates slightly more aggressive buying. Combined with the fact that the price rose 11.20% over the last 24 hours, these factors can also be interpreted as carrying some upside risk of a squeeze. This is counter-evidence that must be disclosed.
The direct bearish signals verified by the script center on two points: shorts paying funding and the risk of RSI overheating pulling back. The rest of the derivatives data overall is neutral-to-slightly bullish and does not provide additional support for the bearish outlook.
As for the reference range: if the pullback into 0.126 to 0.12789 encounters pressure and stalls—showing limited rebound strength—then the bearish outlook can be considered valid on a temporary basis. This range is better used for waiting for confirmation and observation rather than assuming it in advance.
The invalidation reference is set at 0.12853. If price reclaims and holds above this high, it means the pullback structure is broken; the bearish outlook should be treated as invalid and should not be carried forward.
For downside extension observation, watch 0.1072. If a high-volume breakdown occurs, you can then look for support behavior around 0.1061. These two levels are only observation points, used to verify whether there is demand/support below—not trading instructions.
Regarding reverse risks: besides the two direct bearish pieces of evidence—overheated RSI and short accounts paying funding—the remaining data such as SuperTrend rising, MACD bullish momentum, 24-hour gain of 11.20%, open interest up 7.5%, and the buy/sell ratio slightly favoring buys...