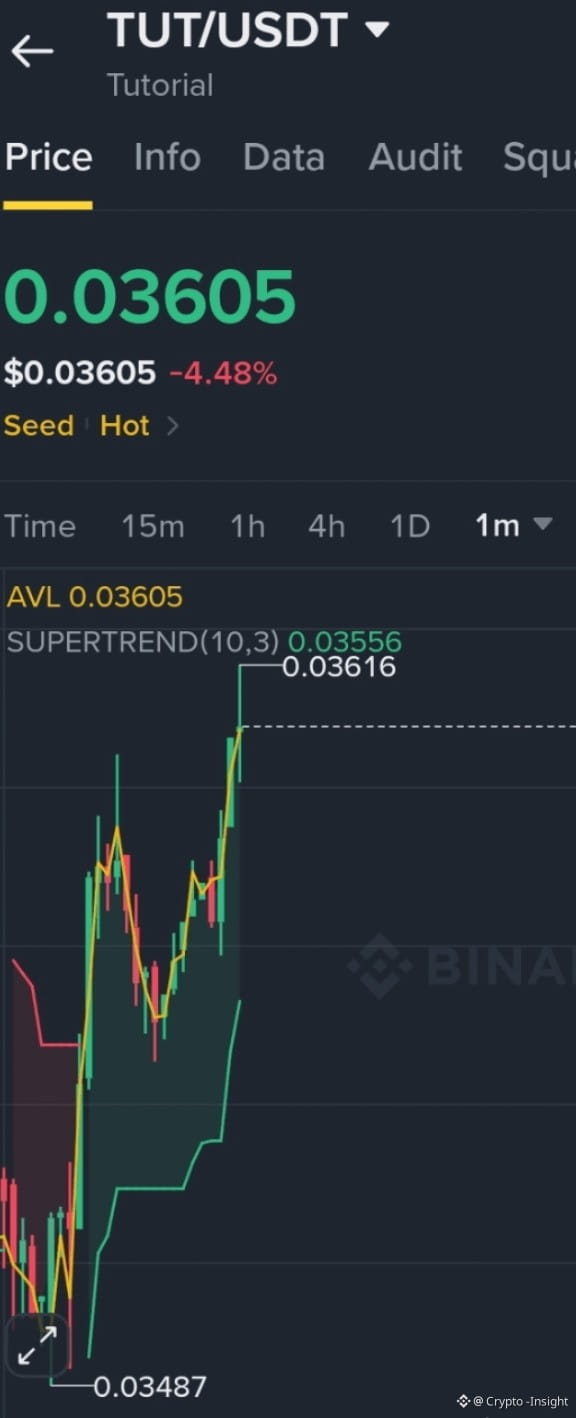
Hey Guys Check This Quick Chart Setup On $TUT ...!!
The chart for #TUT is showing a very sharp bullish move on this very short timeframe following a retest of support around 0.03487 It is currently facing its next resistance level right near 0.03616 which could cause some profit taking If it manages to push through this key area then the price might target the 0.03650 and 0.03700 zones next but if a rejection happens a quick pullback towards the 0.03550 support cannot be ruled out
$BTR
$TST
The chart for #TUT is showing a very sharp bullish move on this very short timeframe following a retest of support around 0.03487 It is currently facing its next resistance level right near 0.03616 which could cause some profit taking If it manages to push through this key area then the price might target the 0.03650 and 0.03700 zones next but if a rejection happens a quick pullback towards the 0.03550 support cannot be ruled out
$BTR
$TST