


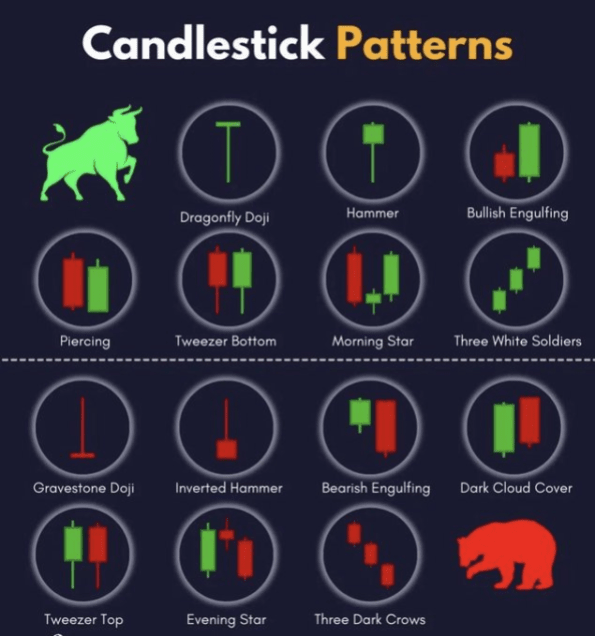
Each candlestick provides essential information about the market, including the opening, closing, high, and low prices within a given time frame. These data points are represented visually through the candlestick's body and wicks. The body represents the price range between the opening and closing prices, while the wicks (or shadows) indicate the high and low prices during that period.
Candlestick patterns are not just random formations; they follow specific shapes and configurations that traders interpret to predict future price movements. Traders use these patterns to identify potential trend reversals, continuations, or market indecision. By understanding the psychology of market participants reflected in these patterns, traders can make more informed decisions about buying or selling assets.
Different candlestick patterns convey different signals. For instance, a Doji candlestick, characterized by its small body, indicates market indecision and potential reversals. On the other hand, an engulfing pattern, where one candle completely engulfs the previous one, suggests a strong reversal signal.
Traders often combine candlestick patterns with other technical indicators and chart patterns to enhance their trading strategies. The ability to recognize and interpret these patterns accurately can provide valuable insights into market sentiment, helping traders make timely and profitable trading decisions.