

#xusd
xusd
247,534 views
608 Discussing
Hot
Latest

·
--
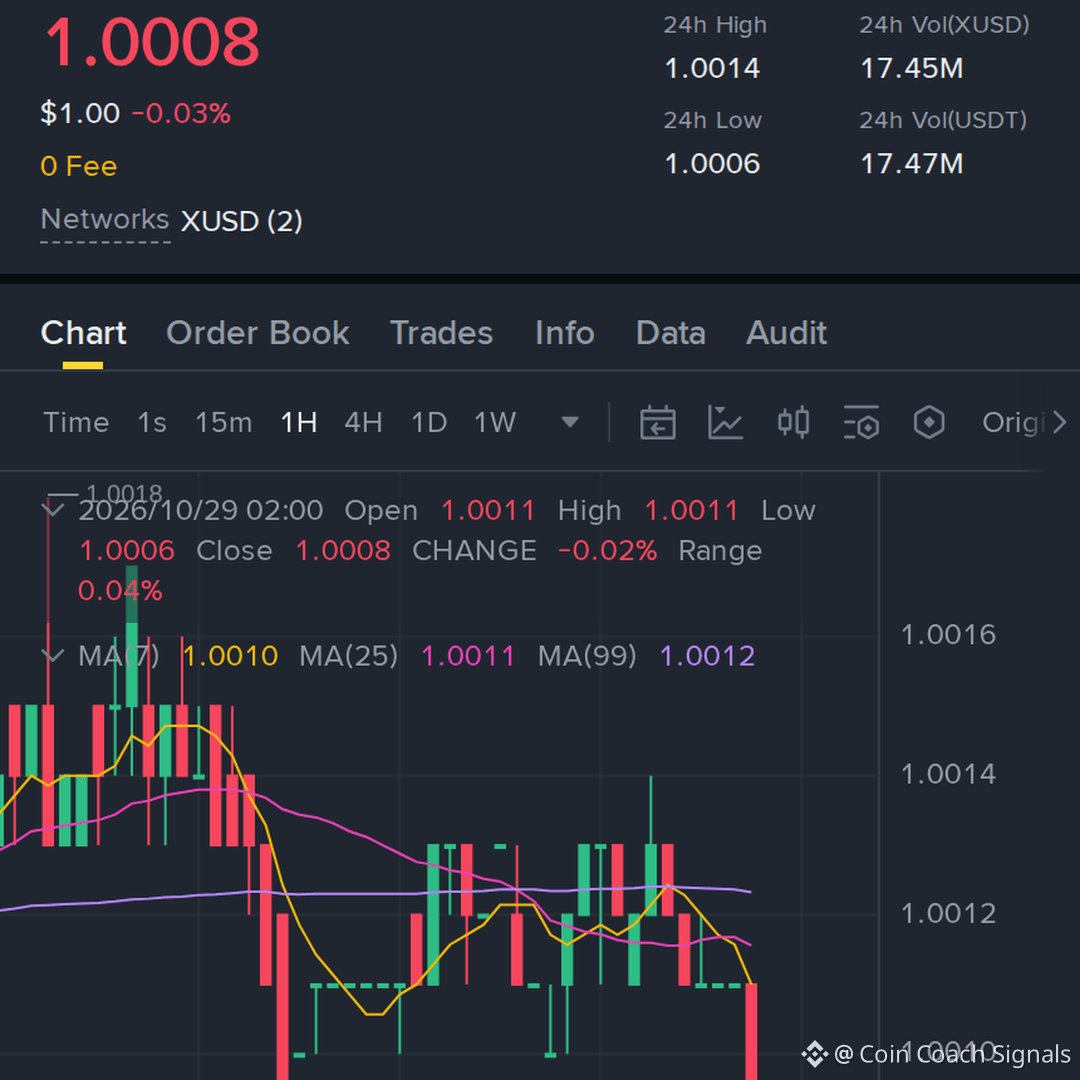
Is $XUSD losing its tight range during this quiet session?
Current price sits at $1.0008 on $17.47M daily volume with a flat 0.03% change. Hourly action shows flat momentum near 1.0011 alongside a tight 23-hour range of 1.001 to 1.0014.
A confirmed push above the 1.0014 hourly high points to short-term bullish continuation, while a break below the 1.001 low invalidates this setup.
Will the price reclaim 1.0014 first, or break down below 1.001?
Tap $XUSD for the live chart. #XUSD #BinanceSquare
1
·
--
Is $XUSD breaking out or merely consolidating inside a tight range?
The asset trades at $1.0011 after moving just +0.01% over 24 hours with $16.60M in volume. Hourly volume remains flat relative to the daily average, showing minimal participation despite a 23-hour high of 1.0014.
Watch the upper boundary near 1.0014 for a potential continuation setup, while a drop back toward the 1.0009 low signals fading momentum.
Will you wait for a confirmed hourly close above 1.0014, or does a slip back to 1.0009 invalidate the breakout thesis for you?
Tap $XUSD for the live chart. #XUSD #BinanceSquare
2


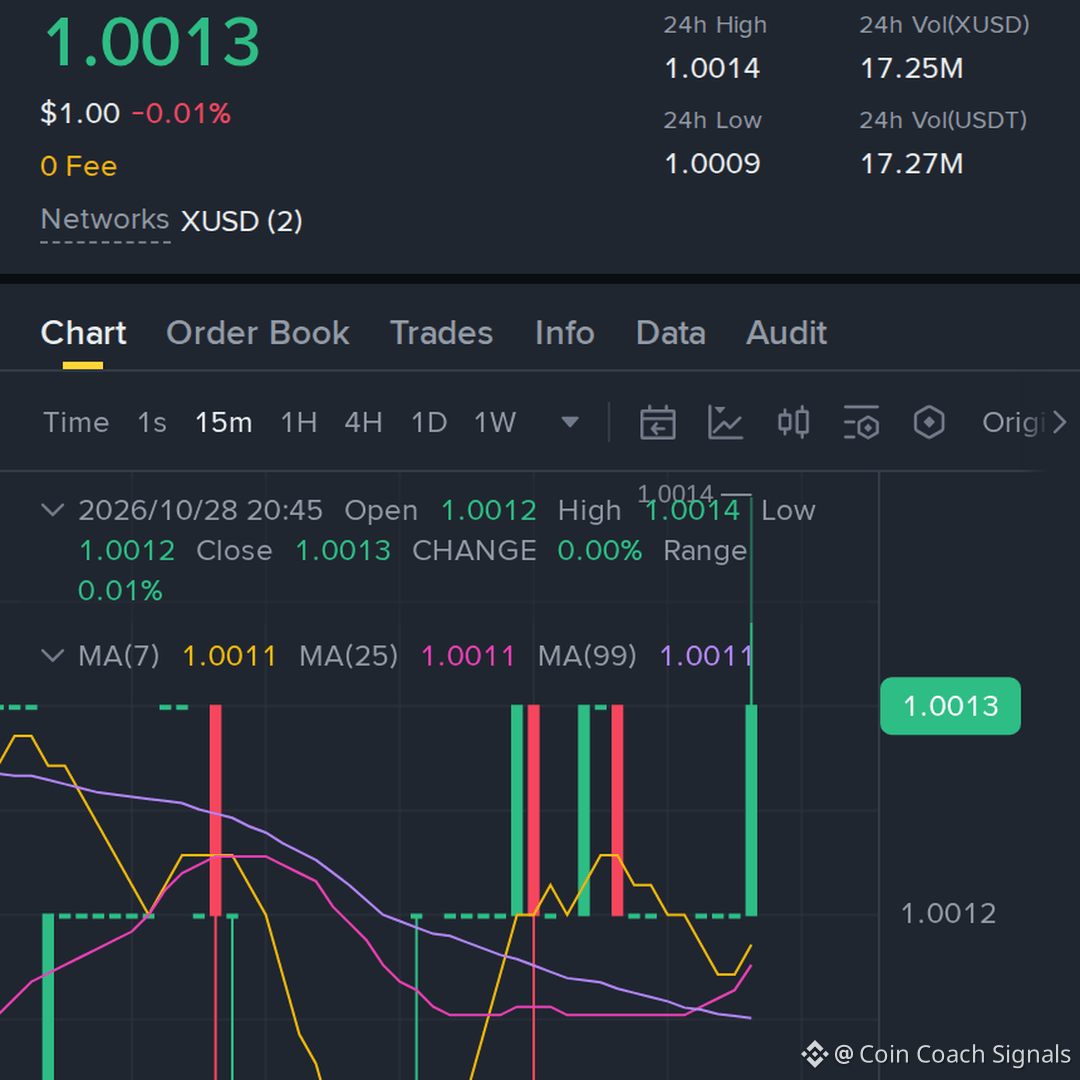
this is getting interesting, $XUSD gave a controlled pullback and the trend is trying to continue, keeping the setup around 30x
Entry: 1.0013–1.0013
TP1: 1.0243 → TP2: 1.0436 → TP3: 1.0766
Stop Loss: 0.9853
#XUSD #Crypto #Write2Earn #Binance
this is getting interesting, $XUSD gave a controlled pullback and the trend is trying to continue, keeping the setup around 30x
Entry: 1.0013–1.0013
TP1: 1.0243 → TP2: 1.0436 → TP3: 1.0766
Stop Loss: 0.9853
#XUSD #Crypto #Write2Earn #Binance
Entry: 1.0013–1.0013
TP1: 1.0243 → TP2: 1.0436 → TP3: 1.0766
Stop Loss: 0.9853
#XUSD #Crypto #Write2Earn #Binance
1
176

$XUSD: Exploring Divergent Hourly Volume Patterns
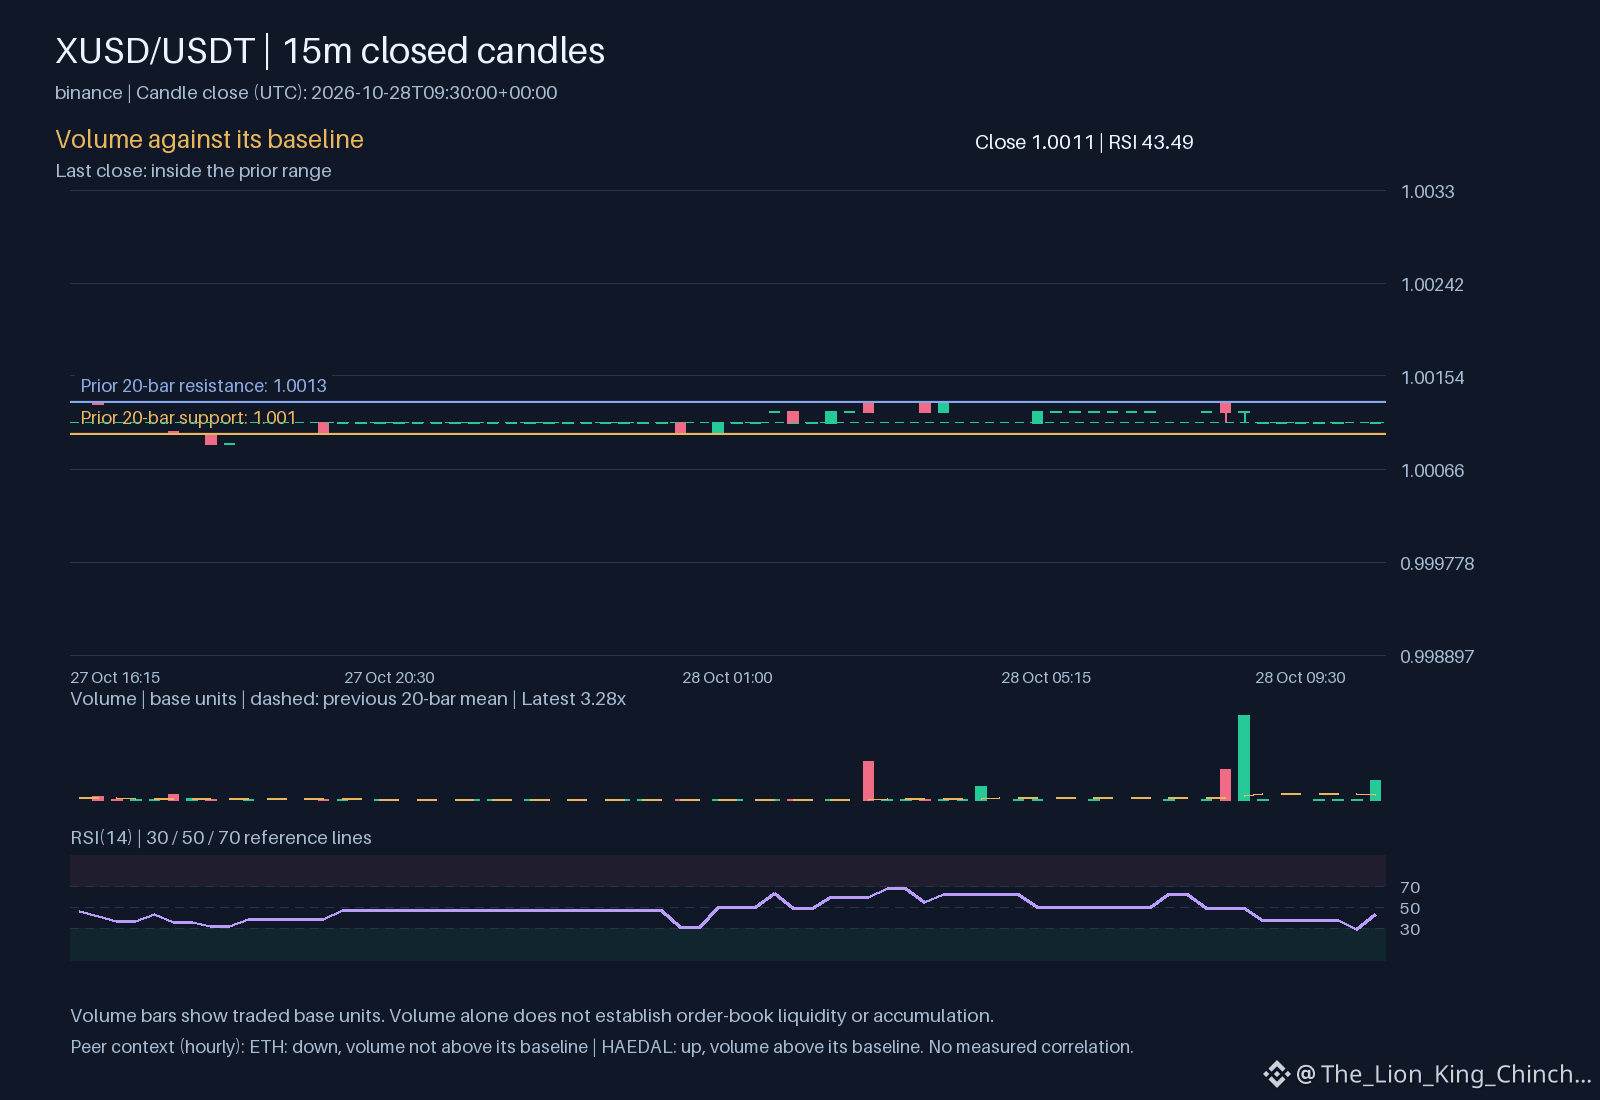
Evaluating $XUSD requires a look at how it interacts with the broader environment. Currently, $XUSD shows volume 3.28043 which is above its baseline. While the hourly direction is flat or unavailable, this activity suggests a period of high participation. In contrast, peer observations show $ETH with an hourly direction that is down and volume not above its baseline. Meanwhile, $HAEDAL shows an hourly direction that is up with volume above its baseline. These variations on the same venue illustrate that assets often move independently of each other.
One mechanism to consider is how volume interacts with price stability. When volume is high but direction remains flat, it may indicate a state of equilibrium where buyers and sellers are matched. This differs from $HAEDAL, where volume supports a clear upward move. A shared hourly direction between two assets is not a measured correlation or a sign of capital rotation. It simply reflects a snapshot of time.
To reassess this interpretation, one should monitor if the current $XUSD volume leads to a break from its flat direction. If $XUSD price eventually follows the volume spike, the initial flat period might be seen as a phase of accumulation or distribution. High volume without direction is a signal of uncertainty, and comparing it to the clearer trends in peers helps highlight the unique risks of the current $XUSD setup. ⚖️
Probabilistic market research, not a recommendation or guaranteed return.
The comparison to keep in mind: $ETH has hourly direction down and volume not above its baseline; $HAEDAL has hourly direction up and volume above its baseline. This alone does not establish correlation.
Which matters more in this comparison: direction or how the move holds?
#XUSD #ETH
$XUSD : Exploring Divergent Hourly Volume Patterns
Evaluating $XUSD requires a look at how it interacts with the broader environment. Currently, $XUSD shows volume 3.28043 which is above its baseline. While the hourly direction is flat or unavailable, this activity suggests a period of high participation. In contrast, peer observations show $ETH with an hourly direction that is down and volume not above its baseline. Meanwhile, $HAEDAL shows an hourly direction that is up with volume above its baseline. These variations on the same venue illustrate that assets often move independently of each other.
One mechanism to consider is how volume interacts with price stability. When volume is high but direction remains flat, it may indicate a state of equilibrium where buyers and sellers are matched. This differs from $HAEDAL , where volume supports a clear upward move. A shared hourly direction between two assets is not a measured correlation or a sign of capital rotation. It simply reflects a snapshot of time.
To reassess this interpretation, one should monitor if the current $XUSD volume leads to a break from its flat direction. If $XUSD price eventually follows the volume spike, the initial flat period might be seen as a phase of accumulation or distribution. High volume without direction is a signal of uncertainty, and comparing it to the clearer trends in peers helps highlight the unique risks of the current $XUSD setup. ⚖️
Probabilistic market research, not a recommendation or guaranteed return.
The comparison to keep in mind: $ETH has hourly direction down and volume not above its baseline; $HAEDAL has hourly direction up and volume above its baseline. This alone does not establish correlation.
Which matters more in this comparison: direction or how the move holds?
#XUSD #ETH
134

·
--
Tight range compression signals a crucial decision point ahead.
$XUSD trades at $1.0012, down just 0.03% over 24 hours on $18.19M in volume. Recent hourly activity shows subdued momentum at 0.93x the prior daily average.
A bullish continuation scenario requires reclaiming the upper range boundary at 1.0017 with expanding volume. Conversely, an invalidation scenario forms if selling pressure pushes below the session low of 1.0009.
Will a breakout above 1.0017 attract the volume needed to sustain momentum, or does a drop under 1.0009 invalidate the current stabilization phase?
Tap $XUSD for the live chart. #XUSD #BinanceSquare
4
·
--
A 0.08x volume drop tells a story of quiet exhaustion.
$XUSD trades at $1.0013 with a flat 24h change of -0.01% on $18.19M volume. The preceding 23-hour range held between 1.0009 and 1.0017, reflecting tight consolidation.
As a conditional watch scenario, a sustained push past the 1.0017 high could signal renewed momentum, while a slip under the 1.0009 low would invalidate near-term stabilization.
Will a break above the 1.0017 upper range boundary confirm continuation, or will losing 1.0009 invalidate the setup?
Tap $XUSD for the live chart. #XUSD #BinanceSquare
·
--
Is this tight range the calm before a directional move?
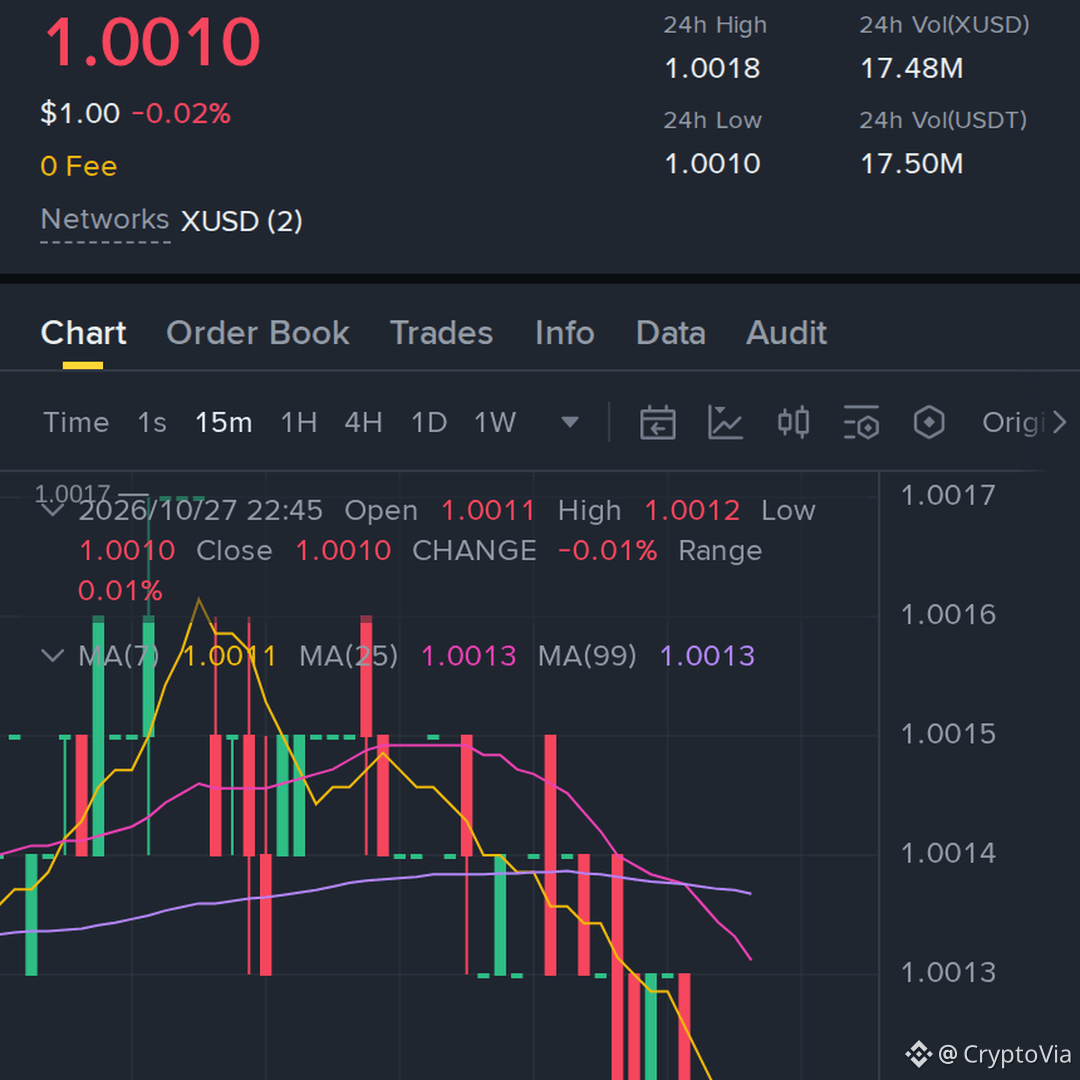
$XUSD is hovering at $1.0011 after a flat 24 hours on $17.57M in volume. Price action remains compressed near the lower boundary of its recent 1.0009 to 1.0018 range, showing minimal hourly movement.
A push back above 1.0018 could signal renewed buying interest, while a dip under 1.0009 risks invalidating the current stabilization setup.
Will buyers reclaim the upper boundary, or will weakness break the lower range first?
Tap $XUSD for the live chart. #XUSD #BinanceSquare

·
--
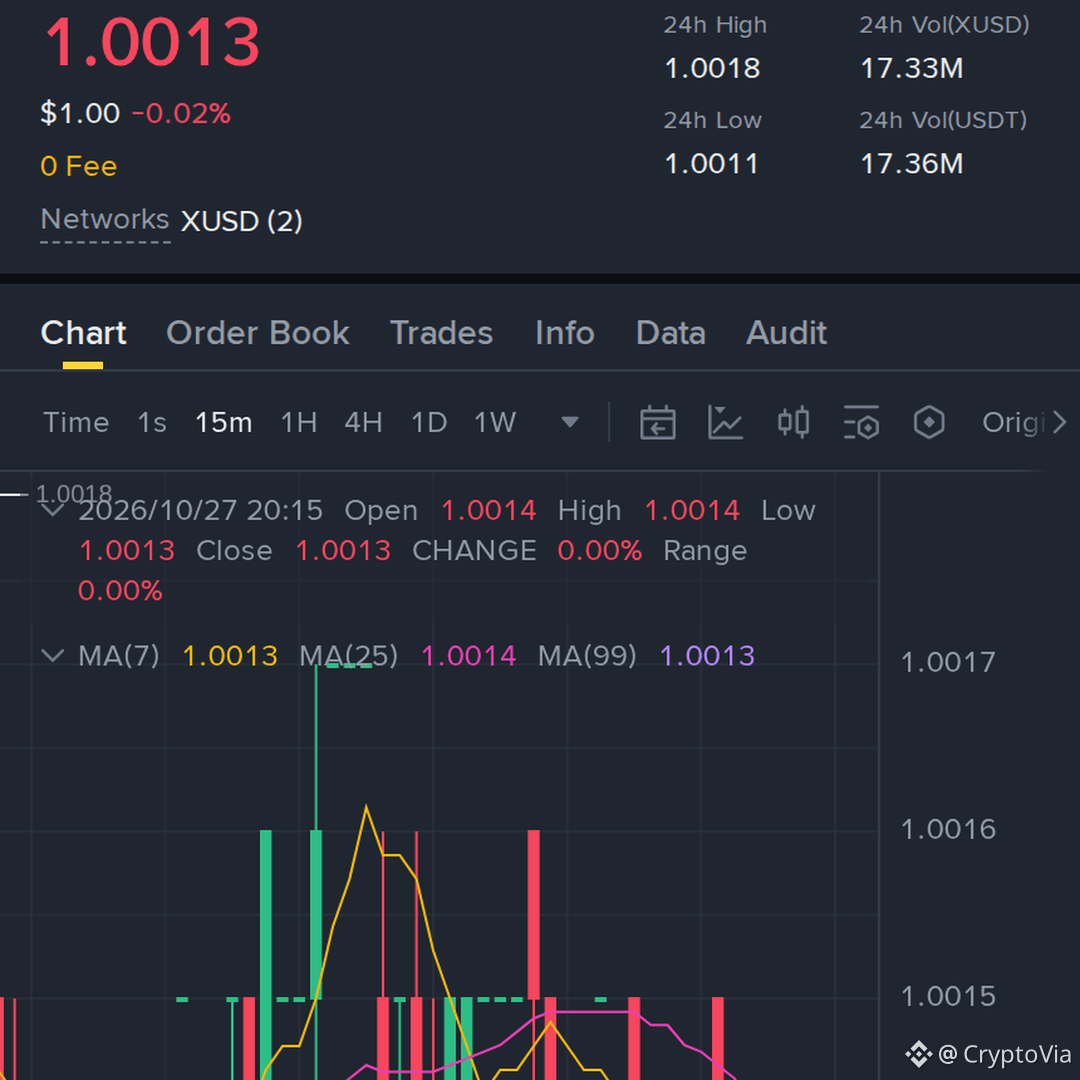
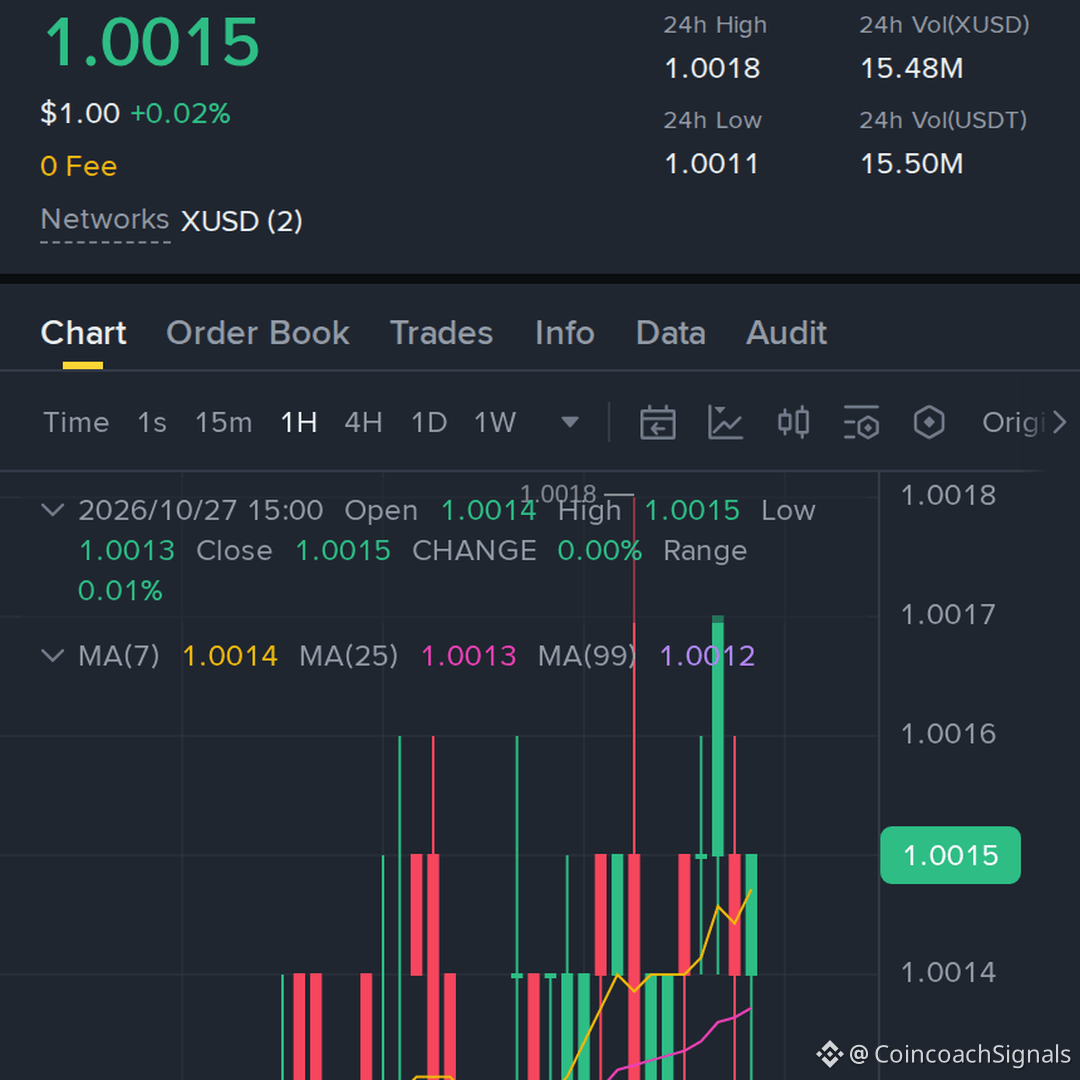
still tracking $XUSD, keeps rejecting the same area, so the short side is worth watching
Entry: 1.0013–1.0013
TP1: 0.9766 → TP2: 0.9591 → TP3: 0.9342
Stop Loss: 1.0173
#XUSD #Binance #Write2Earn #Crypto
still tracking $XUSD , keeps rejecting the same area, so the short side is worth watching
Entry: 1.0013–1.0013
TP1: 0.9766 → TP2: 0.9591 → TP3: 0.9342
Stop Loss: 1.0173
#XUSD #Binance #Write2Earn #Crypto
Entry: 1.0013–1.0013
TP1: 0.9766 → TP2: 0.9591 → TP3: 0.9342
Stop Loss: 1.0173
#XUSD #Binance #Write2Earn #Crypto
27


·
--
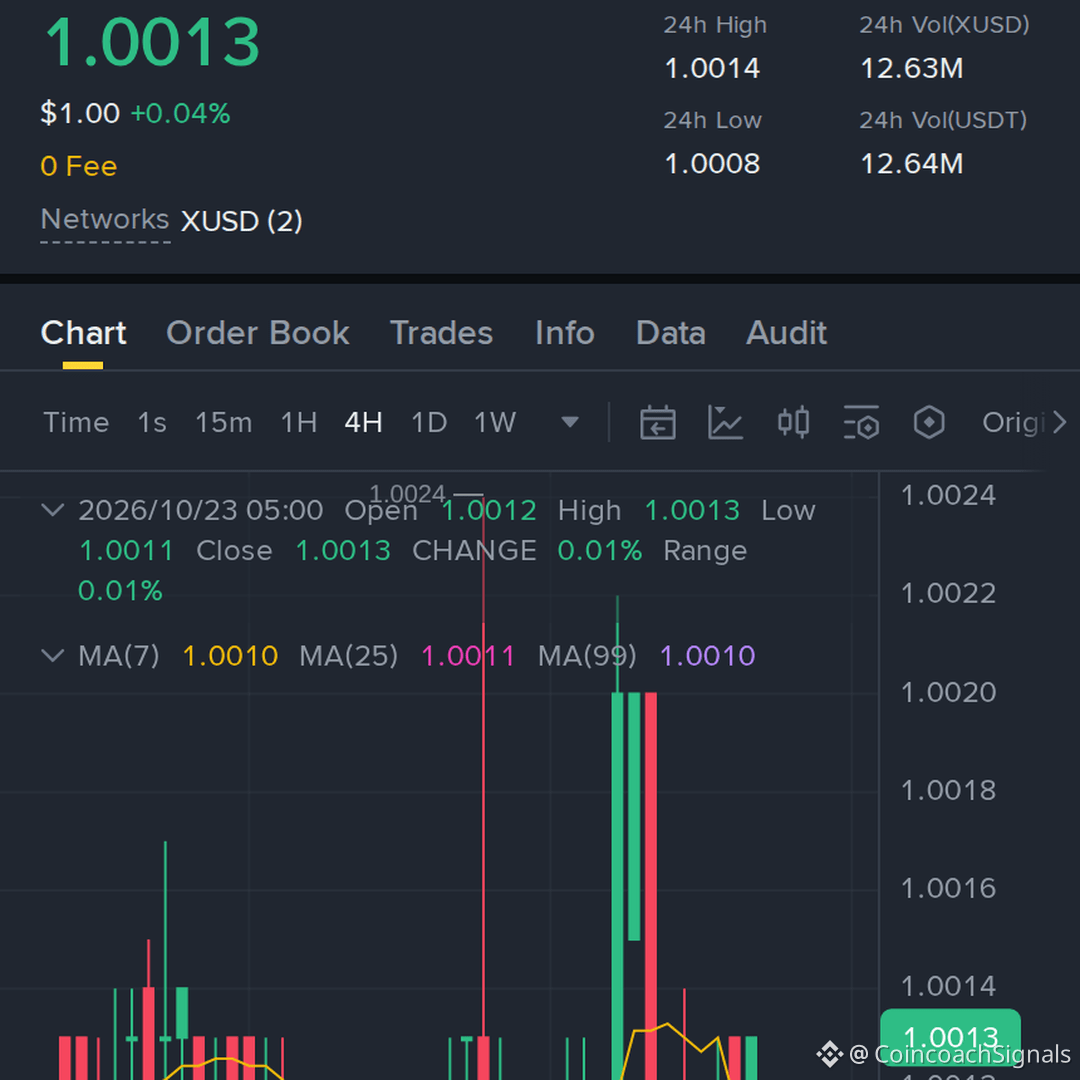
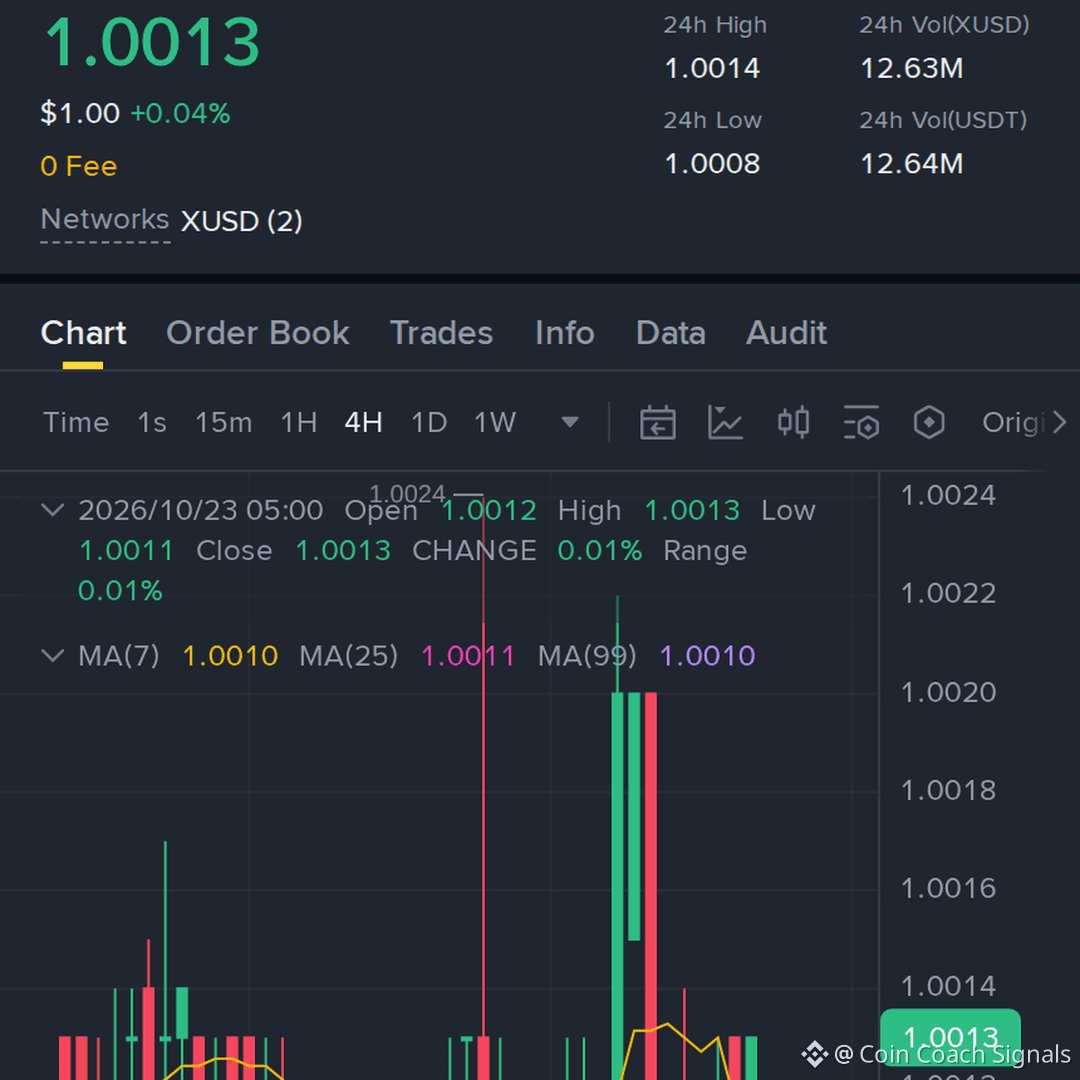
📊 Crypto Market Analysis | October 23, 2026
🔹 $XUSD : Monitor price stability, liquidity, and market activity. Confirm the asset’s trading pair and live price before making any trading decisions.
🔹 $BCH (Bitcoin Cash): BCH could attract buyers if bullish momentum strengthens and key support holds. A breakout above resistance with rising volume may signal a potential upward move.
🔹 $MSTR USDT: Watch Bitcoin’s direction and market sentiment closely. Strong momentum could support a bullish move, while a BTC pullback may increase volatility.
⚠️ Trading Tip: Always check live prices, confirm support and resistance, and use stop-loss protection. No trade guarantees profits.
#XUSD #BCH #BitcoinCash #MSTRUSDT #CryptoAnalysis #MarketUpdate #CryptoTrading #TradingStrategy
{spot}(XUSDUSDT)
{future}(MSTRUSDT)
{future}(BCHUSDT)
📊 Crypto Market Analysis | October 23, 2026
🔹 $XUSD : Monitor price stability, liquidity, and market activity. Confirm the asset’s trading pair and live price before making any trading decisions.
🔹 $BCH (Bitcoin Cash): BCH could attract buyers if bullish momentum strengthens and key support holds. A breakout above resistance with rising volume may signal a potential upward move.
🔹 $MSTR USDT: Watch Bitcoin’s direction and market sentiment closely. Strong momentum could support a bullish move, while a BTC pullback may increase volatility.
⚠️ Trading Tip: Always check live prices, confirm support and resistance, and use stop-loss protection. No trade guarantees profits.
#XUSD #BCH #BitcoinCash #MSTRUSDT #CryptoAnalysis #MarketUpdate #CryptoTrading #TradingStrategy

65

buyers are showing up on $XUSD, gave a controlled pullback and the trend is trying to continue, keeping roughly 37x in play
Entry: 1.0012–1.0013
TP1: 1.0258 → TP2: 1.045 → TP3: 1.0656
Stop Loss: 0.9852
#XUSD #Write2Earn #crypto #binance
buyers are showing up on $XUSD , gave a controlled pullback and the trend is trying to continue, keeping roughly 37x in play
Entry: 1.0012–1.0013
TP1: 1.0258 → TP2: 1.045 → TP3: 1.0656
Stop Loss: 0.9852
#XUSD #Write2Earn #crypto #binance
Entry: 1.0012–1.0013
TP1: 1.0258 → TP2: 1.045 → TP3: 1.0656
Stop Loss: 0.9852
#XUSD #Write2Earn #crypto #binance
10

·
--
$XUSD -0.03% | $FDUSD -0.08% | $EUR -0.16%
#XUSD steadies at $1.00, down 0.03% on $12.9 M of volume. Its contract, launched on Ethereum in Feb 2024 by StraitsX, shows little price movement despite solid trading.
#FDUSD trades at $0.9982, slipping 0.08% with $20.2 M exchanged. The volume outpaces the price dip, hinting at active market interest.
#EUR sits at $1.12, down 0.16% on $7.6 M of volume. The euro‑linked token sees modest sell pressure amid the broader stablecoin flow.
👀 Watch how the higher volumes for FDUSD and XUSD could translate into price shifts if demand shifts.
#Write2Earn #Binance
1

·
--
$XUSD +0.01% | $USDE +0.01% | $USD1 +0.01%
#XUSD nudged to $1.00, up +0.01% on $13.0 M volume. The token’s smart contract on Ethereum was first deployed in February 2024 by StraitsX, which may keep some attention on its stability.
#USDE held at $1.00, also climbing +0.01% with $1.5 M changing hands. The modest flow suggests a quiet, balanced market for this peg.
#USD1 slipped just a touch to $0.9999, up +0.01% on a hefty $146.6 M volume. Such large turnover despite the tiny price move could hint at active rebalancing.
👀 Watch how the stark volume gap between USD1 and the other stablecoins plays out in the next session.
#Write2Earn #Binance
7

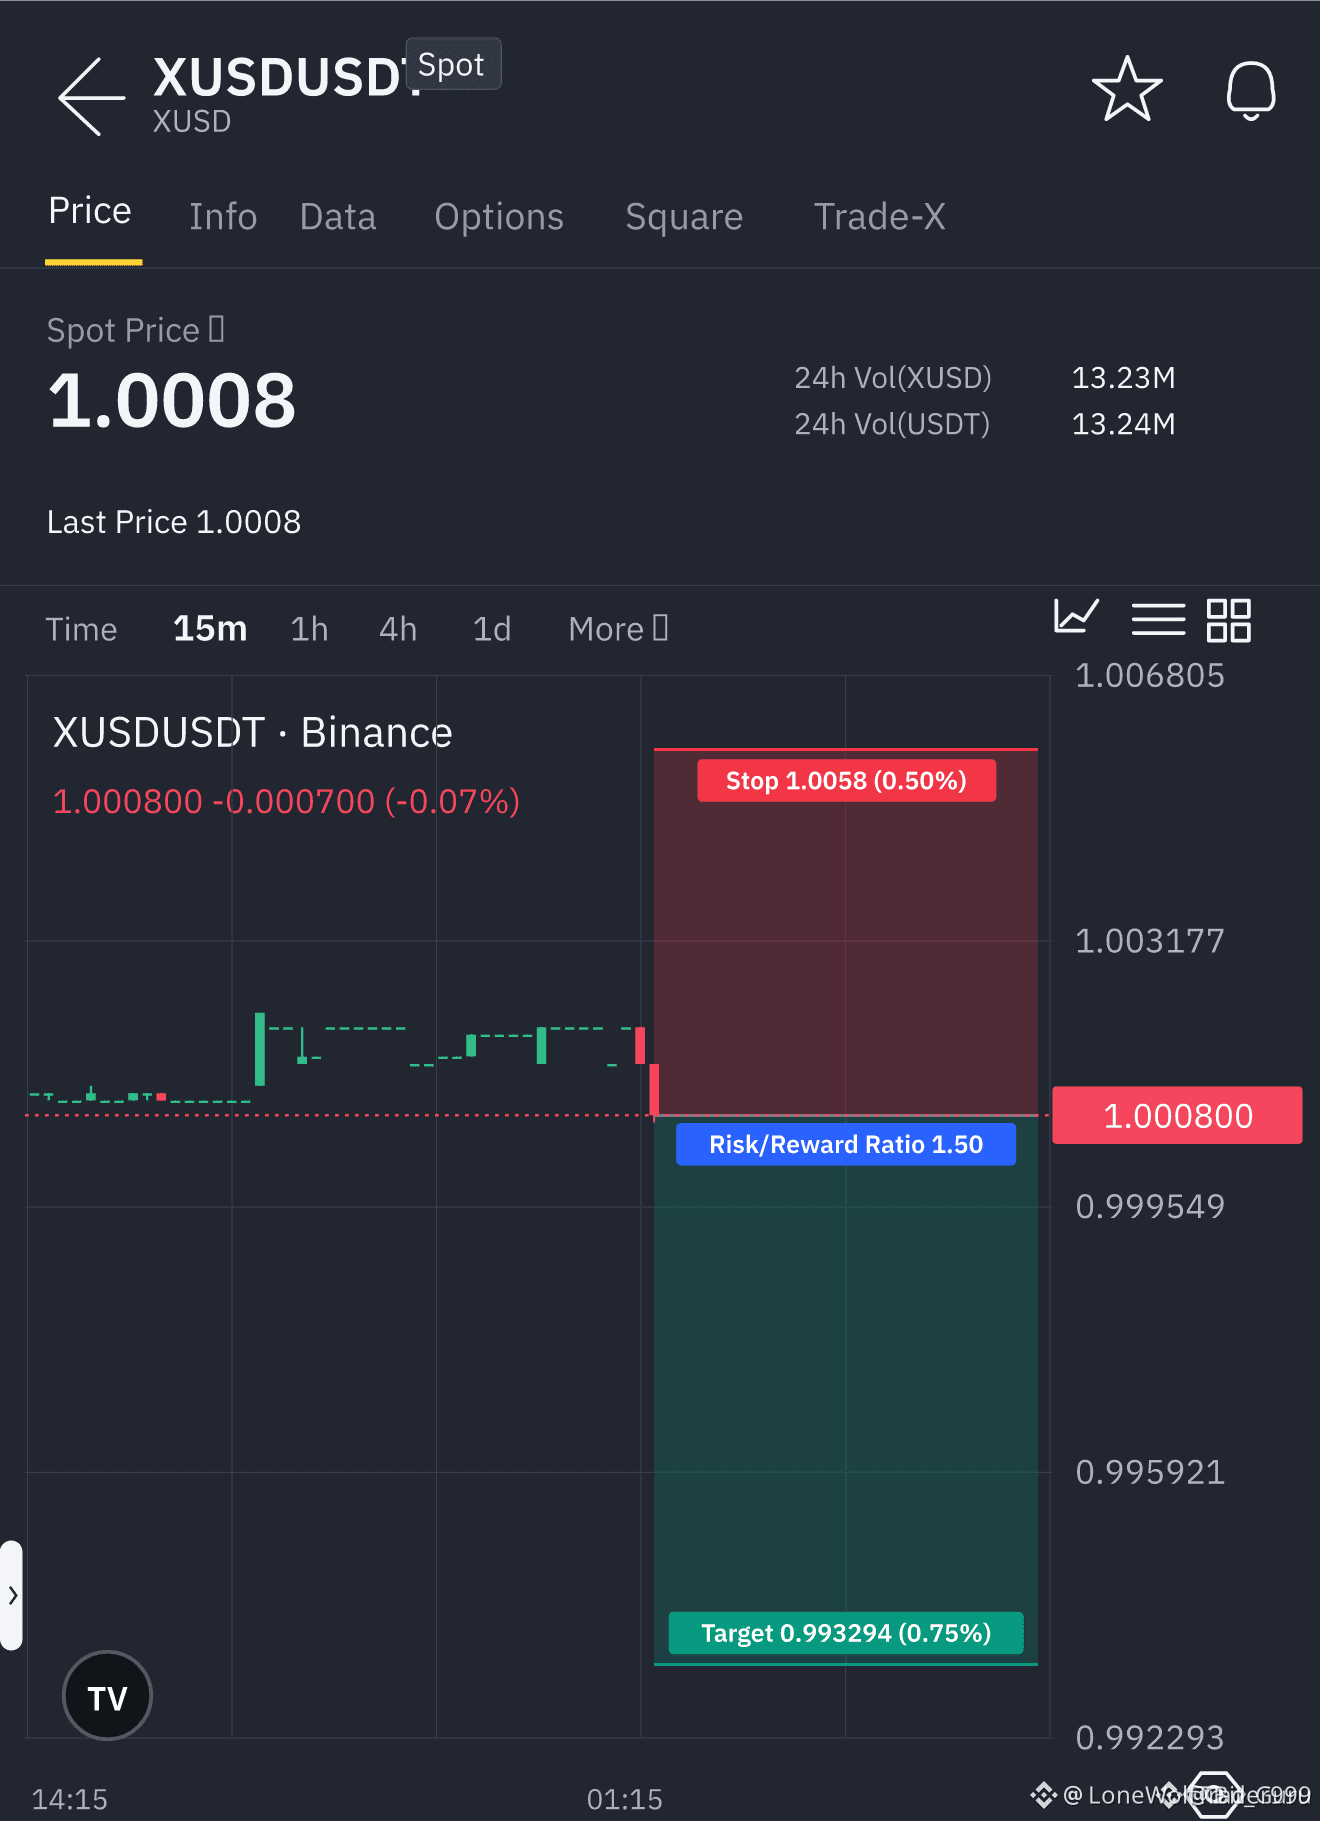
🔴 $XUSD SLIDES INTO BEARISH ZONE AS VOLUME SURGES 🚨
Entry: 1.0008 ⚡
Target: 0.99329 🚀
Target: 0.98829 🚀
Target: 0.98078 🚀
Stop Loss: 1.0058 ⚠️
The 5‑minute candle cracked the 20‑candle range, dumping into the 1.0008‑1.0058 corridor while volume exploded 4,172× the norm. 📊 The 15‑minute trend now points sharply down, confirming the liquidity sweep. 🌊
Smart money is ripping the last demand block, and each bite drags price toward the 0.99329‑0.98078 corridor. ⚡ Expect the next wave of sell orders to hammer the level, feeding the bearish cascade. 💬 Are you ready to flip your position and ride the downtrend? 👇
⚠️ Not financial advice. Always manage your risk. 🛡️
🏷️ #XUSD #BearishSetup #Short #Crypto
🔥 🦈

·
--
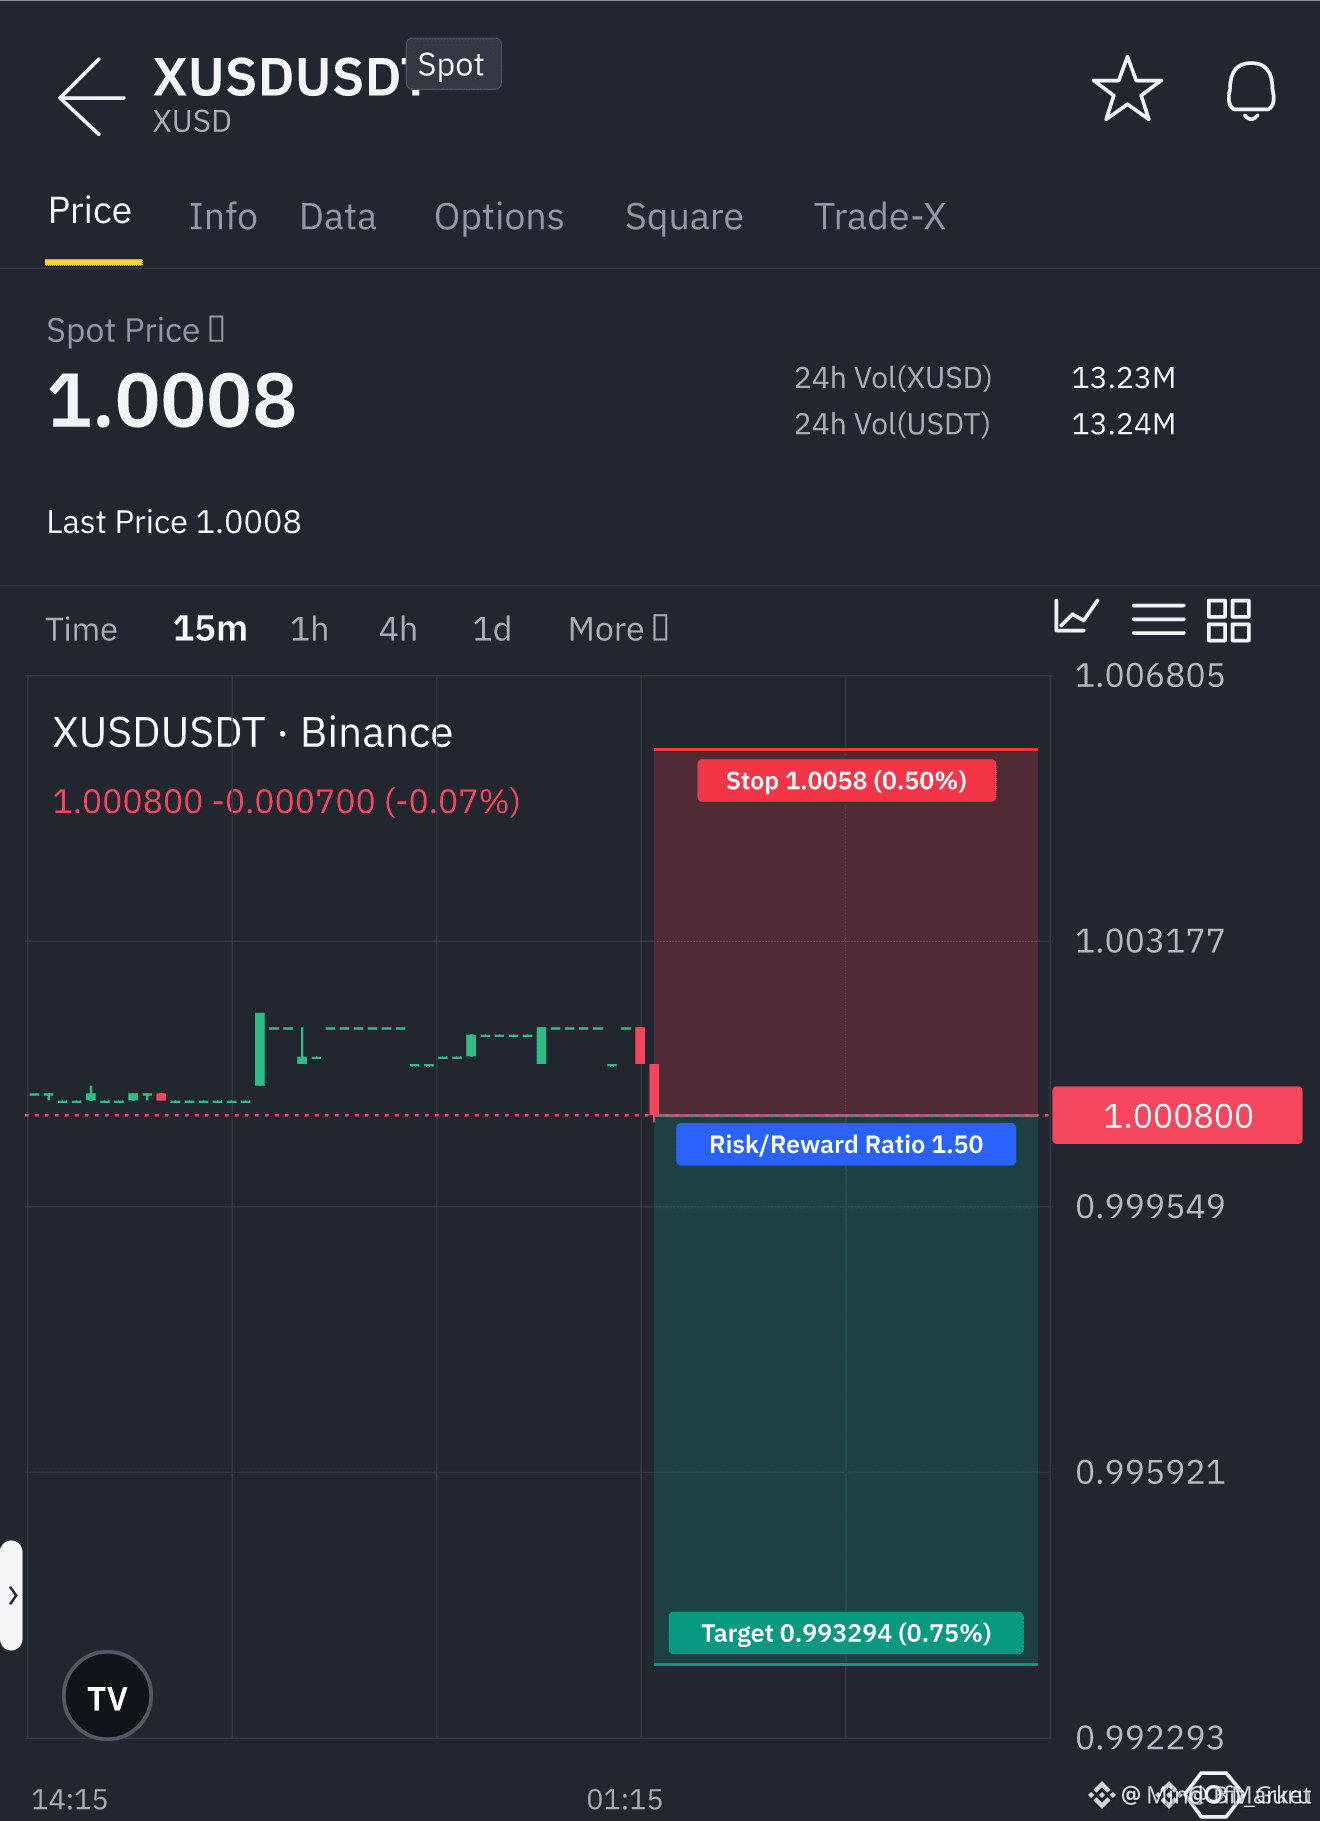
🚨 $XUSD BEARS BREAKING 20‑CANDLE RANGE WITH 4K× VOLUME! 📉
Entry: 1.0008 ⚡
Target: 0.99329 🚀
Stop Loss: 1.0058 ⚠️
📊 The 5‑minute candle slammed through the prior 20‑candle envelope, swallowing liquidity at the 1.0008 zone. 🌊 Volume exploded to 4,172× on‑chain, a classic smart‑money squeeze that forces sellers to capitulate. ⚡ The 15‑minute trend now aligns bearish, confirming the order block is now a supply pocket ripe for further depletion.
💡 With the market honoring the demand void, the next three downside legs sit neatly at 0.98829 and 0.98078, offering a layered risk‑reward profile. 🤔 Are you positioning for the initial dip or riding the deeper pull? 👇
⚠️ Not financial advice. Always manage your risk. 🛡️
🏷️ #XUSD #ShortSetup #LiquiditySweep #Crypto
🦈 🔥
1
·
--
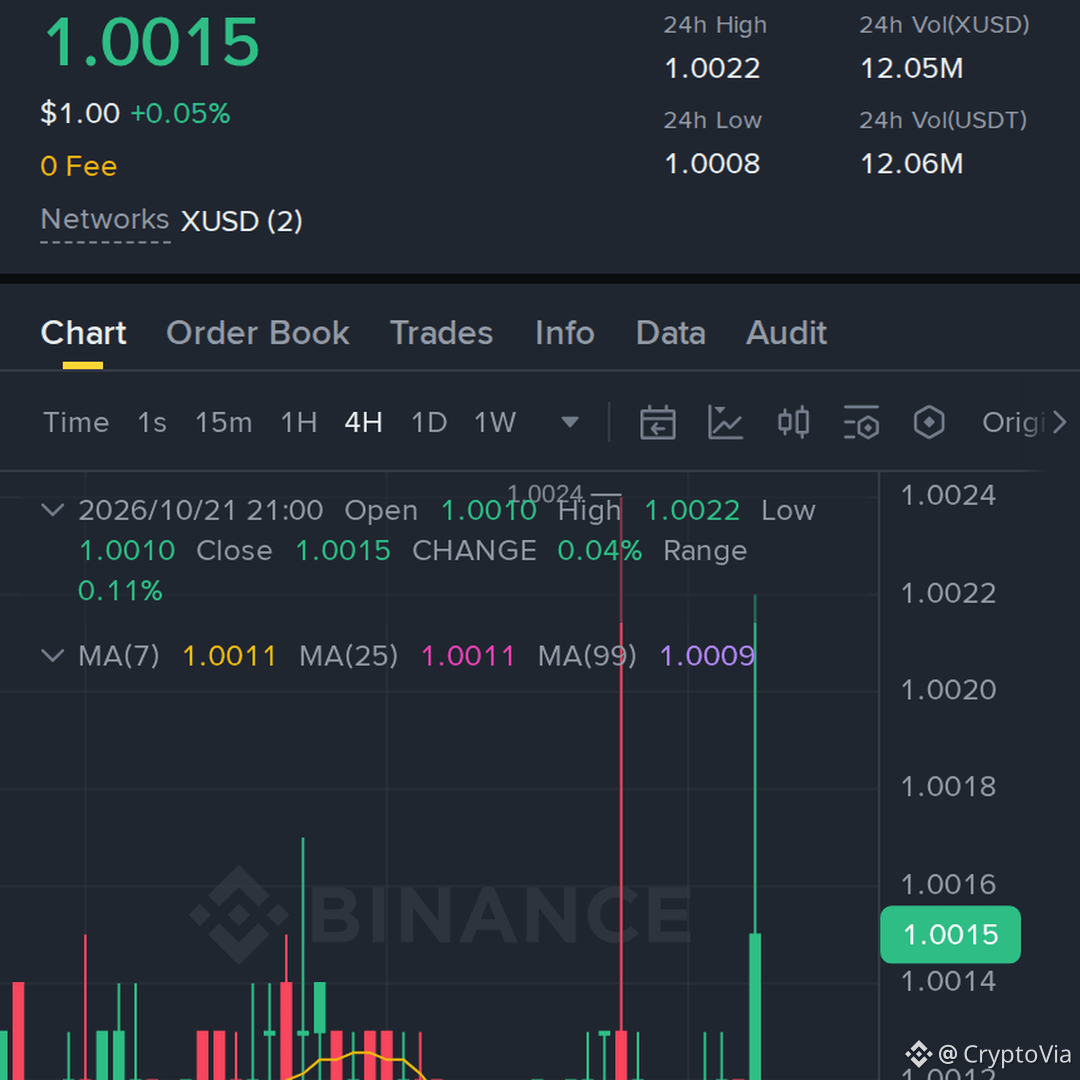
worth watching $XUSD, with the setup mapped around 32x, gave a controlled pullback and the trend is trying to continue
Entry: 1.0014–1.0015 • Stop Loss: 0.9854
TP1: 1.0246 | TP2: 1.0433 | TP3: 1.0653
#XUSD #Write2Earn #binance #Crypto
worth watching $XUSD , with the setup mapped around 32x, gave a controlled pullback and the trend is trying to continue
Entry: 1.0014–1.0015 • Stop Loss: 0.9854
TP1: 1.0246 | TP2: 1.0433 | TP3: 1.0653
#XUSD #Write2Earn #binance #Crypto
Entry: 1.0014–1.0015 • Stop Loss: 0.9854
TP1: 1.0246 | TP2: 1.0433 | TP3: 1.0653
#XUSD #Write2Earn #binance #Crypto
36
Log in to explore more content
Join global crypto users on Binance Square
⚡️ Get latest and useful information about crypto.
💬 Trusted by the world’s largest crypto exchange.
👍 Discover real insights from verified creators.
Email / Phone number
Trending Topics
1
#CanMicrosoftDeliverOnAI
484,411 views
3,407 Discussing
2
#CanGoogleDefindItsCore
297,364 views
2,407 Discussing
3
#EarningsSeason
6M views
29,541 Discussing
4
#$10.9BBitcoinOptionsExpireFriday
2,177 views
87 Discussing
5
#ThailandSupremeCourtRulesBitcoinIsProperty
12,037 views
328 Discussing
6
#BitcoinSurpasses$81K
37,715 views
127 Discussing
7
#RobinhoodFalls8.4%AfterItsResults
22,196 views
374 Discussing
8
#KOSPISurges6.63%BackAbove6000
21,351 views
360 Discussing
9
#DatavaultAICantWithdrawBitcoinFromBiconomy
25,561 views
339 Discussing
10
#FOMCWatch
9.4M views
29,821 Discussing