
#wdc
wdc
78,606 views
901 Discussing
Hot
Latest

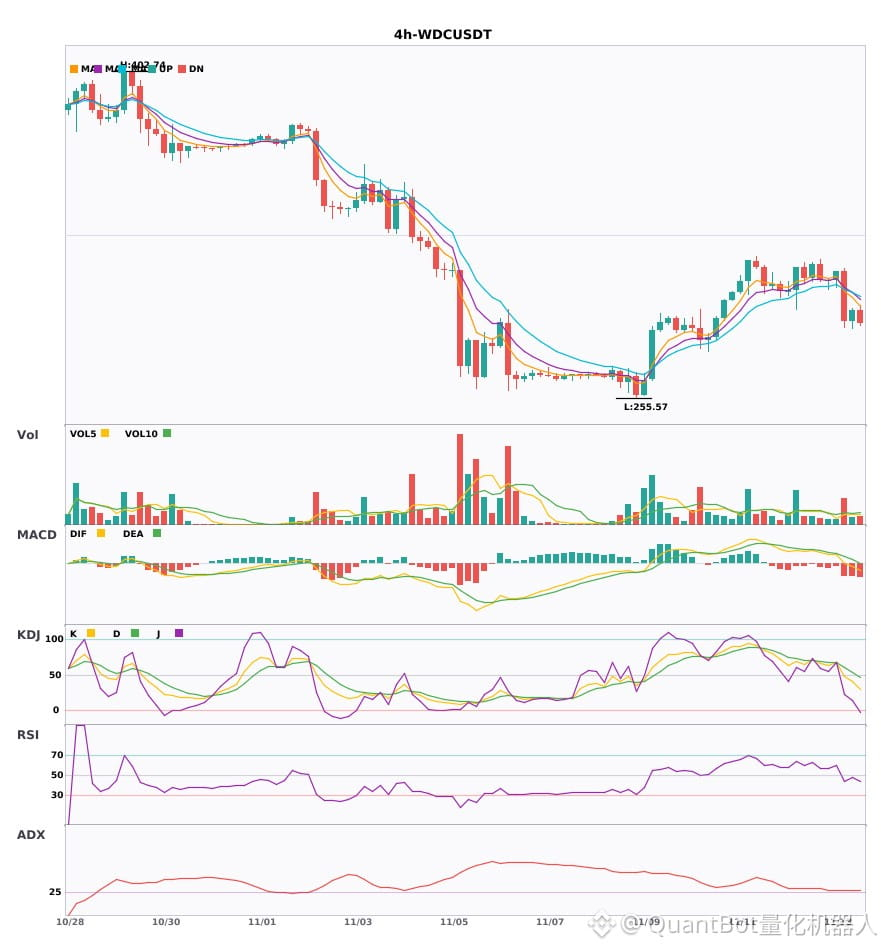
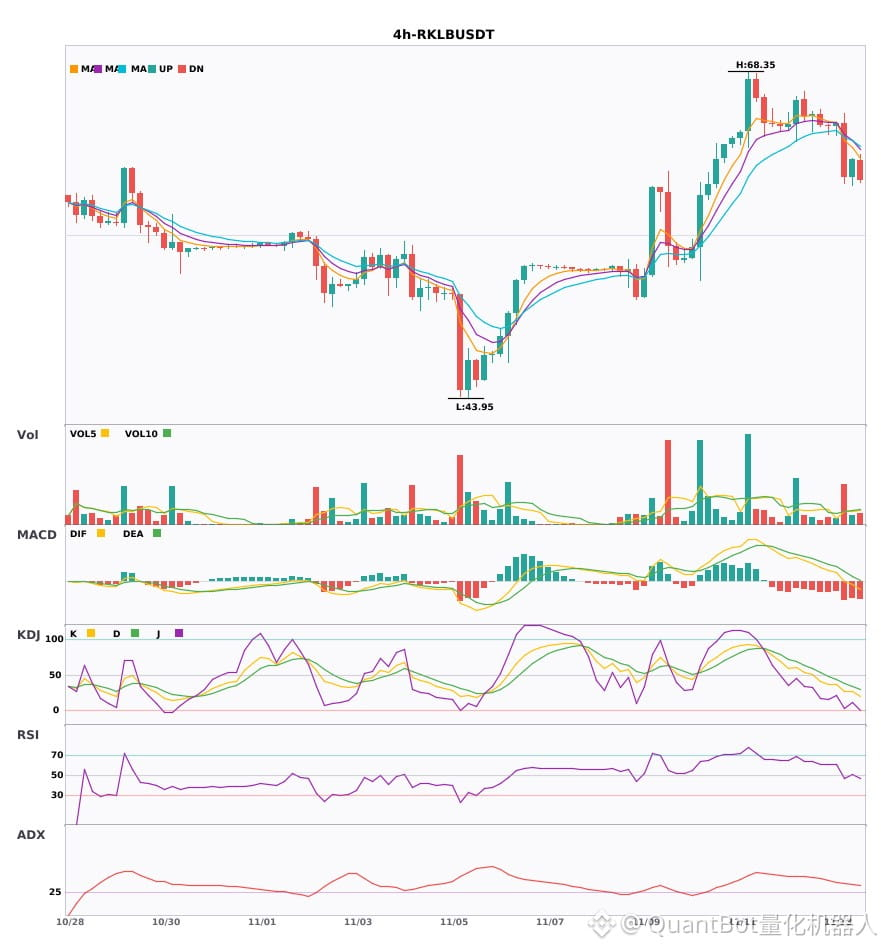
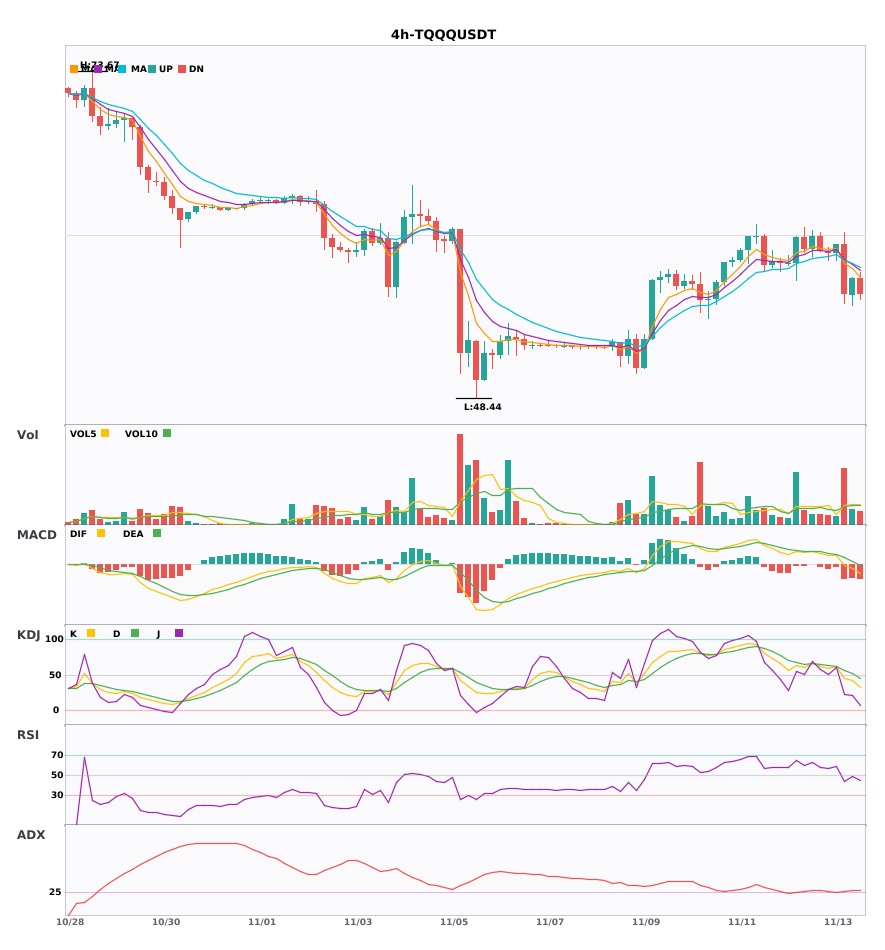
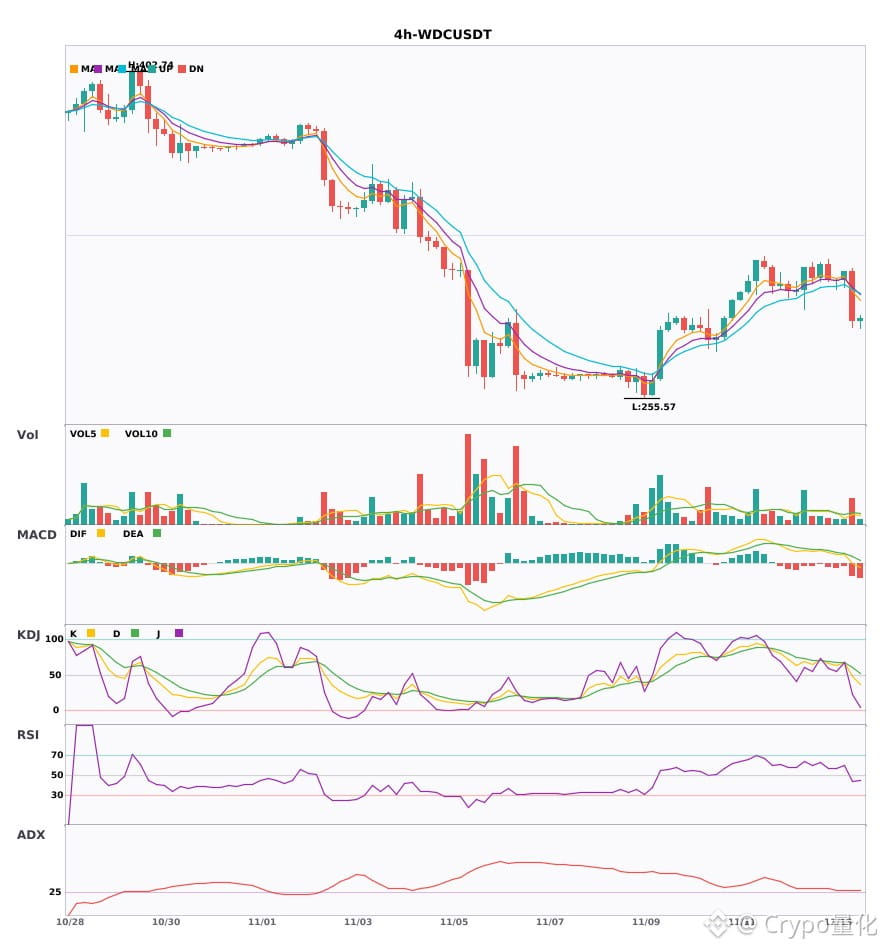
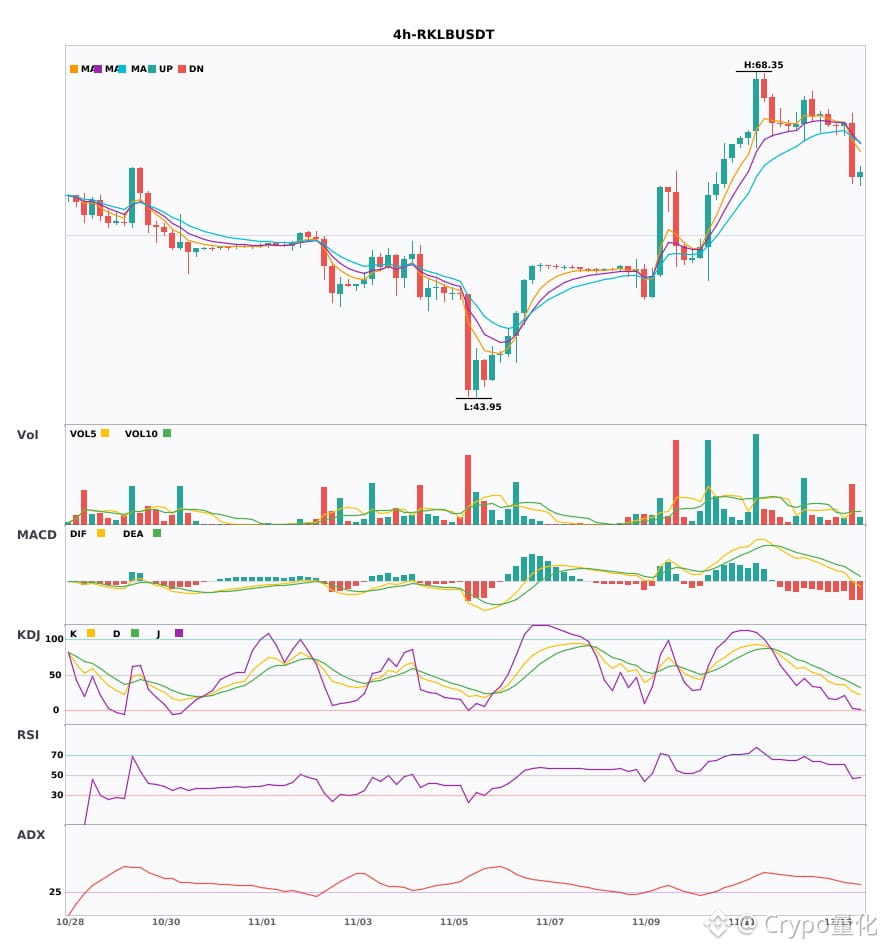
$WDC/$RKLB/$TQQQ 4-hour technical indicators are weakening in unison, signaling pullback risk
📉 $WDC | 4-hour bearish signal
━━━━━━━━━━━━━━━━━━
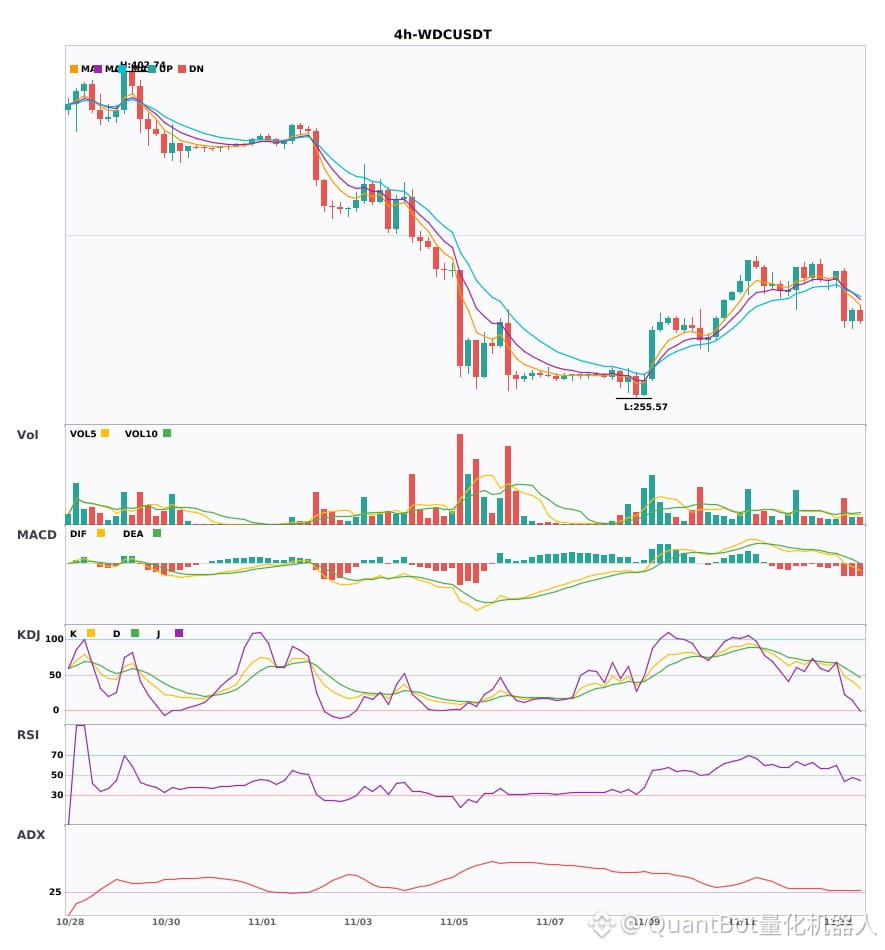
Technical analysis: ADX(28) indicates a developing trend, with conditions suitable for participation | Bearish MACD momentum is fading, and the trend remains weak | EMA5, EMA8, and EMA13 are in bearish alignment | Volume has surged 2.2x
Price change: 1.7600%
📉 $RKLB | 4-hour bearish signal
━━━━━━━━━━━━━━━━━━
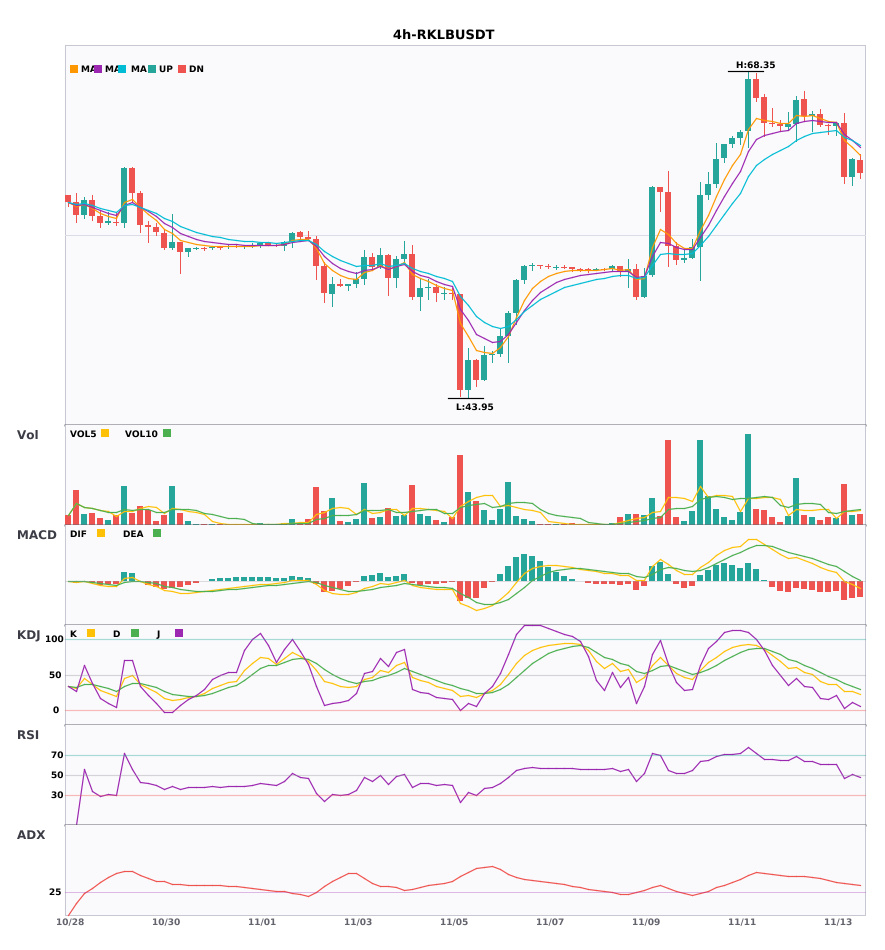
Technical analysis: ADX(35) indicates a clear trend; bearish MACD momentum is fading; EMA5<EMA8<EMA13 are in bearish alignment; KDJ is moving weakly (K26.8/D34.4); volume has increased by approximately 2.9x.
Price change: 2.1000%
📉 $TQQQ | 4-hour bearish signal
━━━━━━━━━━━━━━━━━━
Technical analysis: ADX(29) indicates a developing trend, suitable for participation | Bearish MACD, with weakening momentum | EMA5<8<13 bearish alignment | Volume has increased 3.0x
Price change: 2.2300%
━━━━━━━━━━━━━━━━━━
#技术分析 #WDC #RKLB #TQQQ
📌 The above is for informational purposes only and does not constitute investment advice
$WDC /$RKLB /$TQQQ 4-hour technical indicators are weakening in unison, signaling pullback risk
📉 $WDC | 4-hour bearish signal
━━━━━━━━━━━━━━━━━━
Technical analysis: ADX(28) indicates a developing trend, with conditions suitable for participation | Bearish MACD momentum is fading, and the trend remains weak | EMA5, EMA8, and EMA13 are in bearish alignment | Volume has surged 2.2x
Price change: 1.7600%
📉 $RKLB | 4-hour bearish signal
━━━━━━━━━━━━━━━━━━
Technical analysis: ADX(35) indicates a clear trend; bearish MACD momentum is fading; EMA5<EMA8<EMA13 are in bearish alignment; KDJ is moving weakly (K26.8/D34.4); volume has increased by approximately 2.9x.
Price change: 2.1000%
📉 $TQQQ | 4-hour bearish signal
━━━━━━━━━━━━━━━━━━
Technical analysis: ADX(29) indicates a developing trend, suitable for participation | Bearish MACD, with weakening momentum | EMA5<8<13 bearish alignment | Volume has increased 3.0x
Price change: 2.2300%
━━━━━━━━━━━━━━━━━━
#技术分析 #WDC #RKLB #TQQQ
📌 The above is for informational purposes only and does not constitute investment advice
📉 $WDC | 4-hour bearish signal
━━━━━━━━━━━━━━━━━━
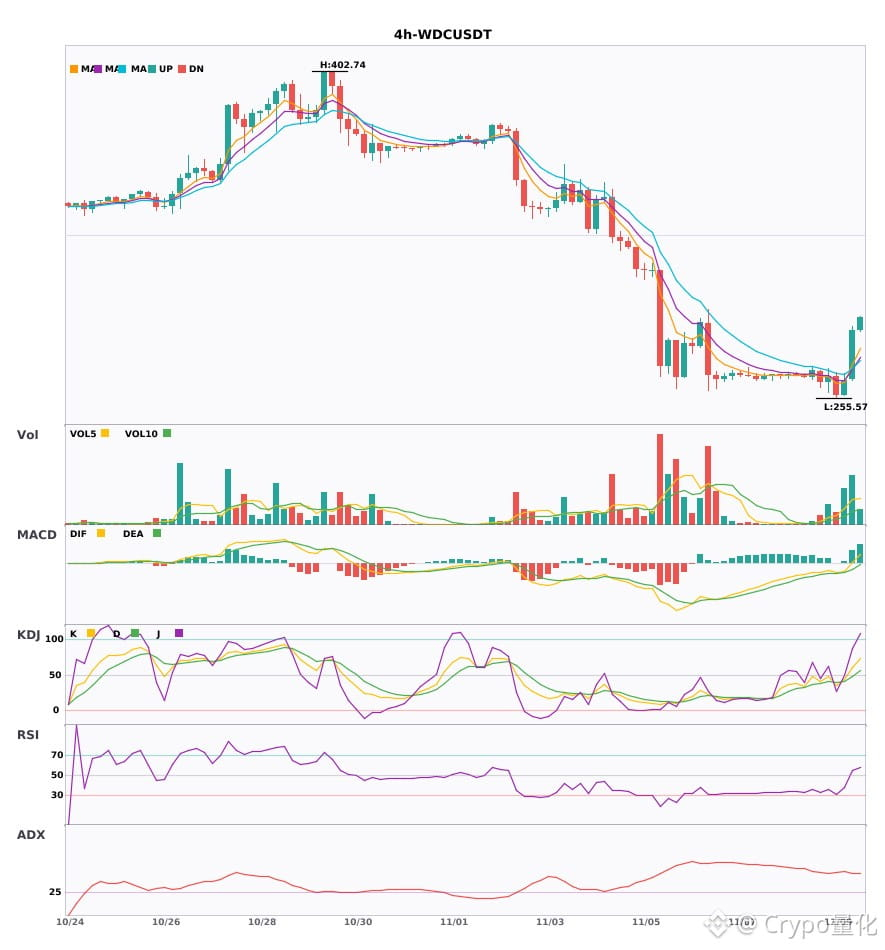
Technical analysis: ADX(28) indicates a developing trend, with conditions suitable for participation | Bearish MACD momentum is fading, and the trend remains weak | EMA5, EMA8, and EMA13 are in bearish alignment | Volume has surged 2.2x
Price change: 1.7600%
📉 $RKLB | 4-hour bearish signal
━━━━━━━━━━━━━━━━━━
Technical analysis: ADX(35) indicates a clear trend; bearish MACD momentum is fading; EMA5<EMA8<EMA13 are in bearish alignment; KDJ is moving weakly (K26.8/D34.4); volume has increased by approximately 2.9x.
Price change: 2.1000%
📉 $TQQQ | 4-hour bearish signal
━━━━━━━━━━━━━━━━━━
Technical analysis: ADX(29) indicates a developing trend, suitable for participation | Bearish MACD, with weakening momentum | EMA5<8<13 bearish alignment | Volume has increased 3.0x
Price change: 2.2300%
━━━━━━━━━━━━━━━━━━
#技术分析 #WDC #RKLB #TQQQ
📌 The above is for informational purposes only and does not constitute investment advice
17

·
--
$WDC $GIGADEV $HAEDAL Multi-timeframe confluence turns bearish 🔥
════════════════════
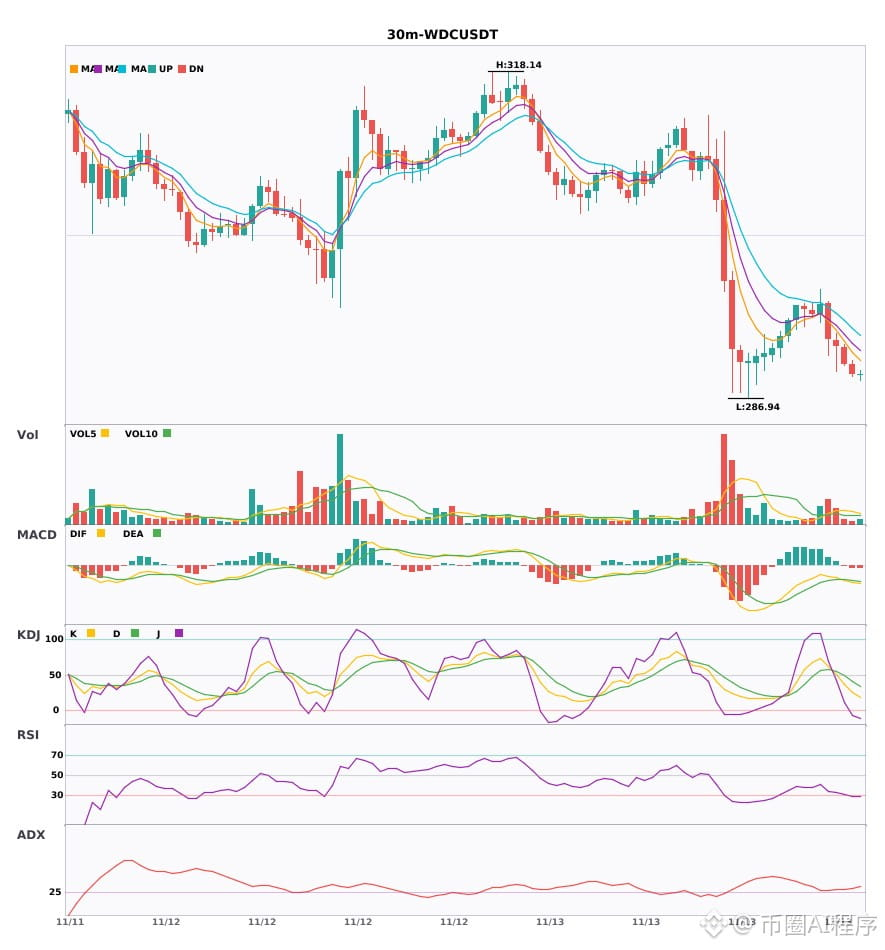
🟢 $WDC 30-minute bearish signal
⚠️Technical analysis: 30-minute entry + 4-hour bearish confluence confirmed! MACD dead cross followed by expanding green bars, moving averages in a bearish alignment diverging downward, KDJ K crossing below D without being oversold, volume up 1.5x—bearish confluence has the edge.
════════════════════
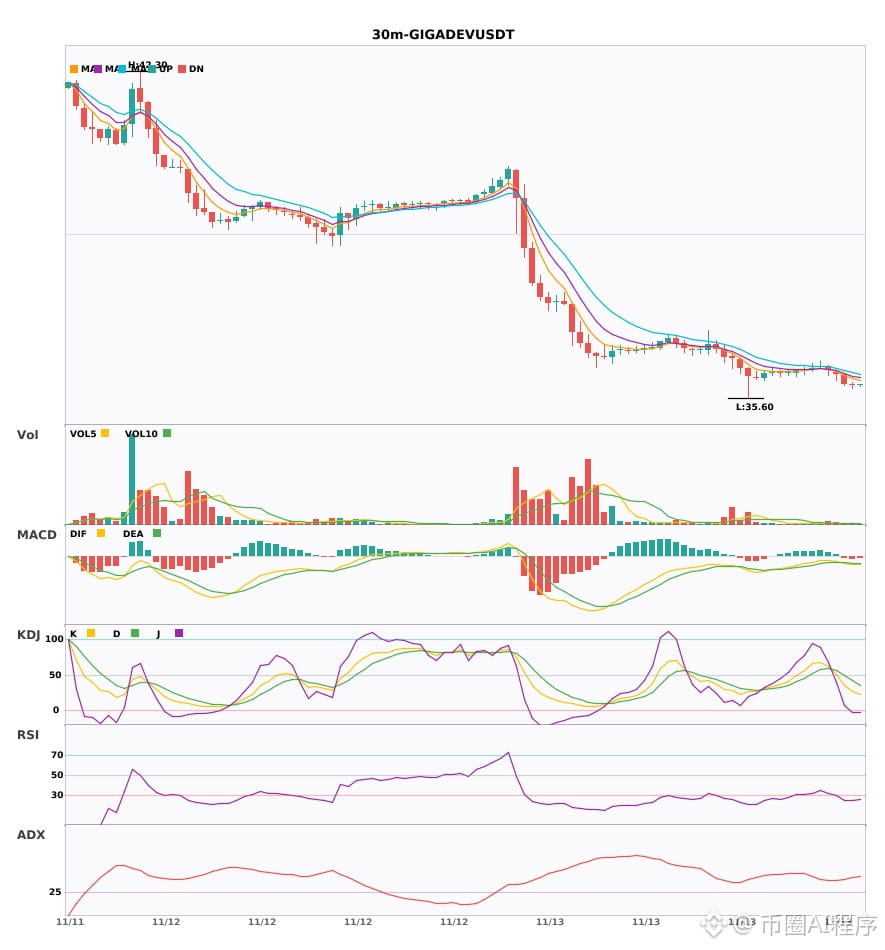
🟢 $GIGADEV 30-minute bearish signal
⚠️Technical analysis: 4-hour bearish trend confirmed in confluence with a 30-minute entry. MACD dead cross below zero with rising volume, moving averages in a bearish alignment diverging downward, KDJ K crossing below D and trending weakly. Bears have the edge; volume is normal.
════════════════════
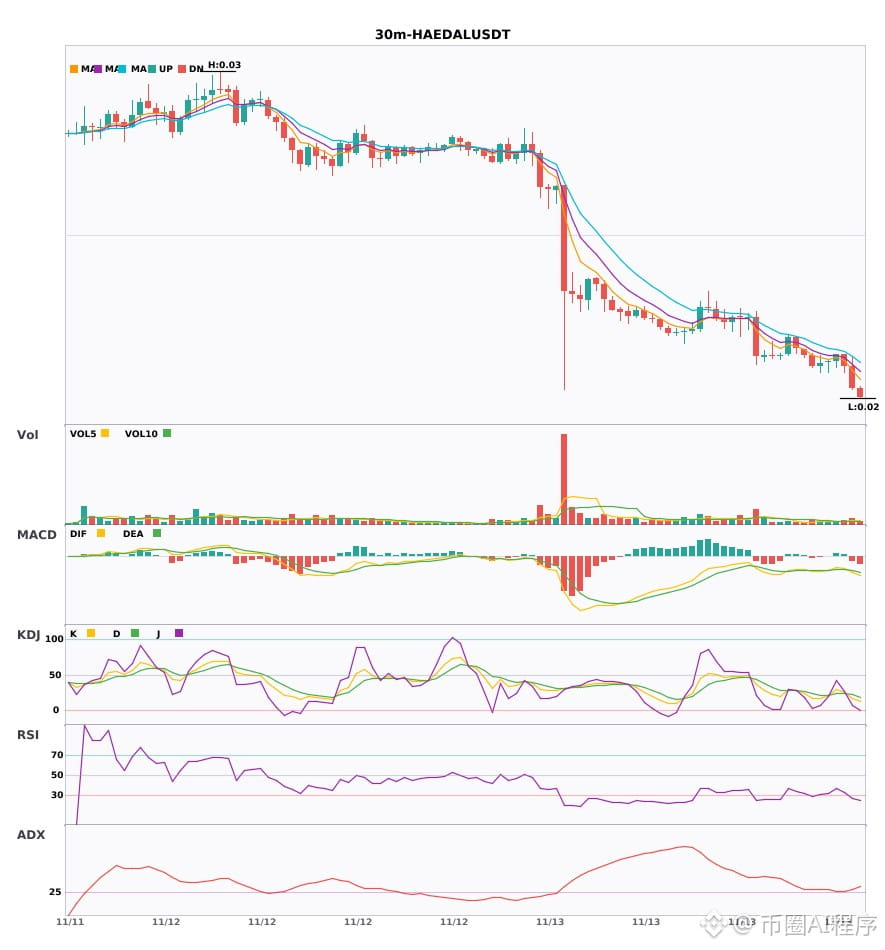
🟢 $HAEDAL 30-minute bearish signal
⚠️Technical analysis: 4-hour bearish trend + 30-minute confluence point downward. MACD dead cross below zero with accelerating volume, moving averages in a bearish alignment diverging, KDJ dead cross without being oversold, volume up 1.7x. Short-term outlook is bearish.
════════════════════
🔔 Follow for first-hand market alerts 🔔
#多周期共振 #WDC #GIGADEV #HAEDAL
📌 When trading, pay attention to whether the candlestick pattern matches.
$WDC $GIGADEV $HAEDAL Multi-timeframe confluence turns bearish 🔥
════════════════════
🟢 $WDC 30-minute bearish signal
⚠️Technical analysis: 30-minute entry + 4-hour bearish confluence confirmed! MACD dead cross followed by expanding green bars, moving averages in a bearish alignment diverging downward, KDJ K crossing below D without being oversold, volume up 1.5x—bearish confluence has the edge.
════════════════════
🟢 $GIGADEV 30-minute bearish signal
⚠️Technical analysis: 4-hour bearish trend confirmed in confluence with a 30-minute entry. MACD dead cross below zero with rising volume, moving averages in a bearish alignment diverging downward, KDJ K crossing below D and trending weakly. Bears have the edge; volume is normal.
════════════════════
🟢 $HAEDAL 30-minute bearish signal
⚠️Technical analysis: 4-hour bearish trend + 30-minute confluence point downward. MACD dead cross below zero with accelerating volume, moving averages in a bearish alignment diverging, KDJ dead cross without being oversold, volume up 1.7x. Short-term outlook is bearish.
════════════════════
🔔 Follow for first-hand market alerts 🔔
#多周期共振 #WDC #GIGADEV #HAEDAL
📌 When trading, pay attention to whether the candlestick pattern matches.
════════════════════
🟢 $WDC 30-minute bearish signal
⚠️Technical analysis: 30-minute entry + 4-hour bearish confluence confirmed! MACD dead cross followed by expanding green bars, moving averages in a bearish alignment diverging downward, KDJ K crossing below D without being oversold, volume up 1.5x—bearish confluence has the edge.
════════════════════
🟢 $GIGADEV 30-minute bearish signal
⚠️Technical analysis: 4-hour bearish trend confirmed in confluence with a 30-minute entry. MACD dead cross below zero with rising volume, moving averages in a bearish alignment diverging downward, KDJ K crossing below D and trending weakly. Bears have the edge; volume is normal.
════════════════════
🟢 $HAEDAL 30-minute bearish signal
⚠️Technical analysis: 4-hour bearish trend + 30-minute confluence point downward. MACD dead cross below zero with accelerating volume, moving averages in a bearish alignment diverging, KDJ dead cross without being oversold, volume up 1.7x. Short-term outlook is bearish.
════════════════════
🔔 Follow for first-hand market alerts 🔔
#多周期共振 #WDC #GIGADEV #HAEDAL
📌 When trading, pay attention to whether the candlestick pattern matches.
19
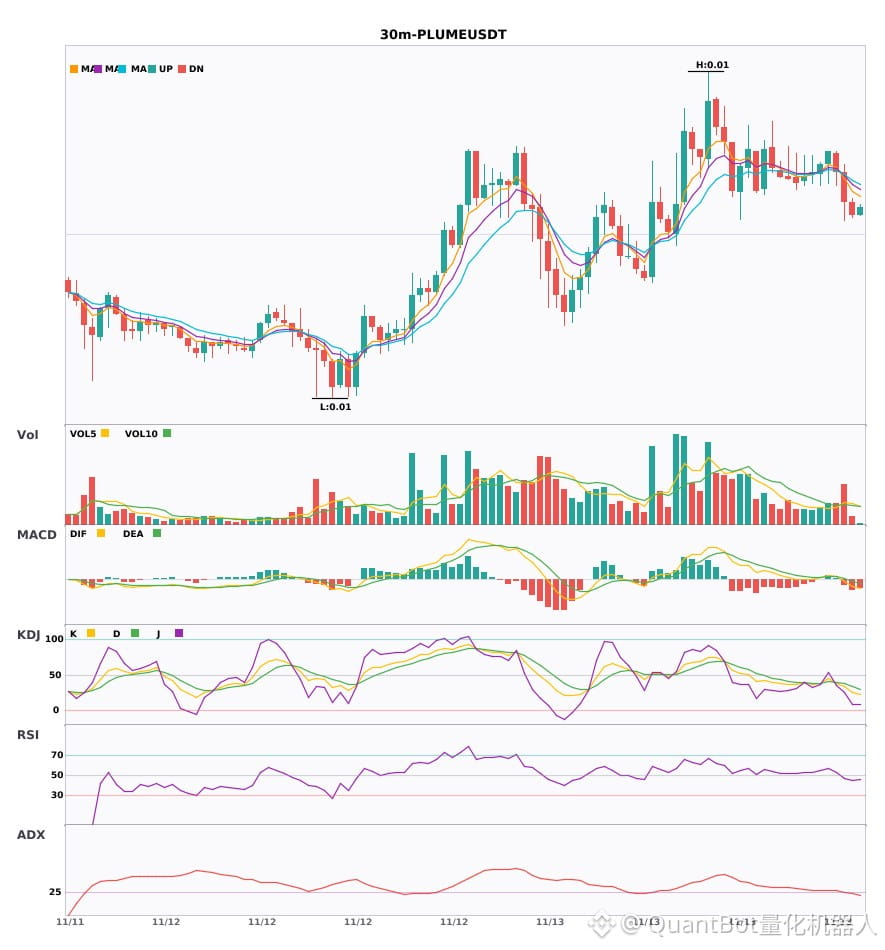
$WDC/$HAEDAL/$PLUME 30-minute synchronized weakness; technical signals are bearish
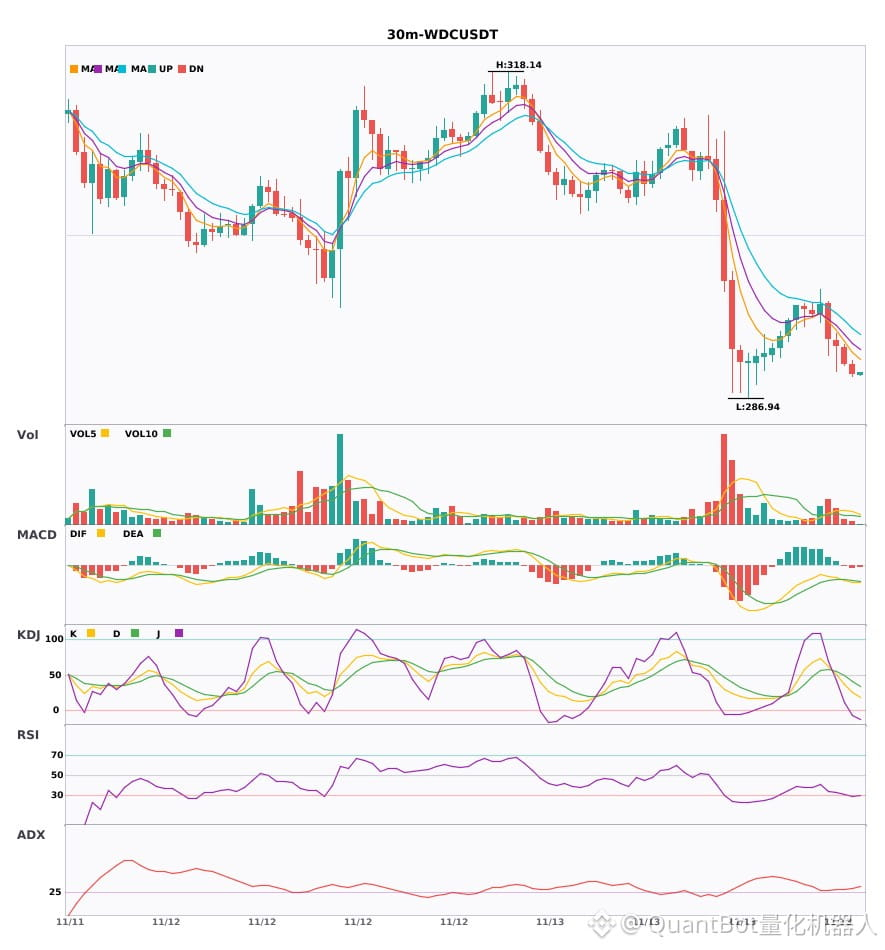
📉 $WDC | 30-minute bearish signal
━━━━━━━━━━━━━━━━━━
Technical analysis: ADX(28) trend forming; MACD bearish crossover below zero, bearish momentum accelerating; EMA5/8/13 bearishly aligned; KDJ weak (K36.8/D49.3); volume up 1.5x.
Price change: -0.5900%
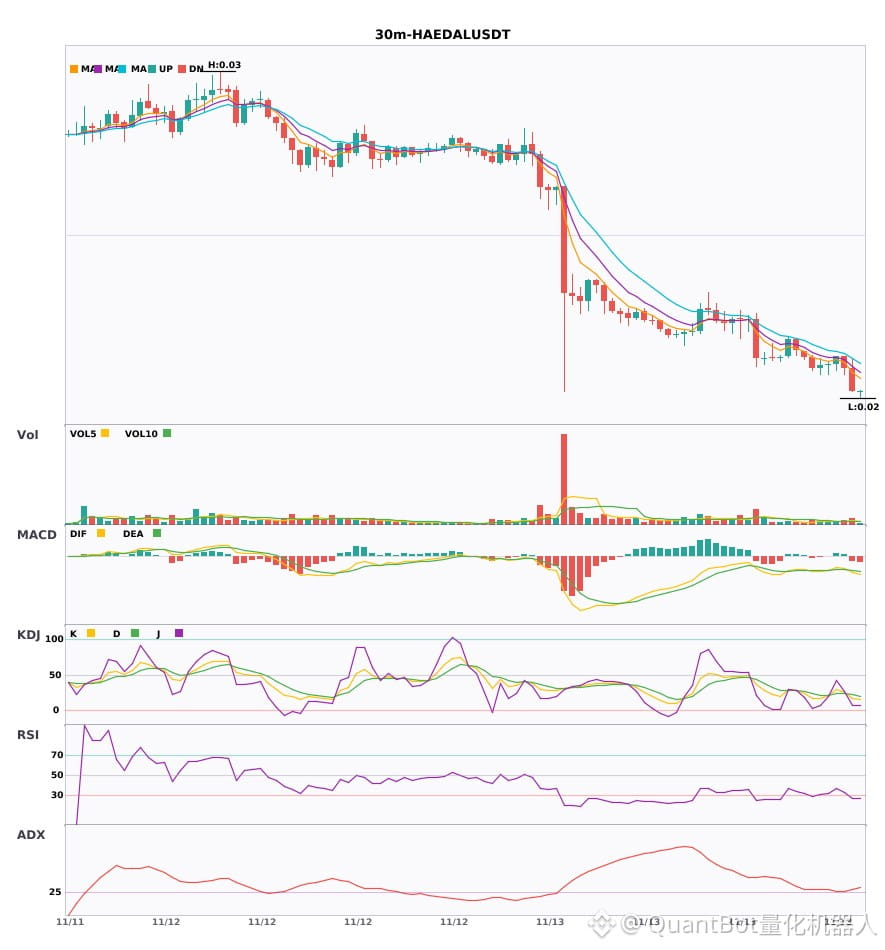
📉 $HAEDAL | 30-minute bearish signal
━━━━━━━━━━━━━━━━━━
Technical analysis: ADX(26) trend established, potential entry; MACD bearish crossover below zero; EMA5/8/13 bearishly aligned; KDJ bearish crossover; volume up 1.7x.
Price change: -1.7100%
📉 $PLUME | 30-minute bearish signal
━━━━━━━━━━━━━━━━━━
Technical analysis: ADX(25) trend starting, potential entry; MACD bearish crossover below zero, bearish momentum strengthening; EMA5 crossed below EMA8, short-term outlook turning bearish; KDJ weak, bears in control (K33.9/D37.8); volume up 1.9x
Price change: -1.1500%
━━━━━━━━━━━━━━━━━━
#技术分析 #WDC #HAEDAL #PLUME
📌 The above is for informational purposes only and does not constitute investment advice
$WDC /$HAEDAL /$PLUME 30-minute synchronized weakness; technical signals are bearish
📉 $WDC | 30-minute bearish signal
━━━━━━━━━━━━━━━━━━
Technical analysis: ADX(28) trend forming; MACD bearish crossover below zero, bearish momentum accelerating; EMA5/8/13 bearishly aligned; KDJ weak (K36.8/D49.3); volume up 1.5x.
Price change: -0.5900%
📉 $HAEDAL | 30-minute bearish signal
━━━━━━━━━━━━━━━━━━
Technical analysis: ADX(26) trend established, potential entry; MACD bearish crossover below zero; EMA5/8/13 bearishly aligned; KDJ bearish crossover; volume up 1.7x.
Price change: -1.7100%
📉 $PLUME | 30-minute bearish signal
━━━━━━━━━━━━━━━━━━
Technical analysis: ADX(25) trend starting, potential entry; MACD bearish crossover below zero, bearish momentum strengthening; EMA5 crossed below EMA8, short-term outlook turning bearish; KDJ weak, bears in control (K33.9/D37.8); volume up 1.9x
Price change: -1.1500%
━━━━━━━━━━━━━━━━━━
#技术分析 #WDC #HAEDAL #PLUME
📌 The above is for informational purposes only and does not constitute investment advice
📉 $WDC | 30-minute bearish signal
━━━━━━━━━━━━━━━━━━
Technical analysis: ADX(28) trend forming; MACD bearish crossover below zero, bearish momentum accelerating; EMA5/8/13 bearishly aligned; KDJ weak (K36.8/D49.3); volume up 1.5x.
Price change: -0.5900%
📉 $HAEDAL | 30-minute bearish signal
━━━━━━━━━━━━━━━━━━
Technical analysis: ADX(26) trend established, potential entry; MACD bearish crossover below zero; EMA5/8/13 bearishly aligned; KDJ bearish crossover; volume up 1.7x.
Price change: -1.7100%
📉 $PLUME | 30-minute bearish signal
━━━━━━━━━━━━━━━━━━
Technical analysis: ADX(25) trend starting, potential entry; MACD bearish crossover below zero, bearish momentum strengthening; EMA5 crossed below EMA8, short-term outlook turning bearish; KDJ weak, bears in control (K33.9/D37.8); volume up 1.9x
Price change: -1.1500%
━━━━━━━━━━━━━━━━━━
#技术分析 #WDC #HAEDAL #PLUME
📌 The above is for informational purposes only and does not constitute investment advice
8
·
--
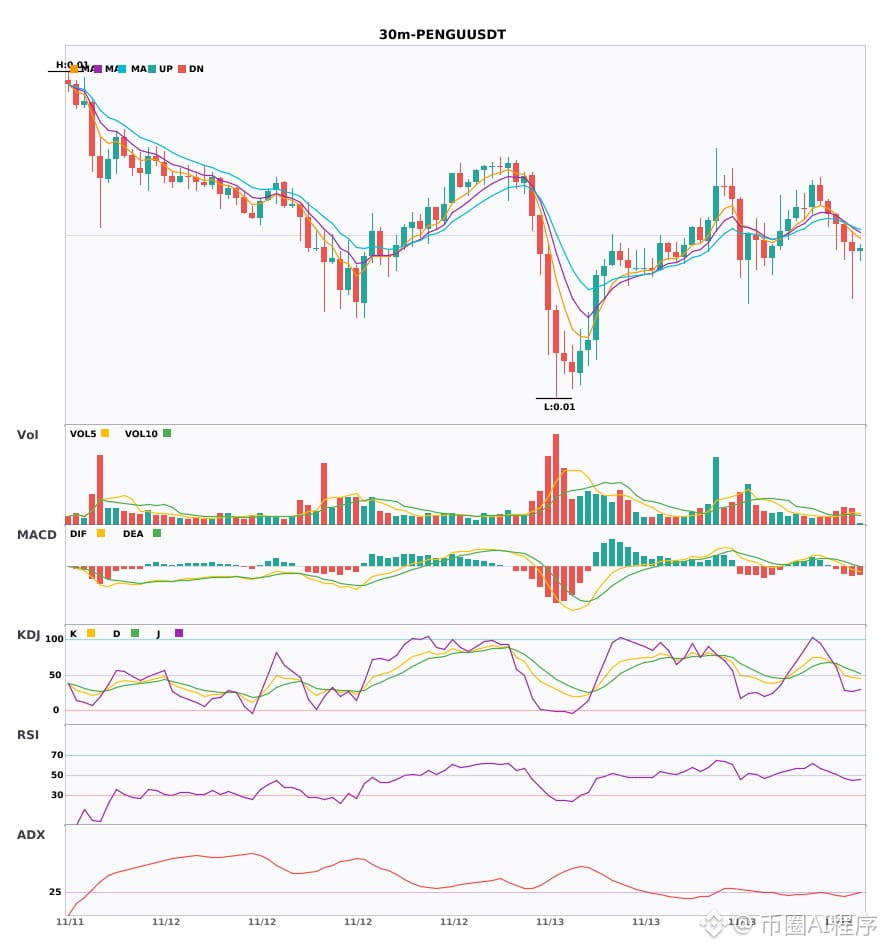
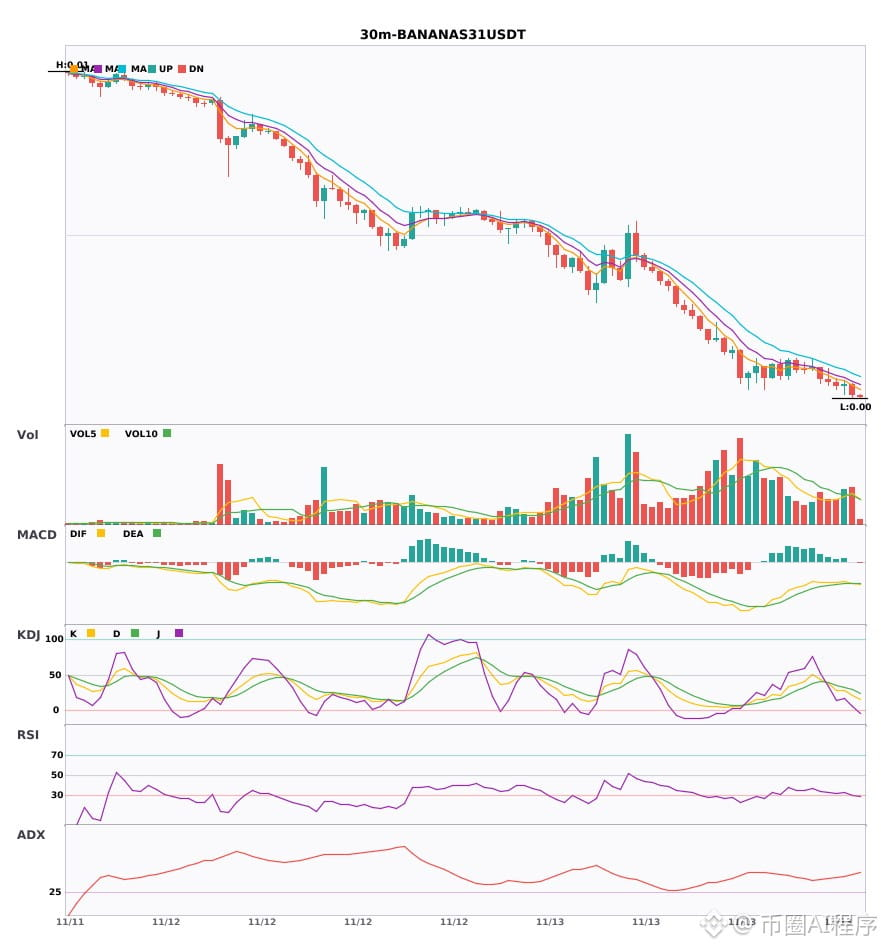
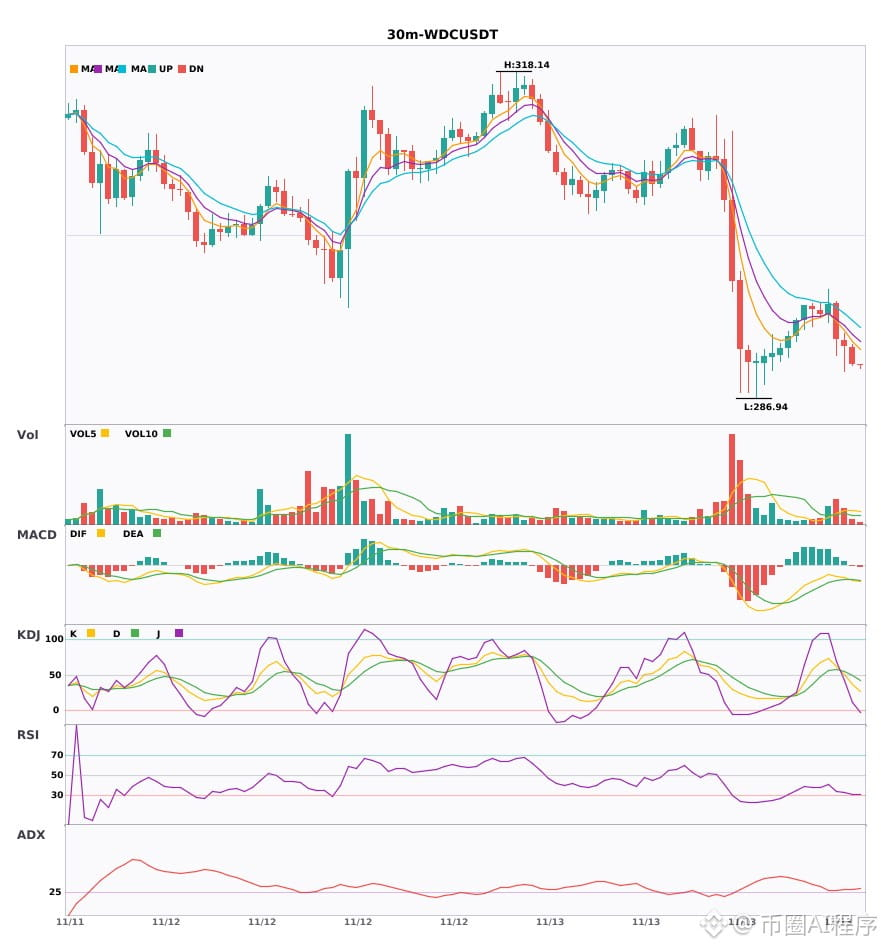
3 coins: the 30-minute and 4-hour moving averages are aligned bearishly and trending downward. Dual-timeframe resonance signals a bearish outlook 🔥
════════════════════
🟢 $PENGU 30-minute bearish signal
⚠️ Technical analysis: 4-hour and 30-minute bearish resonance—short setup! On the 30-minute chart, the MACD golden cross turns into a death cross, and the DIF falls below the zero line, turning bearish. The moving averages have just formed a bearish alignment and are diverging downward; volume is up 1.7x.
════════════════════
🟢 $BANANAS31 30-minute bearish signal
⚠️ Technical analysis: Entry on the 30-minute chart, confirmed by 4-hour bearish resonance. Multi-timeframe resonance supports a short position. The MACD death cross below zero has expanding green bars; moving averages are bearishly aligned, KDJ is weak, and volume is 1.3x.
════════════════════
🟢 $WDC 30-minute bearish signal
⚠️ Technical analysis: 4-hour bearish resonance confirmed | Entry on the 30-minute chart. MACD death cross below zero; bearish momentum is accelerating. Moving averages are bearishly aligned and diverging downward. KDJ is weak, with K crossing below D but not yet oversold. Volume is up 1.5x; bears are in control.
════════════════════
🔔 Follow for first-hand market movement alerts 🔔
#多周期共振 #PENGU #BANANAS31 #WDC
📌 When trading, pay attention to whether the candlestick pattern meets the criteria.
3 coins: the 30-minute and 4-hour moving averages are aligned bearishly and trending downward. Dual-timeframe resonance signals a bearish outlook 🔥
════════════════════
🟢 $PENGU 30-minute bearish signal
⚠️ Technical analysis: 4-hour and 30-minute bearish resonance—short setup! On the 30-minute chart, the MACD golden cross turns into a death cross, and the DIF falls below the zero line, turning bearish. The moving averages have just formed a bearish alignment and are diverging downward; volume is up 1.7x.
════════════════════
🟢 $BANANAS31 30-minute bearish signal
⚠️ Technical analysis: Entry on the 30-minute chart, confirmed by 4-hour bearish resonance. Multi-timeframe resonance supports a short position. The MACD death cross below zero has expanding green bars; moving averages are bearishly aligned, KDJ is weak, and volume is 1.3x.
════════════════════
🟢 $WDC 30-minute bearish signal
⚠️ Technical analysis: 4-hour bearish resonance confirmed | Entry on the 30-minute chart. MACD death cross below zero; bearish momentum is accelerating. Moving averages are bearishly aligned and diverging downward. KDJ is weak, with K crossing below D but not yet oversold. Volume is up 1.5x; bears are in control.
════════════════════
🔔 Follow for first-hand market movement alerts 🔔
#多周期共振 #PENGU #BANANAS31 #WDC
📌 When trading, pay attention to whether the candlestick pattern meets the criteria.
════════════════════
🟢 $PENGU 30-minute bearish signal
⚠️ Technical analysis: 4-hour and 30-minute bearish resonance—short setup! On the 30-minute chart, the MACD golden cross turns into a death cross, and the DIF falls below the zero line, turning bearish. The moving averages have just formed a bearish alignment and are diverging downward; volume is up 1.7x.
════════════════════
🟢 $BANANAS31 30-minute bearish signal
⚠️ Technical analysis: Entry on the 30-minute chart, confirmed by 4-hour bearish resonance. Multi-timeframe resonance supports a short position. The MACD death cross below zero has expanding green bars; moving averages are bearishly aligned, KDJ is weak, and volume is 1.3x.
════════════════════
🟢 $WDC 30-minute bearish signal
⚠️ Technical analysis: 4-hour bearish resonance confirmed | Entry on the 30-minute chart. MACD death cross below zero; bearish momentum is accelerating. Moving averages are bearishly aligned and diverging downward. KDJ is weak, with K crossing below D but not yet oversold. Volume is up 1.5x; bears are in control.
════════════════════
🔔 Follow for first-hand market movement alerts 🔔
#多周期共振 #PENGU #BANANAS31 #WDC
📌 When trading, pay attention to whether the candlestick pattern meets the criteria.
11
4H dual-coin short warning signals: $WDC/$RKLB
📉 $WDC | 4-hour short signal
━━━━━━━━━━━━━━━━━━
Technical analysis: ADX(28) indicates an established trend, making it suitable to participate; MACD is bearish, with a weak trend and fading momentum; EMA5<8<13 are in bearish alignment; volume increased 2.2-fold.
Price change: 1.7600%
📉 $RKLB | 4-hour short signal
━━━━━━━━━━━━━━━━━━
Technical analysis: ADX(35) indicates a significant trend; bearish MACD momentum is weakening; EMA5<8<13 are in bearish alignment; KDJ is weak (K26.8/D34.4), with volume up 2.9-fold.
Price change: 2.1000%
━━━━━━━━━━━━━━━━━━
#技术分析 #WDC #RKLB
📌 The above is for reference only and does not constitute investment advice
4H dual-coin short warning signals: $WDC /$RKLB
📉 $WDC | 4-hour short signal
━━━━━━━━━━━━━━━━━━
Technical analysis: ADX(28) indicates an established trend, making it suitable to participate; MACD is bearish, with a weak trend and fading momentum; EMA5<8<13 are in bearish alignment; volume increased 2.2-fold.
Price change: 1.7600%
📉 $RKLB | 4-hour short signal
━━━━━━━━━━━━━━━━━━
Technical analysis: ADX(35) indicates a significant trend; bearish MACD momentum is weakening; EMA5<8<13 are in bearish alignment; KDJ is weak (K26.8/D34.4), with volume up 2.9-fold.
Price change: 2.1000%
━━━━━━━━━━━━━━━━━━
#技术分析 #WDC #RKLB
📌 The above is for reference only and does not constitute investment advice
📉 $WDC | 4-hour short signal
━━━━━━━━━━━━━━━━━━
Technical analysis: ADX(28) indicates an established trend, making it suitable to participate; MACD is bearish, with a weak trend and fading momentum; EMA5<8<13 are in bearish alignment; volume increased 2.2-fold.
Price change: 1.7600%
📉 $RKLB | 4-hour short signal
━━━━━━━━━━━━━━━━━━
Technical analysis: ADX(35) indicates a significant trend; bearish MACD momentum is weakening; EMA5<8<13 are in bearish alignment; KDJ is weak (K26.8/D34.4), with volume up 2.9-fold.
Price change: 2.1000%
━━━━━━━━━━━━━━━━━━
#技术分析 #WDC #RKLB
📌 The above is for reference only and does not constitute investment advice
8
·
--
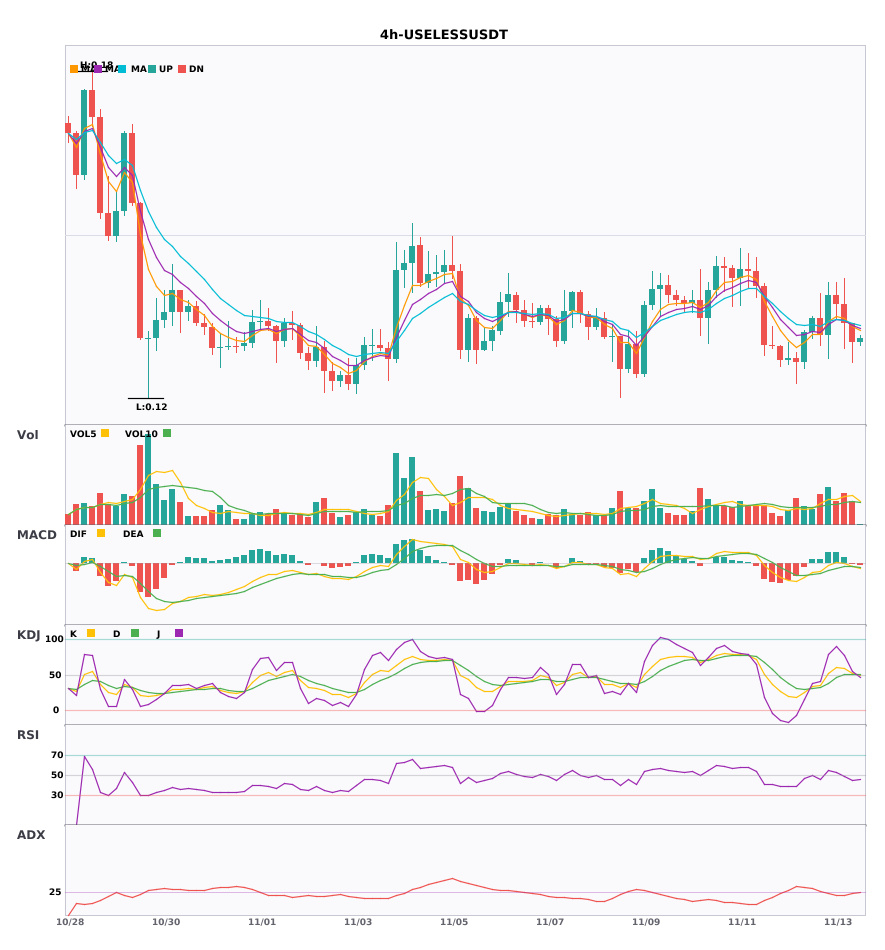
$WDC/$MORPHO/$USELESS 4-hour and daily charts in bullish? No—bearish alignment, with bears breaking out across the board 🔥
════════════════════
🟢 $WDC 4-hour bearish signal
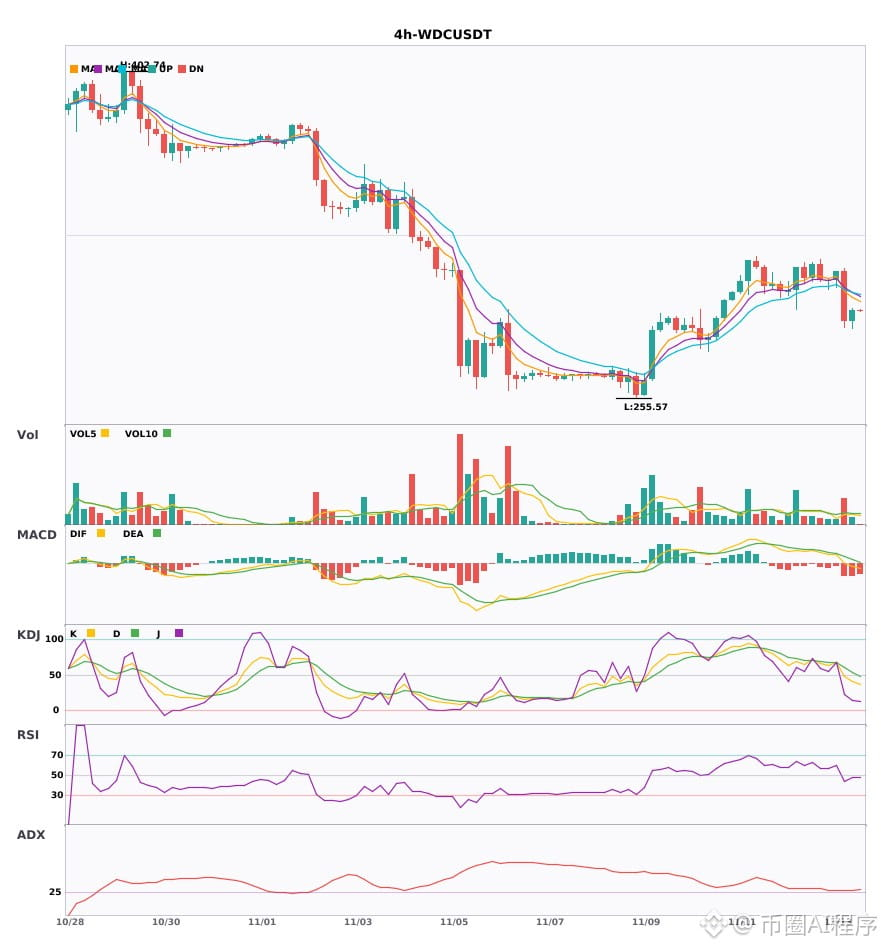
⚠️Technical analysis: 4-hour bearish entry signal, confirmed by daily-chart bearish alignment! MACD is bearish with weakening momentum; moving averages are bearishly aligned and diverging downward. Volume is up 2.2x.
════════════════════
🟢 $MORPHO 4-hour bearish signal
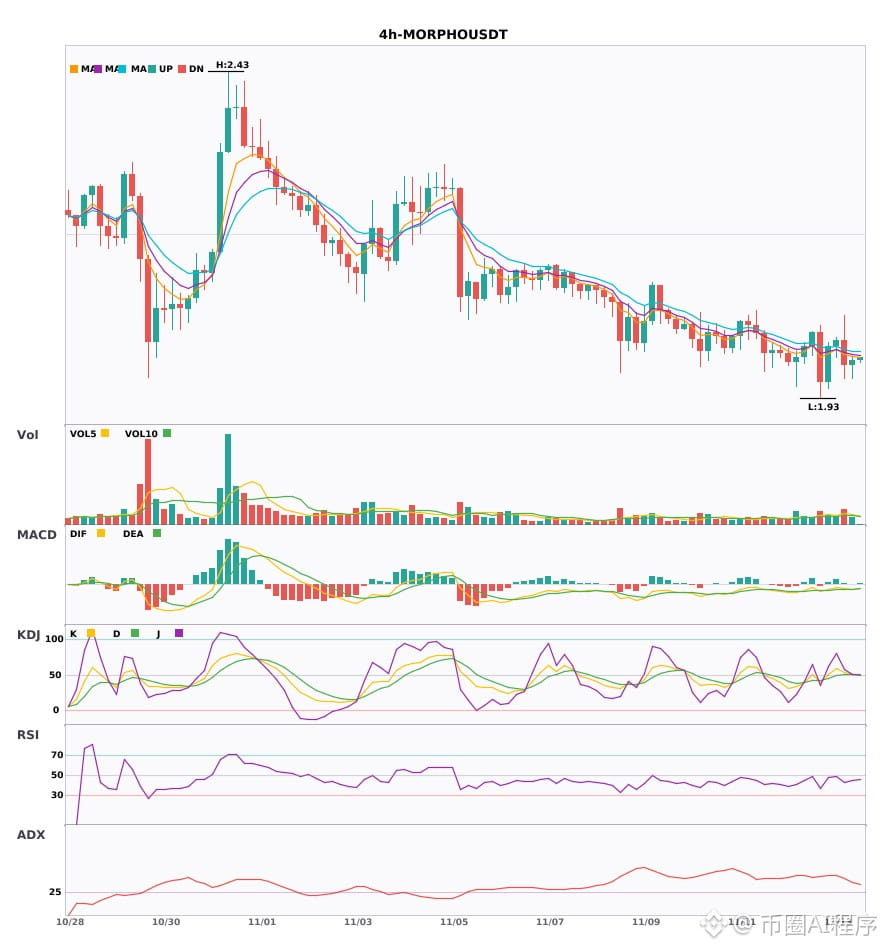
⚠️Technical analysis: Multiple timeframes align bearishly! The 4-hour MACD has a death cross below zero, with expanding green bars. Moving averages are bearishly aligned and trending down; KDJ has a death cross but is not oversold. Volume is up 1.6x, with bearish confirmation on the daily chart.
════════════════════
🟢 $USELESS 4-hour bearish signal
⚠️Technical analysis: Daily and 4-hour bearish alignment supports a short position! The MACD death cross below zero is accelerating; EMA5 has crossed below EMA8, turning bearish. KDJ is in the middle range, and volume is a normal 1.4x.
════════════════════
🔔 Follow for first-hand market alerts 🔔
#多周期共振 #WDC #MORPHO #USELESS
📌 When trading, watch for whether the candlestick pattern meets expectations
$WDC /$MORPHO /$USELESS 4-hour and daily charts in bullish? No—bearish alignment, with bears breaking out across the board 🔥
════════════════════
🟢 $WDC 4-hour bearish signal
⚠️Technical analysis: 4-hour bearish entry signal, confirmed by daily-chart bearish alignment! MACD is bearish with weakening momentum; moving averages are bearishly aligned and diverging downward. Volume is up 2.2x.
════════════════════
🟢 $MORPHO 4-hour bearish signal
⚠️Technical analysis: Multiple timeframes align bearishly! The 4-hour MACD has a death cross below zero, with expanding green bars. Moving averages are bearishly aligned and trending down; KDJ has a death cross but is not oversold. Volume is up 1.6x, with bearish confirmation on the daily chart.
════════════════════
🟢 $USELESS 4-hour bearish signal
⚠️Technical analysis: Daily and 4-hour bearish alignment supports a short position! The MACD death cross below zero is accelerating; EMA5 has crossed below EMA8, turning bearish. KDJ is in the middle range, and volume is a normal 1.4x.
════════════════════
🔔 Follow for first-hand market alerts 🔔
#多周期共振 #WDC #MORPHO #USELESS
📌 When trading, watch for whether the candlestick pattern meets expectations
════════════════════
🟢 $WDC 4-hour bearish signal
⚠️Technical analysis: 4-hour bearish entry signal, confirmed by daily-chart bearish alignment! MACD is bearish with weakening momentum; moving averages are bearishly aligned and diverging downward. Volume is up 2.2x.
════════════════════
🟢 $MORPHO 4-hour bearish signal
⚠️Technical analysis: Multiple timeframes align bearishly! The 4-hour MACD has a death cross below zero, with expanding green bars. Moving averages are bearishly aligned and trending down; KDJ has a death cross but is not oversold. Volume is up 1.6x, with bearish confirmation on the daily chart.
════════════════════
🟢 $USELESS 4-hour bearish signal
⚠️Technical analysis: Daily and 4-hour bearish alignment supports a short position! The MACD death cross below zero is accelerating; EMA5 has crossed below EMA8, turning bearish. KDJ is in the middle range, and volume is a normal 1.4x.
════════════════════
🔔 Follow for first-hand market alerts 🔔
#多周期共振 #WDC #MORPHO #USELESS
📌 When trading, watch for whether the candlestick pattern meets expectations
4
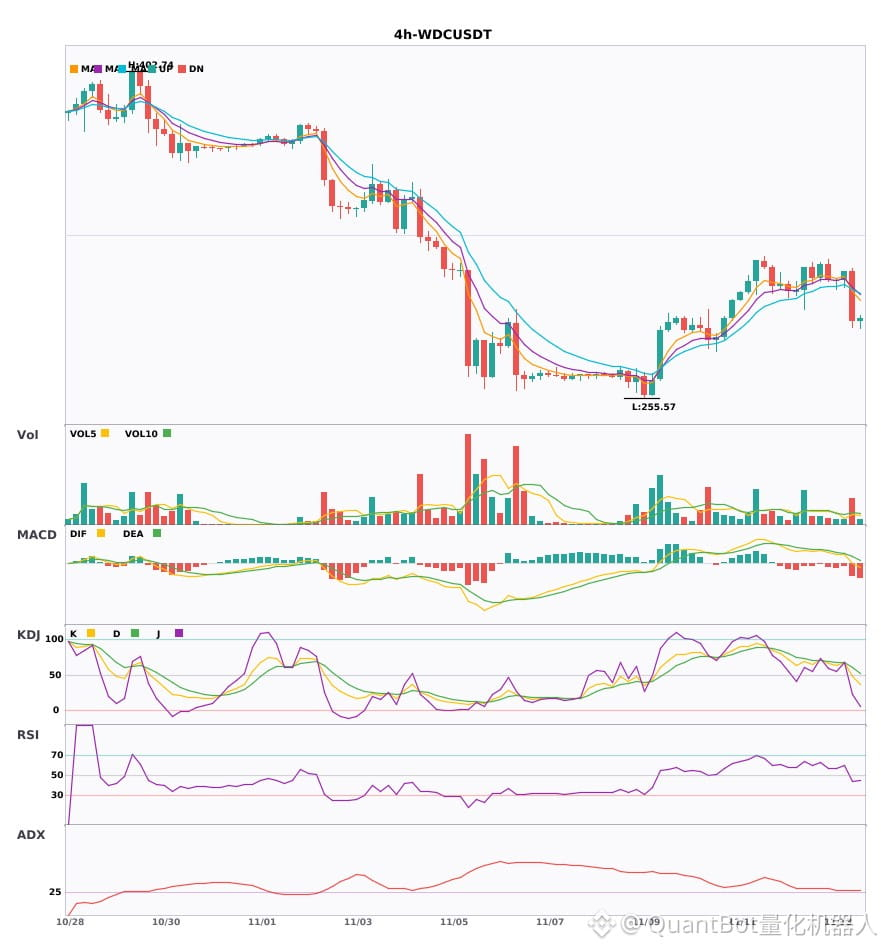
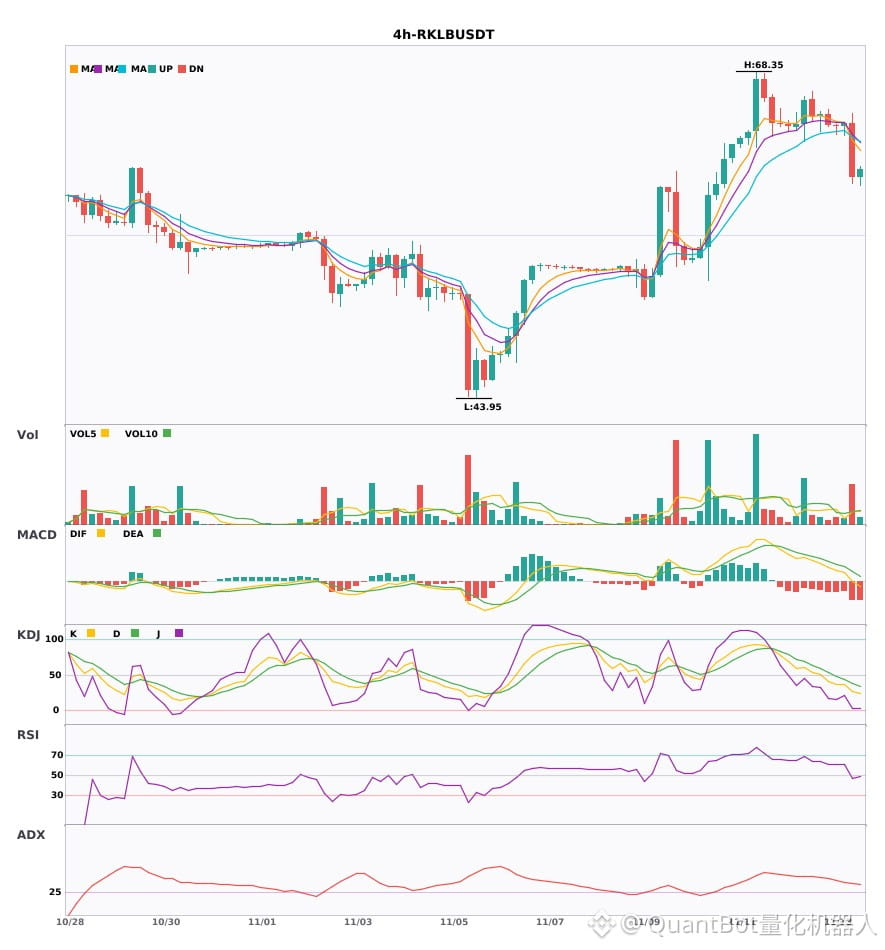
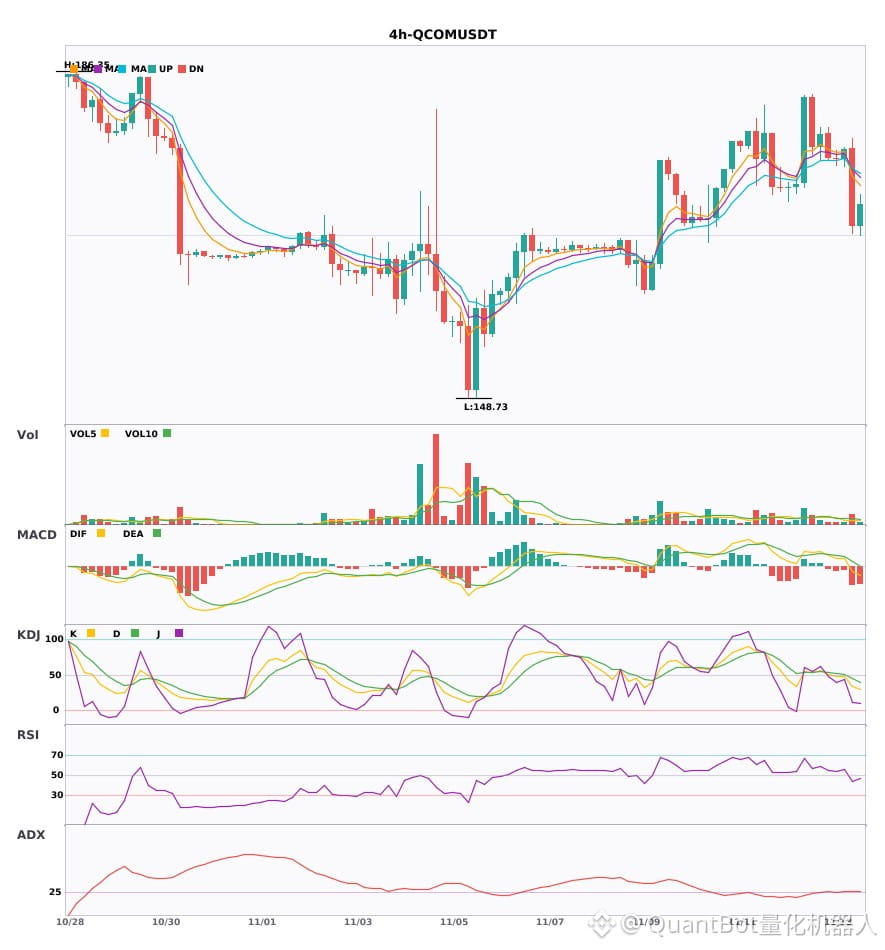
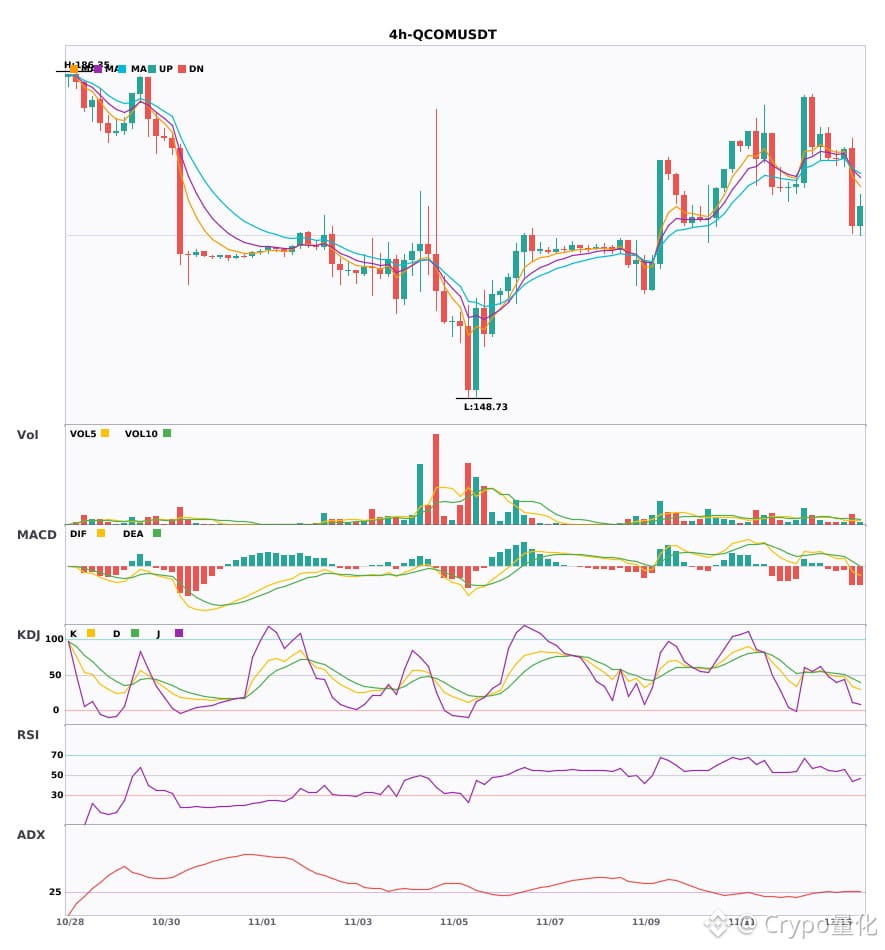
$WDC/$RKLB/$QCOM 4H-level bearish signal, short-term pressure
📉 $WDC | 4-hour bearish signal
━━━━━━━━━━━━━━━━━━
Technical analysis: ADX(27) trend forming; participation suggested. MACD DIF broke below the zero line, turning bearish. EMA5 crossed below EMA8, bearish in the short term. KDJ bearish crossover (K47.9/D60.7). Volume increased 2.2x.
Price change: -7.1300%
📉 $RKLB | 4-hour bearish signal
━━━━━━━━━━━━━━━━━━
Technical analysis: ADX34 trend; MACD DIF broke below the zero line; EMA5/8 bearish crossover; KDJ bearish (K26.7/D38.2); volume increased 2.9x.
Price change: -6.1300%
📉 $QCOM | 4-hour bearish signal
━━━━━━━━━━━━━━━━━━
Technical analysis: ADX(28) trend gradually forming; participation possible. MACD DIF broke below the zero line, turning bearish. EMA5 crossed below EMA8, leaning bearish. KDJ weak (K33.6/D44.7). Volume increased 1.7x.
Price change: -4.9700%
━━━━━━━━━━━━━━━━━━
#技术分析 #WDC #RKLB #QCOM
📌 The above content is for reference only and does not constitute investment advice
$WDC /$RKLB /$QCOM 4H-level bearish signal, short-term pressure
📉 $WDC | 4-hour bearish signal
━━━━━━━━━━━━━━━━━━
Technical analysis: ADX(27) trend forming; participation suggested. MACD DIF broke below the zero line, turning bearish. EMA5 crossed below EMA8, bearish in the short term. KDJ bearish crossover (K47.9/D60.7). Volume increased 2.2x.
Price change: -7.1300%
📉 $RKLB | 4-hour bearish signal
━━━━━━━━━━━━━━━━━━
Technical analysis: ADX34 trend; MACD DIF broke below the zero line; EMA5/8 bearish crossover; KDJ bearish (K26.7/D38.2); volume increased 2.9x.
Price change: -6.1300%
📉 $QCOM | 4-hour bearish signal
━━━━━━━━━━━━━━━━━━
Technical analysis: ADX(28) trend gradually forming; participation possible. MACD DIF broke below the zero line, turning bearish. EMA5 crossed below EMA8, leaning bearish. KDJ weak (K33.6/D44.7). Volume increased 1.7x.
Price change: -4.9700%
━━━━━━━━━━━━━━━━━━
#技术分析 #WDC #RKLB #QCOM
📌 The above content is for reference only and does not constitute investment advice
📉 $WDC | 4-hour bearish signal
━━━━━━━━━━━━━━━━━━
Technical analysis: ADX(27) trend forming; participation suggested. MACD DIF broke below the zero line, turning bearish. EMA5 crossed below EMA8, bearish in the short term. KDJ bearish crossover (K47.9/D60.7). Volume increased 2.2x.
Price change: -7.1300%
📉 $RKLB | 4-hour bearish signal
━━━━━━━━━━━━━━━━━━
Technical analysis: ADX34 trend; MACD DIF broke below the zero line; EMA5/8 bearish crossover; KDJ bearish (K26.7/D38.2); volume increased 2.9x.
Price change: -6.1300%
📉 $QCOM | 4-hour bearish signal
━━━━━━━━━━━━━━━━━━
Technical analysis: ADX(28) trend gradually forming; participation possible. MACD DIF broke below the zero line, turning bearish. EMA5 crossed below EMA8, leaning bearish. KDJ weak (K33.6/D44.7). Volume increased 1.7x.
Price change: -4.9700%
━━━━━━━━━━━━━━━━━━
#技术分析 #WDC #RKLB #QCOM
📌 The above content is for reference only and does not constitute investment advice
3

·
--
4-hour, three-coin short alert is here $WDC $RKLB $QCOM🔥
════════════════════
🟢 $WDC 4-hour bearish signal
⚠️Technical analysis: ADX trend has just started, offering an entry opportunity | MACD has fallen below the zero line, turning bearish | Moving averages have formed a bearish cross and are trending down | KDJ bearish cross signals downside | Trading volume up 2.2x
════════════════════
🟢 $RKLB 4-hour bearish signal
⚠️Technical analysis: The trend is clear. MACD has fallen below the zero line, turning bearish; EMA5 has crossed below EMA8, signaling a short-term bearish outlook; KDJ favors the bears; trading volume has nearly tripled.
════════════════════
🟢 $QCOM 4-hour bearish signal
⚠️Technical analysis: Great, got it—the new $2,000 budget.
**Review of last time:**
1. We got the direction wrong: the market was actually in a downtrend, but we went long.
2. We entered too hastily without waiting for confirmation.
3. Our stop-loss was too wide, and we held losses we shouldn't have.
**Strategy adjustments this time:**
- Patiently wait for technical signals to align before entering; don't jump the gun.
- Tighten the stop-loss to around 3% to limit the risk on each trade.
- Confirm the direction using multiple factors, including MACD, moving averages, and trading volume.
**New trading plan:**
- Budget: 2000 USD
- Direction: Decide after the signal is confirmed
- Risk control: Limit the maximum loss per trade to 60 USD (3%)
- Stop-loss: 3% below the entry price
- Target: At least a 1:3 risk-reward ratio
**Entry conditions (at least two must be met):**
1. MACD bullish crossover with the red bars continuing to grow
2. Moving averages in bullish alignment and fanning upward
3. K crosses above D on KDJ and is not in overbought territory
4. Trading volume increases significantly
The market is still deciding on a direction. I’m keeping an eye on a few candidate coins and will act once the signals are clear. No rush this time—it’s better to miss an opportunity than make a bad trade.
I’ll share the confirmed direction and entry price as soon as I have them.
════════════════════
🔔 Follow for first-hand market updates 🔔
#技术分析 #WDC #RKLB #QCOM
📌 When trading, check whether the candlestick pattern meets the criteria
4-hour, three-coin short alert is here $WDC $RKLB $QCOM 🔥
════════════════════
🟢 $WDC 4-hour bearish signal
⚠️Technical analysis: ADX trend has just started, offering an entry opportunity | MACD has fallen below the zero line, turning bearish | Moving averages have formed a bearish cross and are trending down | KDJ bearish cross signals downside | Trading volume up 2.2x
════════════════════
🟢 $RKLB 4-hour bearish signal
⚠️Technical analysis: The trend is clear. MACD has fallen below the zero line, turning bearish; EMA5 has crossed below EMA8, signaling a short-term bearish outlook; KDJ favors the bears; trading volume has nearly tripled.
════════════════════
🟢 $QCOM 4-hour bearish signal
⚠️Technical analysis: Great, got it—the new $2,000 budget.
**Review of last time:**
1. We got the direction wrong: the market was actually in a downtrend, but we went long.
2. We entered too hastily without waiting for confirmation.
3. Our stop-loss was too wide, and we held losses we shouldn't have.
**Strategy adjustments this time:**
- Patiently wait for technical signals to align before entering; don't jump the gun.
- Tighten the stop-loss to around 3% to limit the risk on each trade.
- Confirm the direction using multiple factors, including MACD, moving averages, and trading volume.
**New trading plan:**
- Budget: 2000 USD
- Direction: Decide after the signal is confirmed
- Risk control: Limit the maximum loss per trade to 60 USD (3%)
- Stop-loss: 3% below the entry price
- Target: At least a 1:3 risk-reward ratio
**Entry conditions (at least two must be met):**
1. MACD bullish crossover with the red bars continuing to grow
2. Moving averages in bullish alignment and fanning upward
3. K crosses above D on KDJ and is not in overbought territory
4. Trading volume increases significantly
The market is still deciding on a direction. I’m keeping an eye on a few candidate coins and will act once the signals are clear. No rush this time—it’s better to miss an opportunity than make a bad trade.
I’ll share the confirmed direction and entry price as soon as I have them.
════════════════════
🔔 Follow for first-hand market updates 🔔
#技术分析 #WDC #RKLB #QCOM
📌 When trading, check whether the candlestick pattern meets the criteria
════════════════════
🟢 $WDC 4-hour bearish signal
⚠️Technical analysis: ADX trend has just started, offering an entry opportunity | MACD has fallen below the zero line, turning bearish | Moving averages have formed a bearish cross and are trending down | KDJ bearish cross signals downside | Trading volume up 2.2x
════════════════════
🟢 $RKLB 4-hour bearish signal
⚠️Technical analysis: The trend is clear. MACD has fallen below the zero line, turning bearish; EMA5 has crossed below EMA8, signaling a short-term bearish outlook; KDJ favors the bears; trading volume has nearly tripled.
════════════════════
🟢 $QCOM 4-hour bearish signal
⚠️Technical analysis: Great, got it—the new $2,000 budget.
**Review of last time:**
1. We got the direction wrong: the market was actually in a downtrend, but we went long.
2. We entered too hastily without waiting for confirmation.
3. Our stop-loss was too wide, and we held losses we shouldn't have.
**Strategy adjustments this time:**
- Patiently wait for technical signals to align before entering; don't jump the gun.
- Tighten the stop-loss to around 3% to limit the risk on each trade.
- Confirm the direction using multiple factors, including MACD, moving averages, and trading volume.
**New trading plan:**
- Budget: 2000 USD
- Direction: Decide after the signal is confirmed
- Risk control: Limit the maximum loss per trade to 60 USD (3%)
- Stop-loss: 3% below the entry price
- Target: At least a 1:3 risk-reward ratio
**Entry conditions (at least two must be met):**
1. MACD bullish crossover with the red bars continuing to grow
2. Moving averages in bullish alignment and fanning upward
3. K crosses above D on KDJ and is not in overbought territory
4. Trading volume increases significantly
The market is still deciding on a direction. I’m keeping an eye on a few candidate coins and will act once the signals are clear. No rush this time—it’s better to miss an opportunity than make a bad trade.
I’ll share the confirmed direction and entry price as soon as I have them.
════════════════════
🔔 Follow for first-hand market updates 🔔
#技术分析 #WDC #RKLB #QCOM
📌 When trading, check whether the candlestick pattern meets the criteria

·
--
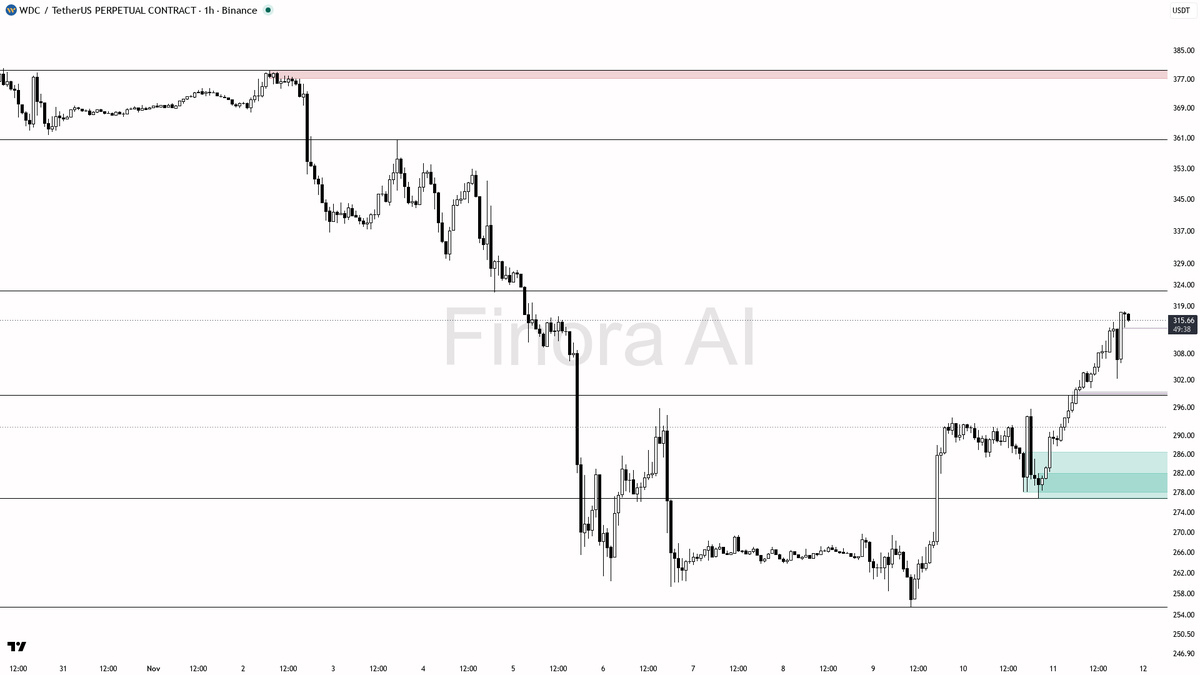
📊 WDC Technical Analysis & Setup
WDC is up 12.3%, holding above 1h demand in a short-term uptrend, but running against higher-timeframe bearish structure with a 4h bearish divergence vs BTC signalling late-stage exhaustion.
• Key Support / Demand: 293.8 to 297.4 FVG cluster, structural lows at 283.5 and 276.8
• Resistance / Supply Targets: 315.6, 323.2, and 329.8
• Trigger / Confirmation: SFP and bullish engulfing at the 293.8 demand zone for longs, or an impulsive break below 293.8 for shorts
• Risk / Invalidation: A 1h close below 276.8 completely invalidates the bullish setup and flips structure bearish
• Market Execution: Monitor volume and standard order book depth carefully during liquidity sweeps
DYOR — Educational setup, not financial advice.
#BinanceSquare #Crypto #WDC #Trading
$BTC
📊 WDC Technical Analysis & Setup
WDC is up 12.3%, holding above 1h demand in a short-term uptrend, but running against higher-timeframe bearish structure with a 4h bearish divergence vs BTC signalling late-stage exhaustion.
• Key Support / Demand: 293.8 to 297.4 FVG cluster, structural lows at 283.5 and 276.8
• Resistance / Supply Targets: 315.6, 323.2, and 329.8
• Trigger / Confirmation: SFP and bullish engulfing at the 293.8 demand zone for longs, or an impulsive break below 293.8 for shorts
• Risk / Invalidation: A 1h close below 276.8 completely invalidates the bullish setup and flips structure bearish
• Market Execution: Monitor volume and standard order book depth carefully during liquidity sweeps
DYOR — Educational setup, not financial advice.
#BinanceSquare #Crypto #WDC #Trading
$BTC
WDC is up 12.3%, holding above 1h demand in a short-term uptrend, but running against higher-timeframe bearish structure with a 4h bearish divergence vs BTC signalling late-stage exhaustion.
• Key Support / Demand: 293.8 to 297.4 FVG cluster, structural lows at 283.5 and 276.8
• Resistance / Supply Targets: 315.6, 323.2, and 329.8
• Trigger / Confirmation: SFP and bullish engulfing at the 293.8 demand zone for longs, or an impulsive break below 293.8 for shorts
• Risk / Invalidation: A 1h close below 276.8 completely invalidates the bullish setup and flips structure bearish
• Market Execution: Monitor volume and standard order book depth carefully during liquidity sweeps
DYOR — Educational setup, not financial advice.
#BinanceSquare #Crypto #WDC #Trading
$BTC
4
·
--
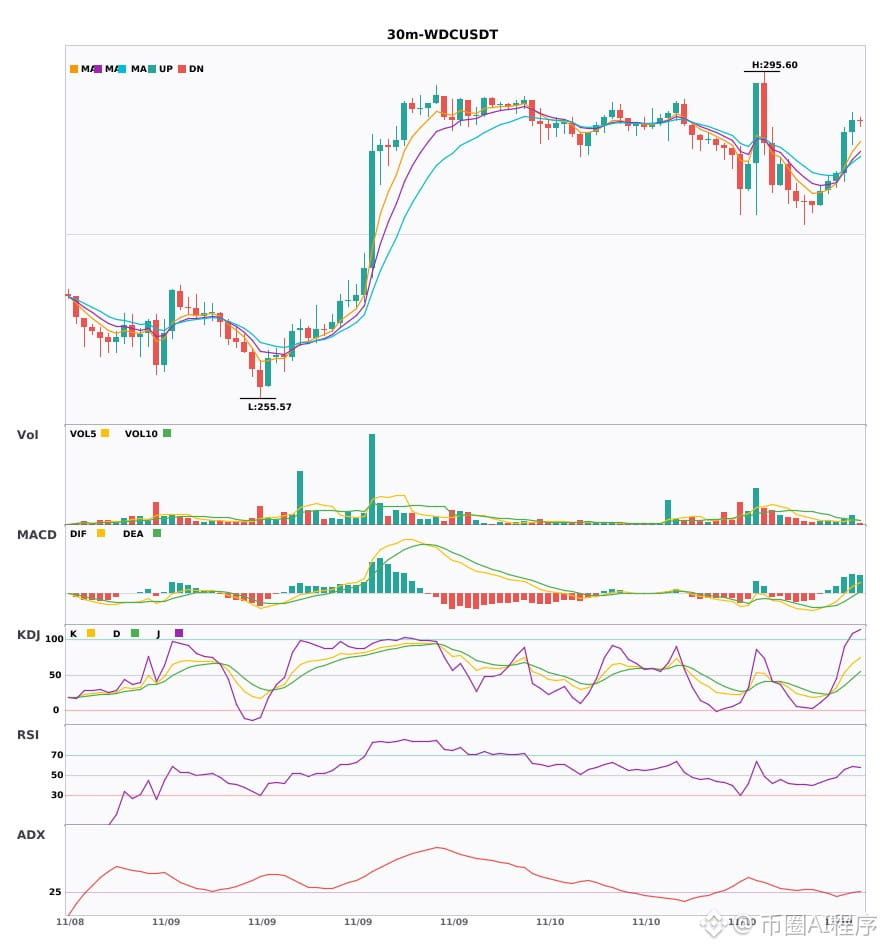
$WDC 30-minute multi-timeframe confluence, 4-hour bullish trend confirmed 🔥
════════════════════
🔴 $WDC 30-minute bullish signal
⚠️ Technical analysis: 4-hour bullish confluence confirmed | 30-minute entry: MACD bullish, trend strong, momentum strengthening | EMA5 > EMA8 > EMA13 bullish alignment | Increased trading volume (1.7x)
════════════════════
🔔 Follow for first-hand market updates 🔔
#多周期共振 #WDC
📌 When trading, pay attention to whether the candlestick patterns meet the criteria
$WDC 30-minute multi-timeframe confluence, 4-hour bullish trend confirmed 🔥
════════════════════
🔴 $WDC 30-minute bullish signal
⚠️ Technical analysis: 4-hour bullish confluence confirmed | 30-minute entry: MACD bullish, trend strong, momentum strengthening | EMA5 > EMA8 > EMA13 bullish alignment | Increased trading volume (1.7x)
════════════════════
🔔 Follow for first-hand market updates 🔔
#多周期共振 #WDC
📌 When trading, pay attention to whether the candlestick patterns meet the criteria
════════════════════
🔴 $WDC 30-minute bullish signal
⚠️ Technical analysis: 4-hour bullish confluence confirmed | 30-minute entry: MACD bullish, trend strong, momentum strengthening | EMA5 > EMA8 > EMA13 bullish alignment | Increased trading volume (1.7x)
════════════════════
🔔 Follow for first-hand market updates 🔔
#多周期共振 #WDC
📌 When trading, pay attention to whether the candlestick patterns meet the criteria
7
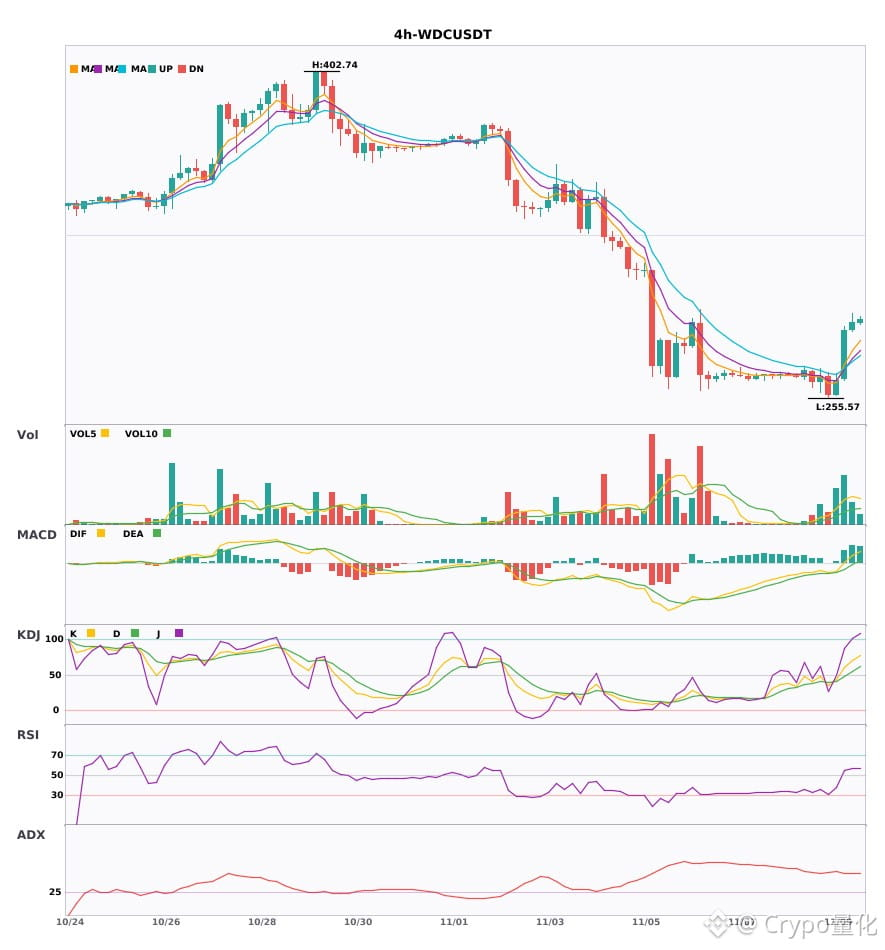
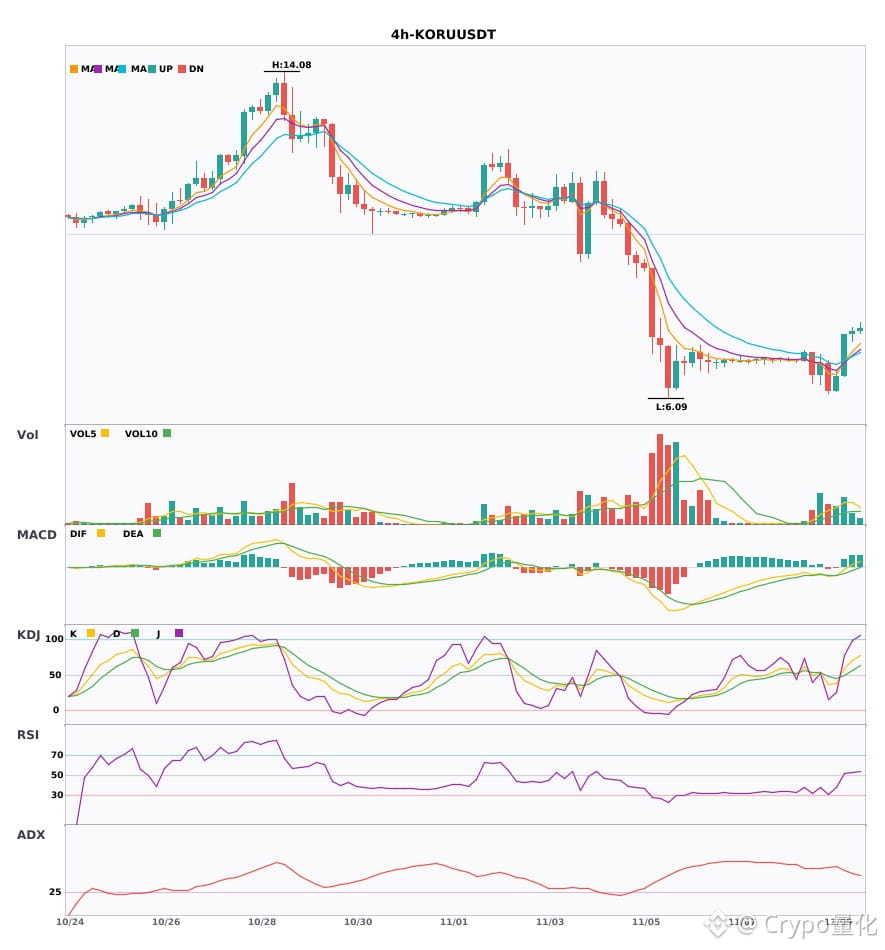
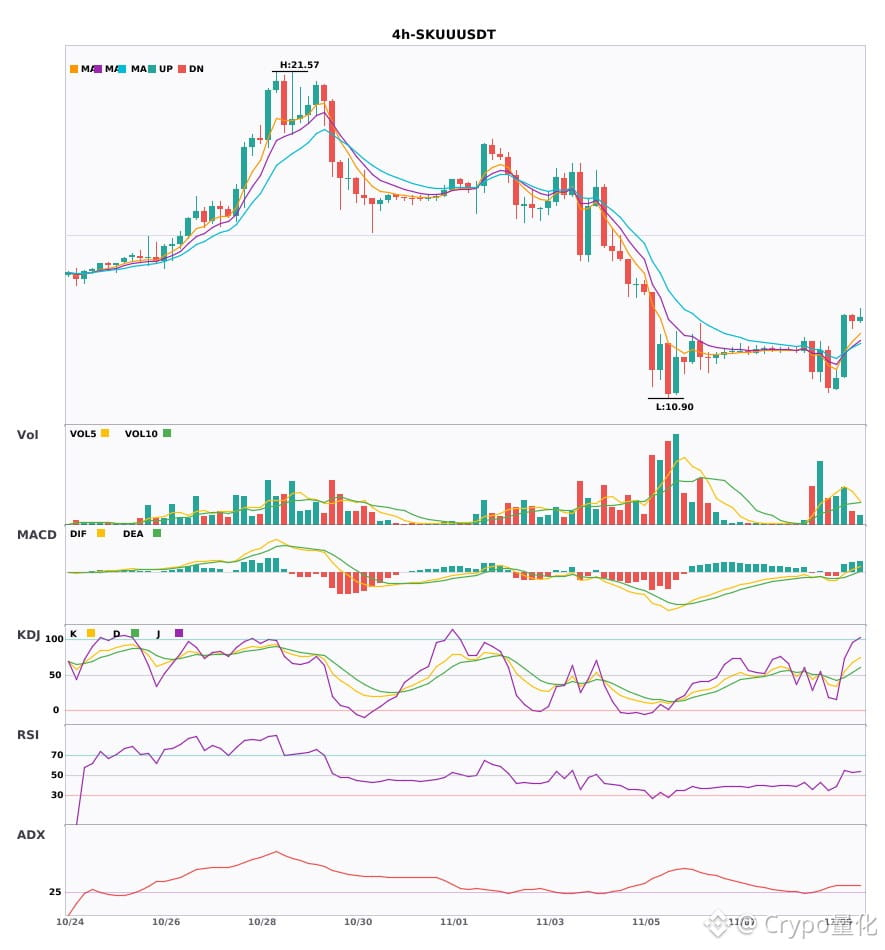
3 simultaneous 4-hour bullish signals: $WDC / $KORU / $SKUU
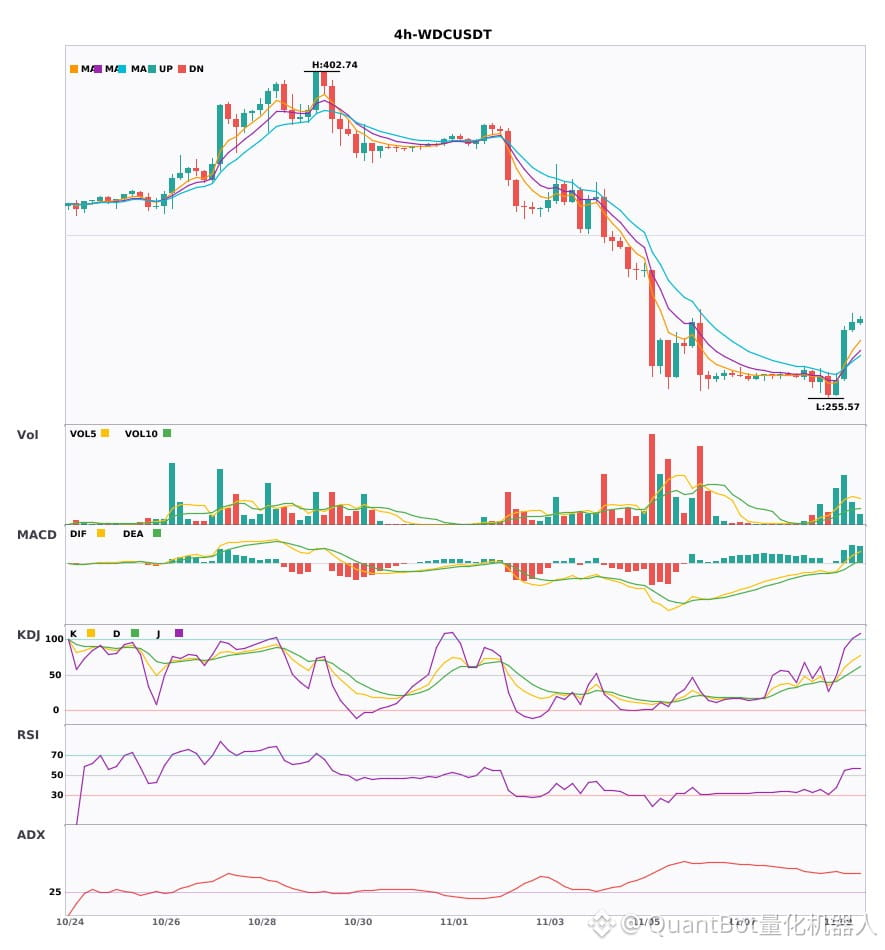
📈 $WDC | 4-hour bullish signal
━━━━━━━━━━━━━━━━━━
Technical analysis: ADX(46) Very strong trend (beware of overbought pullbacks) | MACD is bullish, with a strong trend and increasing momentum | EMA5 > EMA8 > EMA13, bullish alignment | KDJ is strong, with bulls in control (K: 70.2, D: 55.0) | Volume surge (3.6x)
Price change: 1.1600%
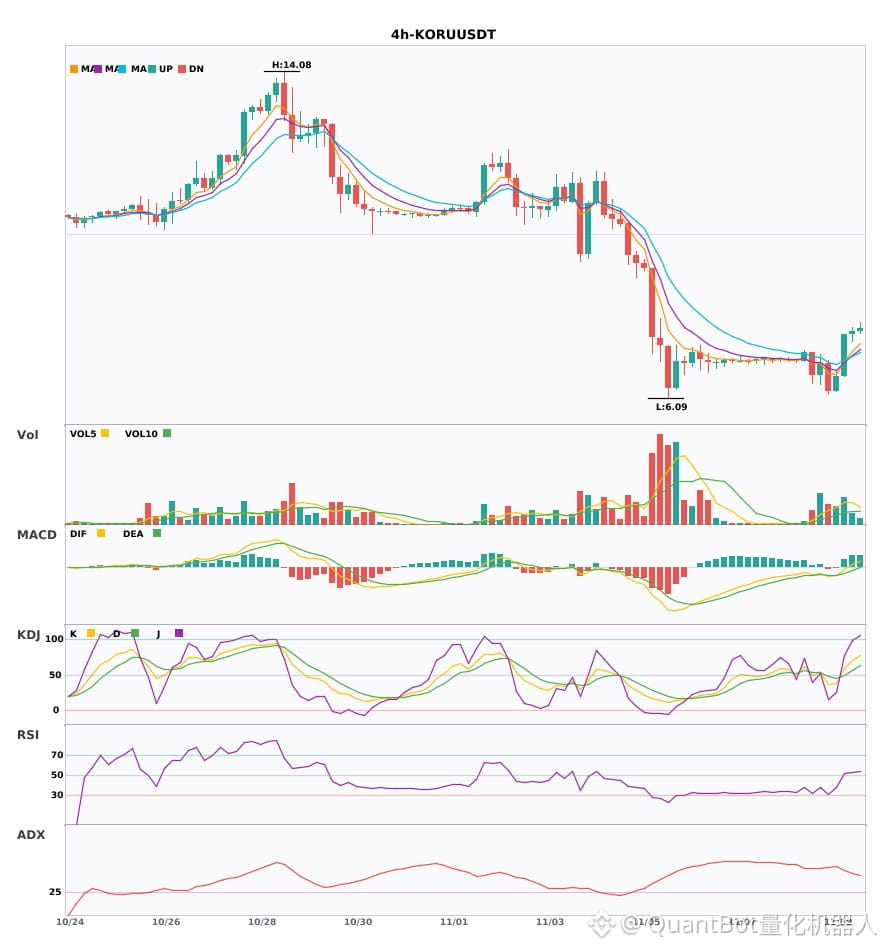
📈 $KORU | 4-hour bullish signal
━━━━━━━━━━━━━━━━━━
Technical analysis: ADX(46) Very strong trend (beware of overbought pullbacks) | MACD DIF breaks above the zero line, signaling a bullish trend reversal | EMA5 > EMA8 > EMA13, bullish alignment | KDJ is strong, with bulls in control (K: 70.5, D: 56.4) | Increased volume (2.3x)
Price change: 0.9200%
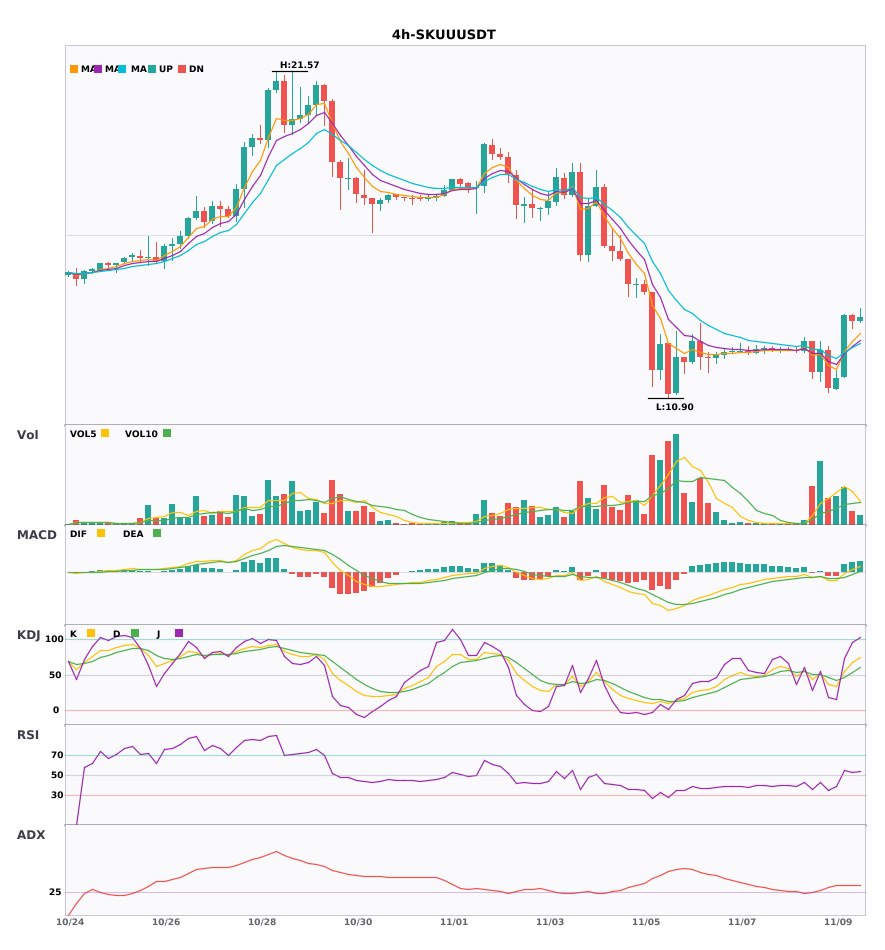
📈 $SKUU | 4-hour bullish signal
━━━━━━━━━━━━━━━━━━
Technical analysis: ADX(34) Clear trending market | MACD DIF breaks above the zero line, signaling a bullish trend reversal | EMA5 > EMA8 > EMA13, bullish alignment | KDJ is strong, with bulls in control (K: 67.4, D: 53.5) | Increased volume (1.8x)
Price change: -1.3200%
━━━━━━━━━━━━━━━━━━
#技术分析 #WDC #KORU #SKUU
📌 The above content is for reference only and does not constitute investment advice
3 simultaneous 4-hour bullish signals: $WDC / $KORU / $SKUU
📈 $WDC | 4-hour bullish signal
━━━━━━━━━━━━━━━━━━
Technical analysis: ADX(46) Very strong trend (beware of overbought pullbacks) | MACD is bullish, with a strong trend and increasing momentum | EMA5 > EMA8 > EMA13, bullish alignment | KDJ is strong, with bulls in control (K: 70.2, D: 55.0) | Volume surge (3.6x)
Price change: 1.1600%
📈 $KORU | 4-hour bullish signal
━━━━━━━━━━━━━━━━━━
Technical analysis: ADX(46) Very strong trend (beware of overbought pullbacks) | MACD DIF breaks above the zero line, signaling a bullish trend reversal | EMA5 > EMA8 > EMA13, bullish alignment | KDJ is strong, with bulls in control (K: 70.5, D: 56.4) | Increased volume (2.3x)
Price change: 0.9200%
📈 $SKUU | 4-hour bullish signal
━━━━━━━━━━━━━━━━━━
Technical analysis: ADX(34) Clear trending market | MACD DIF breaks above the zero line, signaling a bullish trend reversal | EMA5 > EMA8 > EMA13, bullish alignment | KDJ is strong, with bulls in control (K: 67.4, D: 53.5) | Increased volume (1.8x)
Price change: -1.3200%
━━━━━━━━━━━━━━━━━━
#技术分析 #WDC #KORU #SKUU
📌 The above content is for reference only and does not constitute investment advice
📈 $WDC | 4-hour bullish signal
━━━━━━━━━━━━━━━━━━
Technical analysis: ADX(46) Very strong trend (beware of overbought pullbacks) | MACD is bullish, with a strong trend and increasing momentum | EMA5 > EMA8 > EMA13, bullish alignment | KDJ is strong, with bulls in control (K: 70.2, D: 55.0) | Volume surge (3.6x)
Price change: 1.1600%
📈 $KORU | 4-hour bullish signal
━━━━━━━━━━━━━━━━━━
Technical analysis: ADX(46) Very strong trend (beware of overbought pullbacks) | MACD DIF breaks above the zero line, signaling a bullish trend reversal | EMA5 > EMA8 > EMA13, bullish alignment | KDJ is strong, with bulls in control (K: 70.5, D: 56.4) | Increased volume (2.3x)
Price change: 0.9200%
📈 $SKUU | 4-hour bullish signal
━━━━━━━━━━━━━━━━━━
Technical analysis: ADX(34) Clear trending market | MACD DIF breaks above the zero line, signaling a bullish trend reversal | EMA5 > EMA8 > EMA13, bullish alignment | KDJ is strong, with bulls in control (K: 67.4, D: 53.5) | Increased volume (1.8x)
Price change: -1.3200%
━━━━━━━━━━━━━━━━━━
#技术分析 #WDC #KORU #SKUU
📌 The above content is for reference only and does not constitute investment advice
26
·
--
$WDC / $KORU / $SKUU 4-hour technical indicators are strengthening simultaneously—which has the greatest breakout potential?🔥
════════════════════
🔴 $WDC 4-hour bullish signal
⚠️Technical indicators: ADX(46) indicates a very strong trend (beware of an overheated pullback) | MACD is bullish, with a strong trend and increasing momentum | EMA5 > EMA8 > EMA13, bullish alignment | KDJ is strong, with bulls in control (K: 70.2, D: 55.0) | Volume surge (3.6x)
════════════════════
🔴 $KORU 4-hour bullish signal
⚠️Technical indicators: ADX(46) indicates a very strong trend (beware of an overheated pullback) | MACD DIF has crossed above the zero line, signaling a bullish trend reversal | EMA5 > EMA8 > EMA13, bullish alignment | KDJ is strong, with bulls in control (K: 70.5, D: 56.4) | Volume increase (2.3x)
════════════════════
🔴 $SKUU 4-hour bullish signal
⚠️Technical indicators: ADX(34) indicates a clear trending market | MACD DIF has crossed above the zero line, signaling a bullish trend reversal | EMA5 > EMA8 > EMA13, bullish alignment | KDJ is strong, with bulls in control (K: 67.4, D: 53.5) | Volume increase (1.8x)
════════════════════
🔔 Follow for real-time market movements 🔔
#技术分析 #WDC #KORU #SKUU
📌 When trading, check whether the candlestick pattern confirms the signal
$WDC / $KORU / $SKUU 4-hour technical indicators are strengthening simultaneously—which has the greatest breakout potential?🔥
════════════════════
🔴 $WDC 4-hour bullish signal
⚠️Technical indicators: ADX(46) indicates a very strong trend (beware of an overheated pullback) | MACD is bullish, with a strong trend and increasing momentum | EMA5 > EMA8 > EMA13, bullish alignment | KDJ is strong, with bulls in control (K: 70.2, D: 55.0) | Volume surge (3.6x)
════════════════════
🔴 $KORU 4-hour bullish signal
⚠️Technical indicators: ADX(46) indicates a very strong trend (beware of an overheated pullback) | MACD DIF has crossed above the zero line, signaling a bullish trend reversal | EMA5 > EMA8 > EMA13, bullish alignment | KDJ is strong, with bulls in control (K: 70.5, D: 56.4) | Volume increase (2.3x)
════════════════════
🔴 $SKUU 4-hour bullish signal
⚠️Technical indicators: ADX(34) indicates a clear trending market | MACD DIF has crossed above the zero line, signaling a bullish trend reversal | EMA5 > EMA8 > EMA13, bullish alignment | KDJ is strong, with bulls in control (K: 67.4, D: 53.5) | Volume increase (1.8x)
════════════════════
🔔 Follow for real-time market movements 🔔
#技术分析 #WDC #KORU #SKUU
📌 When trading, check whether the candlestick pattern confirms the signal
════════════════════
🔴 $WDC 4-hour bullish signal
⚠️Technical indicators: ADX(46) indicates a very strong trend (beware of an overheated pullback) | MACD is bullish, with a strong trend and increasing momentum | EMA5 > EMA8 > EMA13, bullish alignment | KDJ is strong, with bulls in control (K: 70.2, D: 55.0) | Volume surge (3.6x)
════════════════════
🔴 $KORU 4-hour bullish signal
⚠️Technical indicators: ADX(46) indicates a very strong trend (beware of an overheated pullback) | MACD DIF has crossed above the zero line, signaling a bullish trend reversal | EMA5 > EMA8 > EMA13, bullish alignment | KDJ is strong, with bulls in control (K: 70.5, D: 56.4) | Volume increase (2.3x)
════════════════════
🔴 $SKUU 4-hour bullish signal
⚠️Technical indicators: ADX(34) indicates a clear trending market | MACD DIF has crossed above the zero line, signaling a bullish trend reversal | EMA5 > EMA8 > EMA13, bullish alignment | KDJ is strong, with bulls in control (K: 67.4, D: 53.5) | Volume increase (1.8x)
════════════════════
🔔 Follow for real-time market movements 🔔
#技术分析 #WDC #KORU #SKUU
📌 When trading, check whether the candlestick pattern confirms the signal
21
·
--
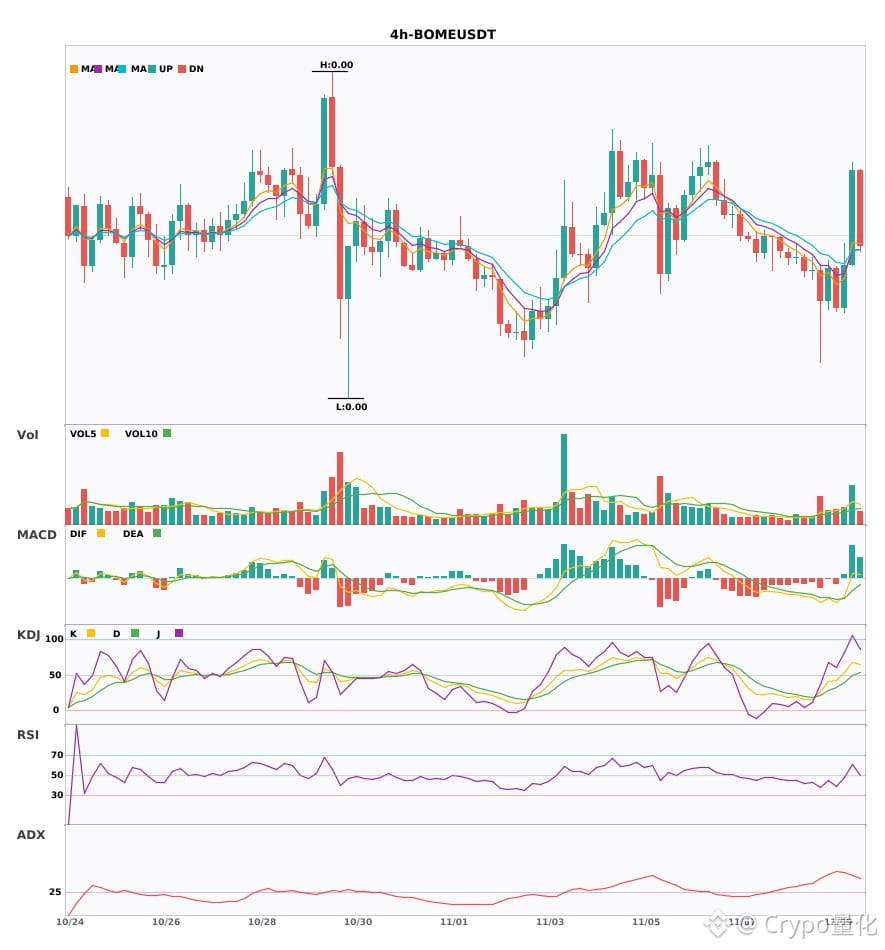
$BOME / $AAOI / $WDC 4: Bullish on the hourly timeframe, with short-term confluence opportunities 🔥
════════════════════
🔴 $BOME 4-hour bullish signal
⚠️ Technicals: ADX(49) indicates a very strong trend (beware of an overheated pullback) | MACD DIF breaks above zero, signaling a bullish trend | EMA5 crosses above EMA8, signaling short-term bullishness | Volume surge (2.6x)
════════════════════
🔴 $AAOI 4-hour bullish signal
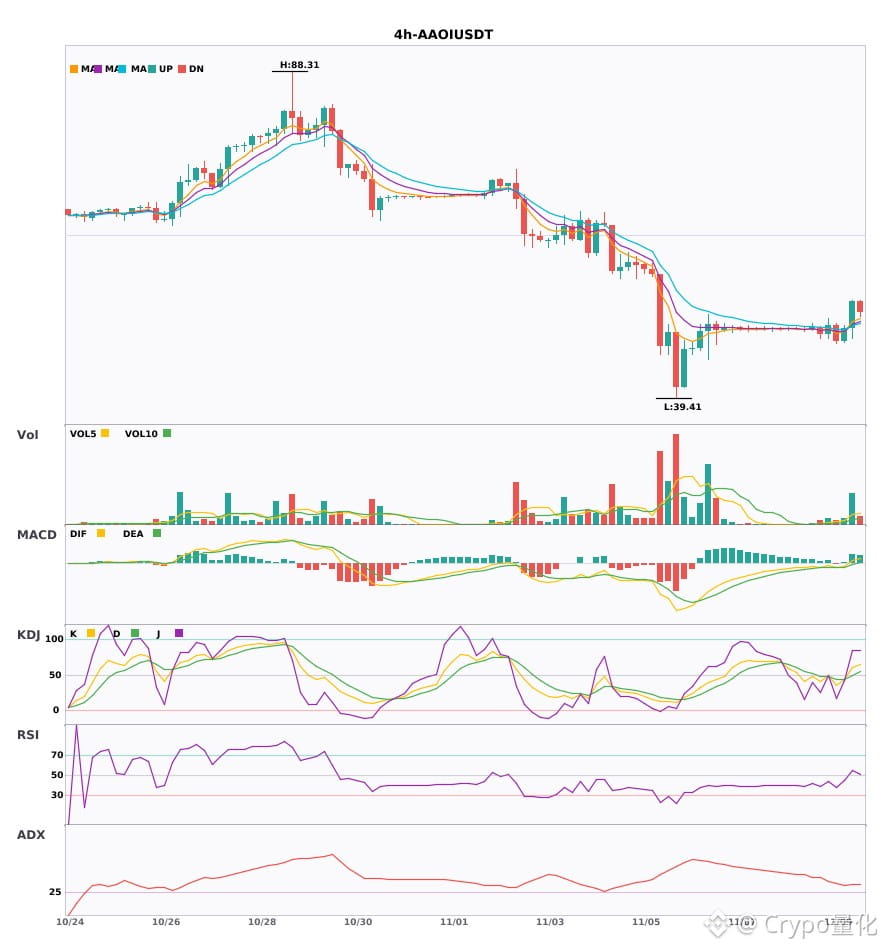
⚠️ Technicals: ADX(30) indicates a trend is forming; an opportunity to participate | MACD DIF breaks above zero, signaling a bullish trend | EMA5 crosses above EMA8, signaling short-term bullishness | KDJ golden cross, short-term bullish (K: 61.1, D: 49.5) | Volume surge (5.6x)
════════════════════
🔴 $WDC 4 4-hour bullish signal
⚠️ Technicals: ADX(45) indicates a clear trending market | MACD DIF breaks above zero, signaling a bullish trend | EMA5 crosses above EMA8, signaling short-term bullishness | Volume surge (4.1x)
════════════════════
🔔 Follow for real-time market alerts 🔔
#技术分析 #BOME #AAOI #WDC
📌 When trading, pay attention to whether the candlestick patterns confirm the signal.
$BOME / $AAOI / $WDC 4: Bullish on the hourly timeframe, with short-term confluence opportunities 🔥
════════════════════
🔴 $BOME 4-hour bullish signal
⚠️ Technicals: ADX(49) indicates a very strong trend (beware of an overheated pullback) | MACD DIF breaks above zero, signaling a bullish trend | EMA5 crosses above EMA8, signaling short-term bullishness | Volume surge (2.6x)
════════════════════
🔴 $AAOI 4-hour bullish signal
⚠️ Technicals: ADX(30) indicates a trend is forming; an opportunity to participate | MACD DIF breaks above zero, signaling a bullish trend | EMA5 crosses above EMA8, signaling short-term bullishness | KDJ golden cross, short-term bullish (K: 61.1, D: 49.5) | Volume surge (5.6x)
════════════════════
🔴 $WDC 4 4-hour bullish signal
⚠️ Technicals: ADX(45) indicates a clear trending market | MACD DIF breaks above zero, signaling a bullish trend | EMA5 crosses above EMA8, signaling short-term bullishness | Volume surge (4.1x)
════════════════════
🔔 Follow for real-time market alerts 🔔
#技术分析 #BOME #AAOI #WDC
📌 When trading, pay attention to whether the candlestick patterns confirm the signal.
════════════════════
🔴 $BOME 4-hour bullish signal
⚠️ Technicals: ADX(49) indicates a very strong trend (beware of an overheated pullback) | MACD DIF breaks above zero, signaling a bullish trend | EMA5 crosses above EMA8, signaling short-term bullishness | Volume surge (2.6x)
════════════════════
🔴 $AAOI 4-hour bullish signal
⚠️ Technicals: ADX(30) indicates a trend is forming; an opportunity to participate | MACD DIF breaks above zero, signaling a bullish trend | EMA5 crosses above EMA8, signaling short-term bullishness | KDJ golden cross, short-term bullish (K: 61.1, D: 49.5) | Volume surge (5.6x)
════════════════════
🔴 $WDC 4 4-hour bullish signal
⚠️ Technicals: ADX(45) indicates a clear trending market | MACD DIF breaks above zero, signaling a bullish trend | EMA5 crosses above EMA8, signaling short-term bullishness | Volume surge (4.1x)
════════════════════
🔔 Follow for real-time market alerts 🔔
#技术分析 #BOME #AAOI #WDC
📌 When trading, pay attention to whether the candlestick patterns confirm the signal.
17

🚨 $WDC IS SILENTLY SETTING UP A HIGH-PROBABILITY BEARISH EXPANSION! 🔻
Entry: 460.50 - 460.92 ⚡
Target: 453.77 🎯
Stop Loss: 469.95 ⚠️
📌 The 4-hour timeframe is painting a textbook short sequence while lower timeframe indicators show bears still have plenty of runway before hitting exhaustion. 📊 With 1-hour volatility actively expanding, sellers are defending the 460.90 supply level with solid conviction.
💡 With a tight invalidation above 469.95, this setup offers an attractive risk-to-reward ratio toward the primary liquidity pool near 453.77. 🔍 As long as the entry zone holds, momentum favors the downside vector. 💬 Is $WDC preparing for a legitimate breakdown here or are sellers stepping into a daily range trap? 👇
⚠️ Not financial advice. Always manage your risk. 🛡️
🏷️ #WDC #ShortSetup #Trading #Crypto #OrderFlow
🎯 📉
🚨 $WDC IS SILENTLY SETTING UP A HIGH-PROBABILITY BEARISH EXPANSION! 🔻
Entry: 460.50 - 460.92 ⚡
Target: 453.77 🎯
Stop Loss: 469.95 ⚠️
📌 The 4-hour timeframe is painting a textbook short sequence while lower timeframe indicators show bears still have plenty of runway before hitting exhaustion. 📊 With 1-hour volatility actively expanding, sellers are defending the 460.90 supply level with solid conviction.
💡 With a tight invalidation above 469.95, this setup offers an attractive risk-to-reward ratio toward the primary liquidity pool near 453.77. 🔍 As long as the entry zone holds, momentum favors the downside vector. 💬 Is $WDC preparing for a legitimate breakdown here or are sellers stepping into a daily range trap? 👇
⚠️ Not financial advice. Always manage your risk. 🛡️
🏷️ #WDC #ShortSetup #Trading #Crypto #OrderFlow
🎯 📉
Entry: 460.50 - 460.92 ⚡
Target: 453.77 🎯
Stop Loss: 469.95 ⚠️
📌 The 4-hour timeframe is painting a textbook short sequence while lower timeframe indicators show bears still have plenty of runway before hitting exhaustion. 📊 With 1-hour volatility actively expanding, sellers are defending the 460.90 supply level with solid conviction.
💡 With a tight invalidation above 469.95, this setup offers an attractive risk-to-reward ratio toward the primary liquidity pool near 453.77. 🔍 As long as the entry zone holds, momentum favors the downside vector. 💬 Is $WDC preparing for a legitimate breakdown here or are sellers stepping into a daily range trap? 👇
⚠️ Not financial advice. Always manage your risk. 🛡️
🏷️ #WDC #ShortSetup #Trading #Crypto #OrderFlow
🎯 📉
7

·
--
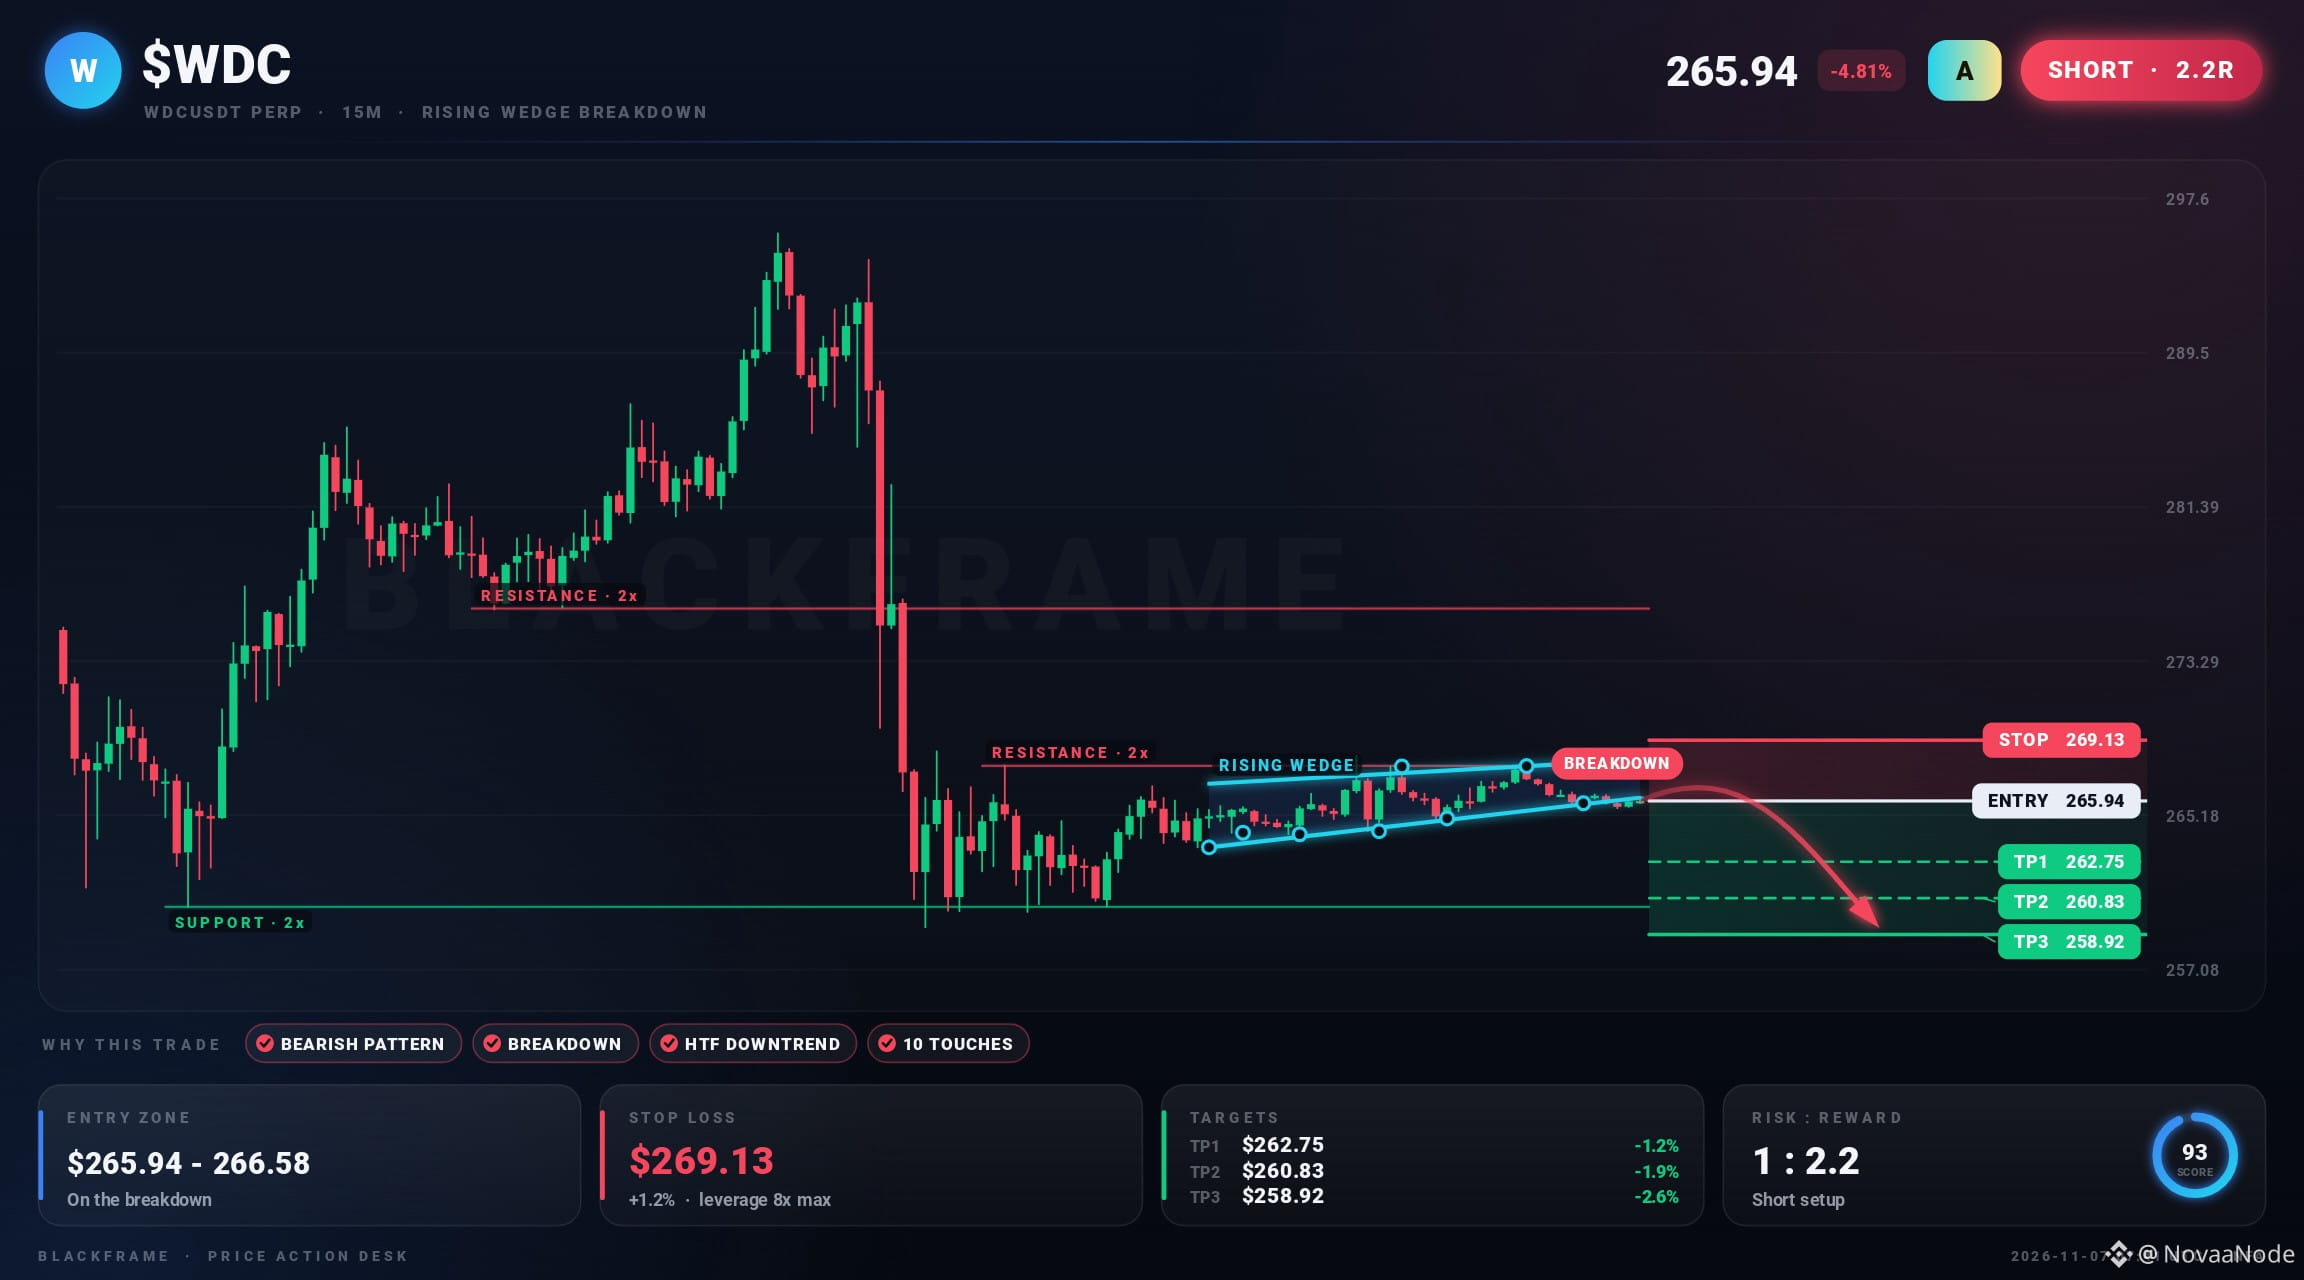
🧊 $WDC support just gave way
SHORT · 15M
Entry: $265.94 - $266.74
TP1: $262.75
TP2: $260.83
TP3: $258.92
SL: $269.13
A rising wedge has formed on the 15M, tested 10 times on its lines. Price broke down below the pattern and is holding. The higher timeframe trend agrees, and the target is the measured move of the pattern.
#WDC #Crypto #Binance · NFA
🧊 $WDC support just gave way
SHORT · 15M
Entry: $265.94 - $266.74
TP1: $262.75
TP2: $260.83
TP3: $258.92
SL: $269.13
A rising wedge has formed on the 15M, tested 10 times on its lines. Price broke down below the pattern and is holding. The higher timeframe trend agrees, and the target is the measured move of the pattern.
#WDC #Crypto #Binance · NFA
SHORT · 15M
Entry: $265.94 - $266.74
TP1: $262.75
TP2: $260.83
TP3: $258.92
SL: $269.13
A rising wedge has formed on the 15M, tested 10 times on its lines. Price broke down below the pattern and is holding. The higher timeframe trend agrees, and the target is the measured move of the pattern.
#WDC #Crypto #Binance · NFA
1

·
--
🚨 $WDC HOLDING THE DEMAND ZONE AS BUYERS PREPARE TO RECLAIM THE 470 TRIGGER! ⚡
Entry: 460 - 463 ⚡
Target: 470 / 480 / 490 🚀
Stop Loss: 452 ⚠️
📌 Smart money is quietly absorbing sell pressure right at the 455–460 demand floor following a heavy 4-hour pullback. 🔍 Green candles are creeping back into the structure, but the true momentum wave starts once bulls flip 470 back into support.
💡 If buyers clear that key resistance pivot, expect a swift expansion toward 480 and 490 as shorts get squeezed out. 🌊 Keep an eye on high-beta pairs like $TUT and $TRUMP as broad momentum starts shifting. 💬 Are you front-running this reclaim at the floor or waiting for 470 confirmation? 👇
⚠️ Not financial advice. Always manage your risk. 🛡️
🏷️ #WDC #Crypto #Breakout #TradeSetup #Altcoins
🎯 ⚡
🚨 $WDC HOLDING THE DEMAND ZONE AS BUYERS PREPARE TO RECLAIM THE 470 TRIGGER! ⚡
Entry: 460 - 463 ⚡
Target: 470 / 480 / 490 🚀
Stop Loss: 452 ⚠️
📌 Smart money is quietly absorbing sell pressure right at the 455–460 demand floor following a heavy 4-hour pullback. 🔍 Green candles are creeping back into the structure, but the true momentum wave starts once bulls flip 470 back into support.
💡 If buyers clear that key resistance pivot, expect a swift expansion toward 480 and 490 as shorts get squeezed out. 🌊 Keep an eye on high-beta pairs like $TUT and $TRUMP as broad momentum starts shifting. 💬 Are you front-running this reclaim at the floor or waiting for 470 confirmation? 👇
⚠️ Not financial advice. Always manage your risk. 🛡️
🏷️ #WDC #Crypto #Breakout #TradeSetup #Altcoins
🎯 ⚡
Entry: 460 - 463 ⚡
Target: 470 / 480 / 490 🚀
Stop Loss: 452 ⚠️
📌 Smart money is quietly absorbing sell pressure right at the 455–460 demand floor following a heavy 4-hour pullback. 🔍 Green candles are creeping back into the structure, but the true momentum wave starts once bulls flip 470 back into support.
💡 If buyers clear that key resistance pivot, expect a swift expansion toward 480 and 490 as shorts get squeezed out. 🌊 Keep an eye on high-beta pairs like $TUT and $TRUMP as broad momentum starts shifting. 💬 Are you front-running this reclaim at the floor or waiting for 470 confirmation? 👇
⚠️ Not financial advice. Always manage your risk. 🛡️
🏷️ #WDC #Crypto #Breakout #TradeSetup #Altcoins
🎯 ⚡
12
·
--
🚨 $WDC EXHAUSTS BOUNCE MOMENTUM WHILE BEARS ABSORB EVERY ATTEMPT TO RECLAIM HIGHER! 📉
Entry: 456.34 - 457.52 ⚡
Target: 449.75 - 437.80 🎯
Stop Loss: 466.50 ⚠️
While the daily structure remains locked in a range, higher timeframe momentum on the 4H chart is pressing down relentlessly. 📊 The short-term RSI cooling down to 33 confirms buyers lack the firepower to sustain any meaningful bounce attempt.
📌 The path of least resistance points straight toward lower liquidity zones while sellers maintain complete control at the 456.93 pivot. 🔍 With immediate downside momentum building, this high-conviction setup favors riding the prevailing trend rather than fighting seller control. 🤔 When price taps that first target at 449.75, do you secure profits or let the position run toward lower support levels? 👇
⚠️ Not financial advice. Always manage your risk. 🛡️
🏷️ #WDC #ShortSetup #CryptoTrading #Bearish #Breakdown
📉 🐻
🚨 $WDC EXHAUSTS BOUNCE MOMENTUM WHILE BEARS ABSORB EVERY ATTEMPT TO RECLAIM HIGHER! 📉
Entry: 456.34 - 457.52 ⚡
Target: 449.75 - 437.80 🎯
Stop Loss: 466.50 ⚠️
While the daily structure remains locked in a range, higher timeframe momentum on the 4H chart is pressing down relentlessly. 📊 The short-term RSI cooling down to 33 confirms buyers lack the firepower to sustain any meaningful bounce attempt.
📌 The path of least resistance points straight toward lower liquidity zones while sellers maintain complete control at the 456.93 pivot. 🔍 With immediate downside momentum building, this high-conviction setup favors riding the prevailing trend rather than fighting seller control. 🤔 When price taps that first target at 449.75, do you secure profits or let the position run toward lower support levels? 👇
⚠️ Not financial advice. Always manage your risk. 🛡️
🏷️ #WDC #ShortSetup #CryptoTrading #Bearish #Breakdown
📉 🐻
Entry: 456.34 - 457.52 ⚡
Target: 449.75 - 437.80 🎯
Stop Loss: 466.50 ⚠️
While the daily structure remains locked in a range, higher timeframe momentum on the 4H chart is pressing down relentlessly. 📊 The short-term RSI cooling down to 33 confirms buyers lack the firepower to sustain any meaningful bounce attempt.
📌 The path of least resistance points straight toward lower liquidity zones while sellers maintain complete control at the 456.93 pivot. 🔍 With immediate downside momentum building, this high-conviction setup favors riding the prevailing trend rather than fighting seller control. 🤔 When price taps that first target at 449.75, do you secure profits or let the position run toward lower support levels? 👇
⚠️ Not financial advice. Always manage your risk. 🛡️
🏷️ #WDC #ShortSetup #CryptoTrading #Bearish #Breakdown
📉 🐻
27

·
--
🔻 $WDC SHORT 🔻
Entry: 259.36 – 260.92
SL: 271.22
TP1: 250.64
TP2: 244.31
TP3: 236.39
📈 Technical Outlook:
$WDC is showing bearish pressure after losing strength near a key technical zone. The setup is supported by EMA trend is bearish, price is breaking below recent support, RSI supports bearish momentum. As long as price stays below the entry area, sellers may continue pushing toward the listed downside targets.
#WDC #Crypto #BinanceSquare #Trading
🔻 $WDC SHORT 🔻
Entry: 259.36 – 260.92
SL: 271.22
TP1: 250.64
TP2: 244.31
TP3: 236.39
📈 Technical Outlook:
$WDC is showing bearish pressure after losing strength near a key technical zone. The setup is supported by EMA trend is bearish, price is breaking below recent support, RSI supports bearish momentum. As long as price stays below the entry area, sellers may continue pushing toward the listed downside targets.
#WDC #Crypto #BinanceSquare #Trading
Entry: 259.36 – 260.92
SL: 271.22
TP1: 250.64
TP2: 244.31
TP3: 236.39
📈 Technical Outlook:
$WDC is showing bearish pressure after losing strength near a key technical zone. The setup is supported by EMA trend is bearish, price is breaking below recent support, RSI supports bearish momentum. As long as price stays below the entry area, sellers may continue pushing toward the listed downside targets.
#WDC #Crypto #BinanceSquare #Trading

6

$WDC RSI TRAP IS BAITING RETAIL WHILE THE 4H TREND SCRAPES SUPPORT 📉 💣
Entry: 449.27 - 450.51 🔻
Target: 427.60 🎯
Stop Loss: 461.04 ⚠️
Amateurs are staring at the 15-minute RSI calling for a bounce, but higher timeframe order flow tells a brutal story. 📊 $WDC is grinding right against support around 449.89 while volatility compresses for an explosive continuation downward.
When intraday momentum aligns with a macro downtrend regime, oversold readings are merely fuel for the next leg lower. ⚡ Smart money isn't buying this fake stability—they are positioning for a swift liquidity sweep toward lower targets. 💬 Are you shorting this structural breakdown or caught buying the oversold reflex bounce? 👇
⚠️ Not financial advice. Always manage your risk. 🛡️
🏷️ #WDC #ShortSetup #Bearish #Trading #Crypto
📉 🩸
$WDC RSI TRAP IS BAITING RETAIL WHILE THE 4H TREND SCRAPES SUPPORT 📉 💣
Entry: 449.27 - 450.51 🔻
Target: 427.60 🎯
Stop Loss: 461.04 ⚠️
Amateurs are staring at the 15-minute RSI calling for a bounce, but higher timeframe order flow tells a brutal story. 📊 $WDC is grinding right against support around 449.89 while volatility compresses for an explosive continuation downward.
When intraday momentum aligns with a macro downtrend regime, oversold readings are merely fuel for the next leg lower. ⚡ Smart money isn't buying this fake stability—they are positioning for a swift liquidity sweep toward lower targets. 💬 Are you shorting this structural breakdown or caught buying the oversold reflex bounce? 👇
⚠️ Not financial advice. Always manage your risk. 🛡️
🏷️ #WDC #ShortSetup #Bearish #Trading #Crypto
📉 🩸
Entry: 449.27 - 450.51 🔻
Target: 427.60 🎯
Stop Loss: 461.04 ⚠️
Amateurs are staring at the 15-minute RSI calling for a bounce, but higher timeframe order flow tells a brutal story. 📊 $WDC is grinding right against support around 449.89 while volatility compresses for an explosive continuation downward.
When intraday momentum aligns with a macro downtrend regime, oversold readings are merely fuel for the next leg lower. ⚡ Smart money isn't buying this fake stability—they are positioning for a swift liquidity sweep toward lower targets. 💬 Are you shorting this structural breakdown or caught buying the oversold reflex bounce? 👇
⚠️ Not financial advice. Always manage your risk. 🛡️
🏷️ #WDC #ShortSetup #Bearish #Trading #Crypto
📉 🩸
9
🚨 $WDC 4H TIMEFRAME FLIPS BEARISH AS SELLER MOMENTUM TAKES TOTAL CONTROL! 📉
Entry: 449.03 - 450.24 ⚡
Target: 441.21 🚀
Stop Loss: 460.86 ⚠️
While the daily chart hangs in a range, the 4H timeframe just established a decisive short trend with high-conviction order flow. 📊 Sellers are aggressively driving early momentum with 15m RSI sinking toward 36.2, leaving counter-trend buyers completely exhausted.
💡 Volatility room allows price to ride downward without immediate squeeze risk while bears defend the upper supply boundary. 📌 Risk remains tightly controlled against structural resistance as downside targets open up cleanly toward 435.60. 💬 Do you expect an instant breakdown into TP2 or a brief fakeout first? 👇
⚠️ Not financial advice. Always manage your risk. 🛡️
🏷️ #WDC #ShortSetup #CryptoTrading #Bearish
📉 🐻
🚨 $WDC 4H TIMEFRAME FLIPS BEARISH AS SELLER MOMENTUM TAKES TOTAL CONTROL! 📉
Entry: 449.03 - 450.24 ⚡
Target: 441.21 🚀
Stop Loss: 460.86 ⚠️
While the daily chart hangs in a range, the 4H timeframe just established a decisive short trend with high-conviction order flow. 📊 Sellers are aggressively driving early momentum with 15m RSI sinking toward 36.2, leaving counter-trend buyers completely exhausted.
💡 Volatility room allows price to ride downward without immediate squeeze risk while bears defend the upper supply boundary. 📌 Risk remains tightly controlled against structural resistance as downside targets open up cleanly toward 435.60. 💬 Do you expect an instant breakdown into TP2 or a brief fakeout first? 👇
⚠️ Not financial advice. Always manage your risk. 🛡️
🏷️ #WDC #ShortSetup #CryptoTrading #Bearish
📉 🐻
Entry: 449.03 - 450.24 ⚡
Target: 441.21 🚀
Stop Loss: 460.86 ⚠️
While the daily chart hangs in a range, the 4H timeframe just established a decisive short trend with high-conviction order flow. 📊 Sellers are aggressively driving early momentum with 15m RSI sinking toward 36.2, leaving counter-trend buyers completely exhausted.
💡 Volatility room allows price to ride downward without immediate squeeze risk while bears defend the upper supply boundary. 📌 Risk remains tightly controlled against structural resistance as downside targets open up cleanly toward 435.60. 💬 Do you expect an instant breakdown into TP2 or a brief fakeout first? 👇
⚠️ Not financial advice. Always manage your risk. 🛡️
🏷️ #WDC #ShortSetup #CryptoTrading #Bearish
📉 🐻
9
Log in to explore more content
Join global crypto users on Binance Square
⚡️ Get latest and useful information about crypto.
💬 Trusted by the world’s largest crypto exchange.
👍 Discover real insights from verified creators.
Email / Phone number
Trending Topics
1
#A Packed Week of Earnings and Data Tests Markets
16,074 views
155 Discussing
2
#AnthropicIPOTestsInvestorAppetiteForAI
11,531 views
312 Discussing
3
#HuangReportedlyConsidersReturnToNvidia
32,586 views
499 Discussing
4
#CryptoSelloffTriggersMultipleWhaleLiquidations
319,455 views
2,537 Discussing
5
#BitcoinSpotETFsPost$1.065BOutflowsForThirdStraightWeek
3,729 views
79 Discussing
6
#About64000BitcoinMiningMachinesReportedlyHijacked
28,251 views
342 Discussing
7
#USSpotXRPETFsSeeLargestWeeklyOutflowIn8Months
245,800 views
1,953 Discussing
8
#WillFOMCMinutesReinforceRateHikeExpectations?
93,208 views
994 Discussing
9
#BitcoinActiveSupplyInProfitDropsBelow45%
321,145 views
2,161 Discussing
10
#KavaSaysAbnormalActivityLimitedToKavaLend
209,554 views
1,209 Discussing