
#nearprotocol
nearprotocol
1.8M views
5,708 Discussing
Hot
Latest

·
--
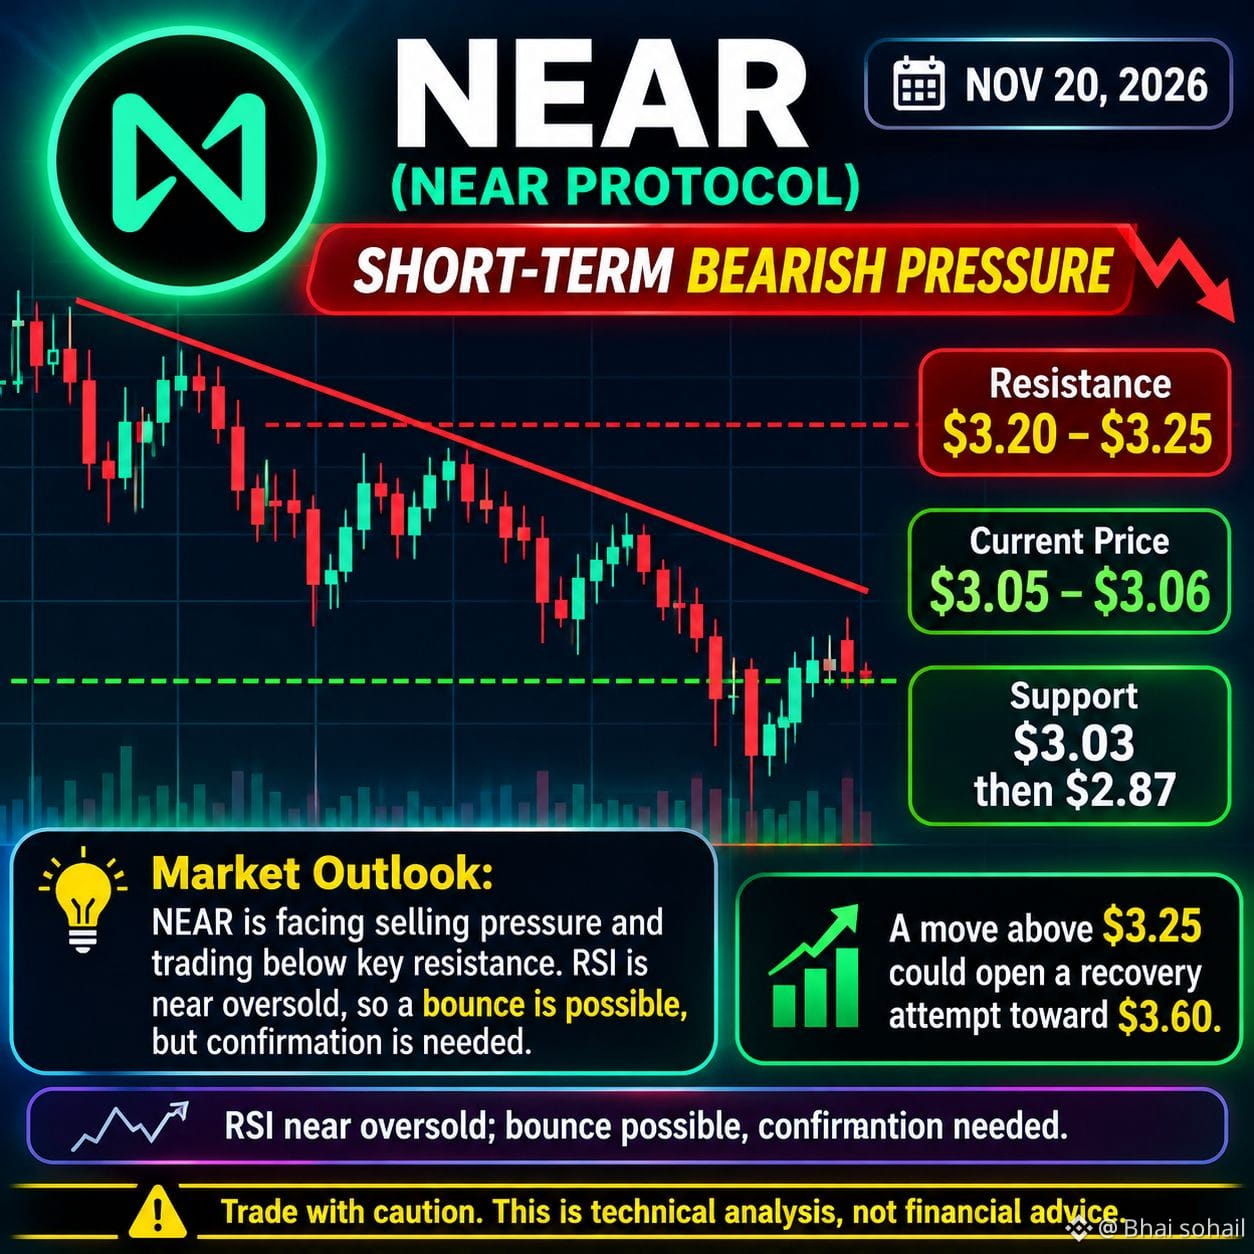
$NEAR Current price: Around $3.05–$3.06
Market outlook: NEAR is facing strong selling pressure. RSI is near oversold territory, which could lead to a short-term bounce, but buyers need stronger volume to confirm recovery.
Key levels:
Support: $3.03, then $2.87
Resistance: $3.20–$3.25
Bullish target: $3.60
Bearish signal: Breakdown below $3.03.
Trading view: Cautious approach. Wait for confirmation before entering a trade. I'm not a financial advisor.
#NEAR #NEARProtocol
#13FInstitutionsBitcoinSpotETPHoldingsHitRecord #NvidiaBoardReportedlySplitOverHuang’sReturn #MASToUpgradeSGDTestnetToSGDigitalLedger
{spot}(NEARUSDT)
$NEAR Current price: Around $3.05–$3.06
Market outlook: NEAR is facing strong selling pressure. RSI is near oversold territory, which could lead to a short-term bounce, but buyers need stronger volume to confirm recovery.
Key levels:
Support: $3.03, then $2.87
Resistance: $3.20–$3.25
Bullish target: $3.60
Bearish signal: Breakdown below $3.03.
Trading view: Cautious approach. Wait for confirmation before entering a trade. I'm not a financial advisor.
#NEAR #NEARProtocol
#13FInstitutionsBitcoinSpotETPHoldingsHitRecord #NvidiaBoardReportedlySplitOverHuang’sReturn #MASToUpgradeSGDTestnetToSGDigitalLedger
Market outlook: NEAR is facing strong selling pressure. RSI is near oversold territory, which could lead to a short-term bounce, but buyers need stronger volume to confirm recovery.
Key levels:
Support: $3.03, then $2.87
Resistance: $3.20–$3.25
Bullish target: $3.60
Bearish signal: Breakdown below $3.03.
Trading view: Cautious approach. Wait for confirmation before entering a trade. I'm not a financial advisor.
#NEAR #NEARProtocol
#13FInstitutionsBitcoinSpotETPHoldingsHitRecord #NvidiaBoardReportedlySplitOverHuang’sReturn #MASToUpgradeSGDTestnetToSGDigitalLedger
697

·
--
$NEAR is under pressure in the current window.
Price: ~$3.04 | 24h: -10.9% | 1h: mild | Volume: ~$527M | Liquidations: specific recent figures not available from public aggregate sources
NEAR Protocol has seen a clear daily pullback while volume remains elevated, pointing to active repositioning rather than thin trading.
The move sits within a broader rotation across higher-beta names. Context remains short-term and volume-supported.
#Avi #NEARProtocol #Crypto
Tracking with Avi on Binance Square.
#FH7294227B
$NEAR is under pressure in the current window.
Price: ~$3.04 | 24h: -10.9% | 1h: mild | Volume: ~$527M | Liquidations: specific recent figures not available from public aggregate sources
NEAR Protocol has seen a clear daily pullback while volume remains elevated, pointing to active repositioning rather than thin trading.
The move sits within a broader rotation across higher-beta names. Context remains short-term and volume-supported.
#Avi #NEARProtocol #Crypto
Tracking with Avi on Binance Square.
#FH7294227B
Price: ~$3.04 | 24h: -10.9% | 1h: mild | Volume: ~$527M | Liquidations: specific recent figures not available from public aggregate sources
NEAR Protocol has seen a clear daily pullback while volume remains elevated, pointing to active repositioning rather than thin trading.
The move sits within a broader rotation across higher-beta names. Context remains short-term and volume-supported.
#Avi #NEARProtocol #Crypto
Tracking with Avi on Binance Square.
#FH7294227B
149

·
--
Bullish
Verified
🚀 $NEAR
A NEW POSITIVE UPDATE FOR NEAR PROTOCOL!
NEAR Protocol is getting attention after an important decision that could support its future growth.
🔥 What's Happening?
📈 NEAR recently moved up to around $3.38.
💰 The network approved a plan to reduce annual token supply from 2.5% to 1.6%.
🌐 NEAR is also expanding its cross-chain technology.
🤝 A new integration with Talos is bringing NEAR Intents to institutional users.
What's Next?
Lower token supply could be positive for long-term holders, but market conditions and network adoption remain important.
👀 Can $NEAR continue its recovery?
#NEAR #nearprotocol #CryptoNews #altcoins #CryptoMarket
{future}(NEARUSDT)
🚀 $NEAR
A NEW POSITIVE UPDATE FOR NEAR PROTOCOL!
NEAR Protocol is getting attention after an important decision that could support its future growth.
🔥 What's Happening?
📈 NEAR recently moved up to around $3.38.
💰 The network approved a plan to reduce annual token supply from 2.5% to 1.6%.
🌐 NEAR is also expanding its cross-chain technology.
🤝 A new integration with Talos is bringing NEAR Intents to institutional users.
What's Next?
Lower token supply could be positive for long-term holders, but market conditions and network adoption remain important.
👀 Can $NEAR continue its recovery?
#NEAR #nearprotocol #CryptoNews #altcoins #CryptoMarket
A NEW POSITIVE UPDATE FOR NEAR PROTOCOL!
NEAR Protocol is getting attention after an important decision that could support its future growth.
🔥 What's Happening?
📈 NEAR recently moved up to around $3.38.
💰 The network approved a plan to reduce annual token supply from 2.5% to 1.6%.
🌐 NEAR is also expanding its cross-chain technology.
🤝 A new integration with Talos is bringing NEAR Intents to institutional users.
What's Next?
Lower token supply could be positive for long-term holders, but market conditions and network adoption remain important.
👀 Can $NEAR continue its recovery?
#NEAR #nearprotocol #CryptoNews #altcoins #CryptoMarket
1.3k

·
--
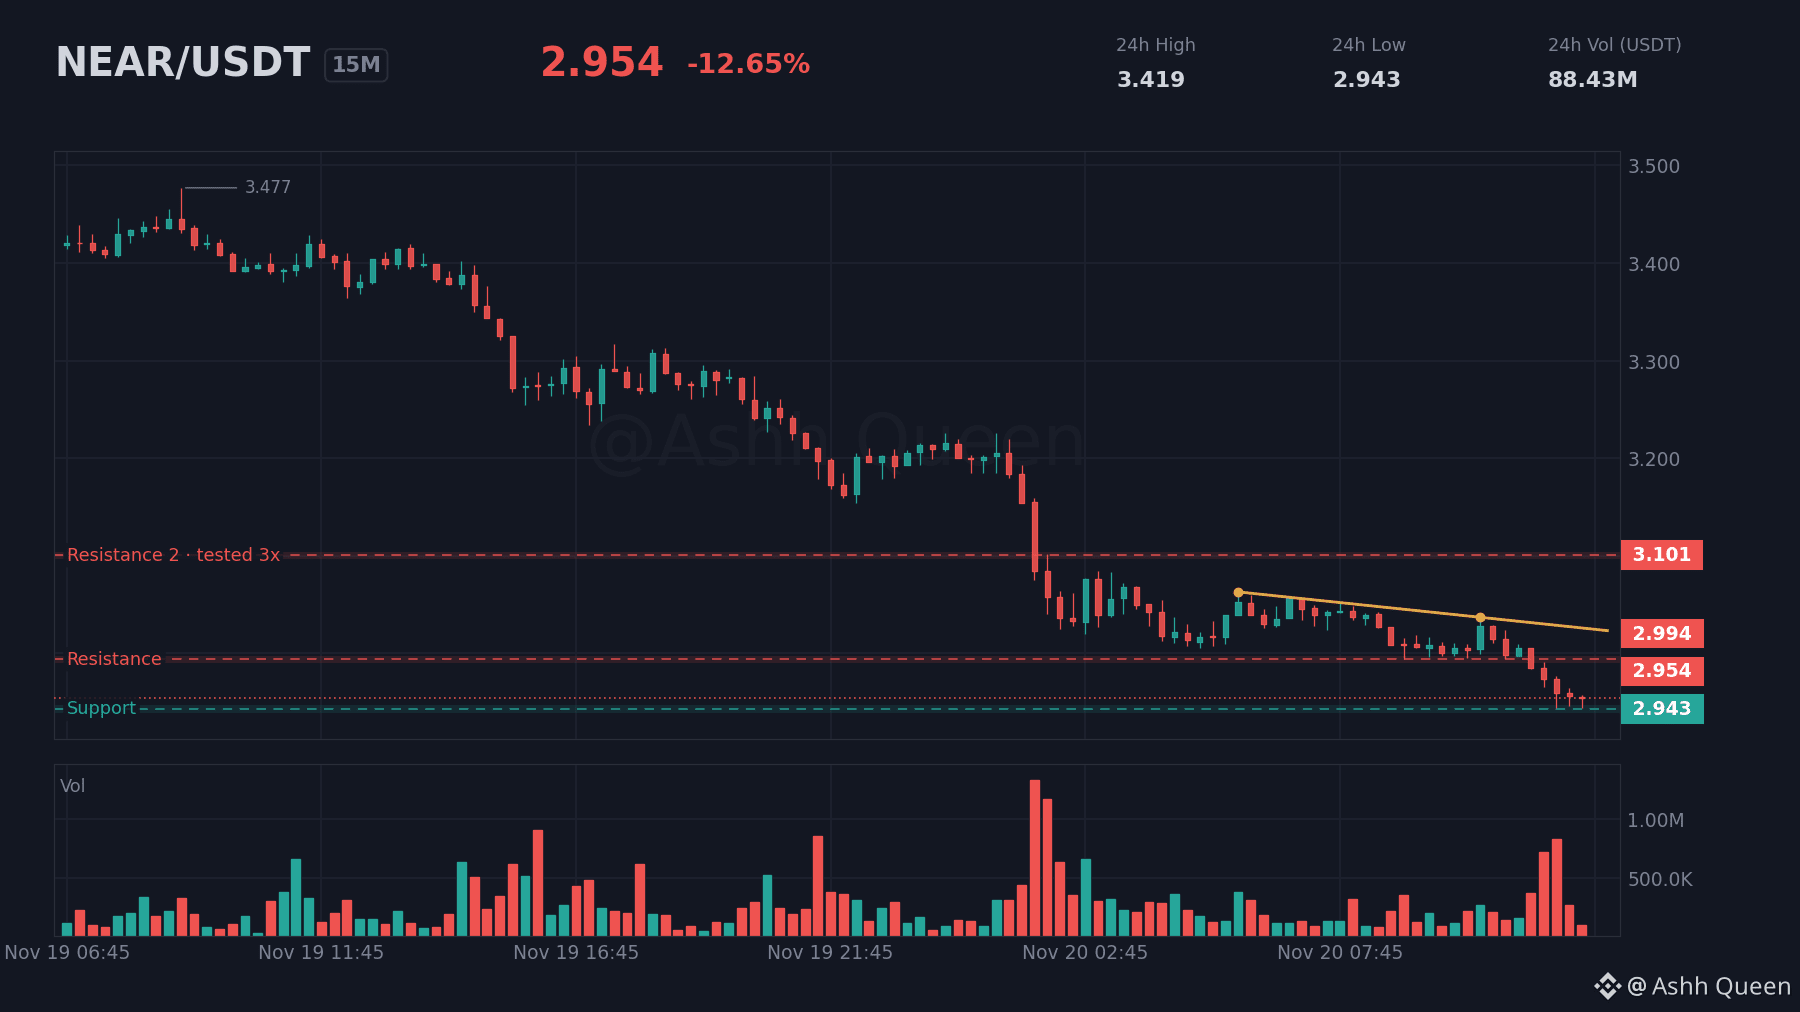
The bearish pressure on $NEAR is mounting on the 15m chart. 🧐
- Next resistance at 3.101
- Resistance at 2.994
- Price now at 2.954
- Support at 2.943
Price is sitting well below the EMA50 (3.054) and VWAP. The momentum clearly favors the downside here. ⚠️
Which level are you watching to see if support holds?
#NEAR #NEARProtocol #CryptoAnalysis #MarketUpdate
Not financial advice. Markets are volatile, so use stop-losses and only risk what you can afford to lose.
The bearish pressure on $NEAR is mounting on the 15m chart. 🧐
- Next resistance at 3.101
- Resistance at 2.994
- Price now at 2.954
- Support at 2.943
Price is sitting well below the EMA50 (3.054) and VWAP. The momentum clearly favors the downside here. ⚠️
Which level are you watching to see if support holds?
#NEAR #NEARProtocol #CryptoAnalysis #MarketUpdate
Not financial advice. Markets are volatile, so use stop-losses and only risk what you can afford to lose.
- Next resistance at 3.101
- Resistance at 2.994
- Price now at 2.954
- Support at 2.943
Price is sitting well below the EMA50 (3.054) and VWAP. The momentum clearly favors the downside here. ⚠️
Which level are you watching to see if support holds?
#NEAR #NEARProtocol #CryptoAnalysis #MarketUpdate
Not financial advice. Markets are volatile, so use stop-losses and only risk what you can afford to lose.
6
·
--
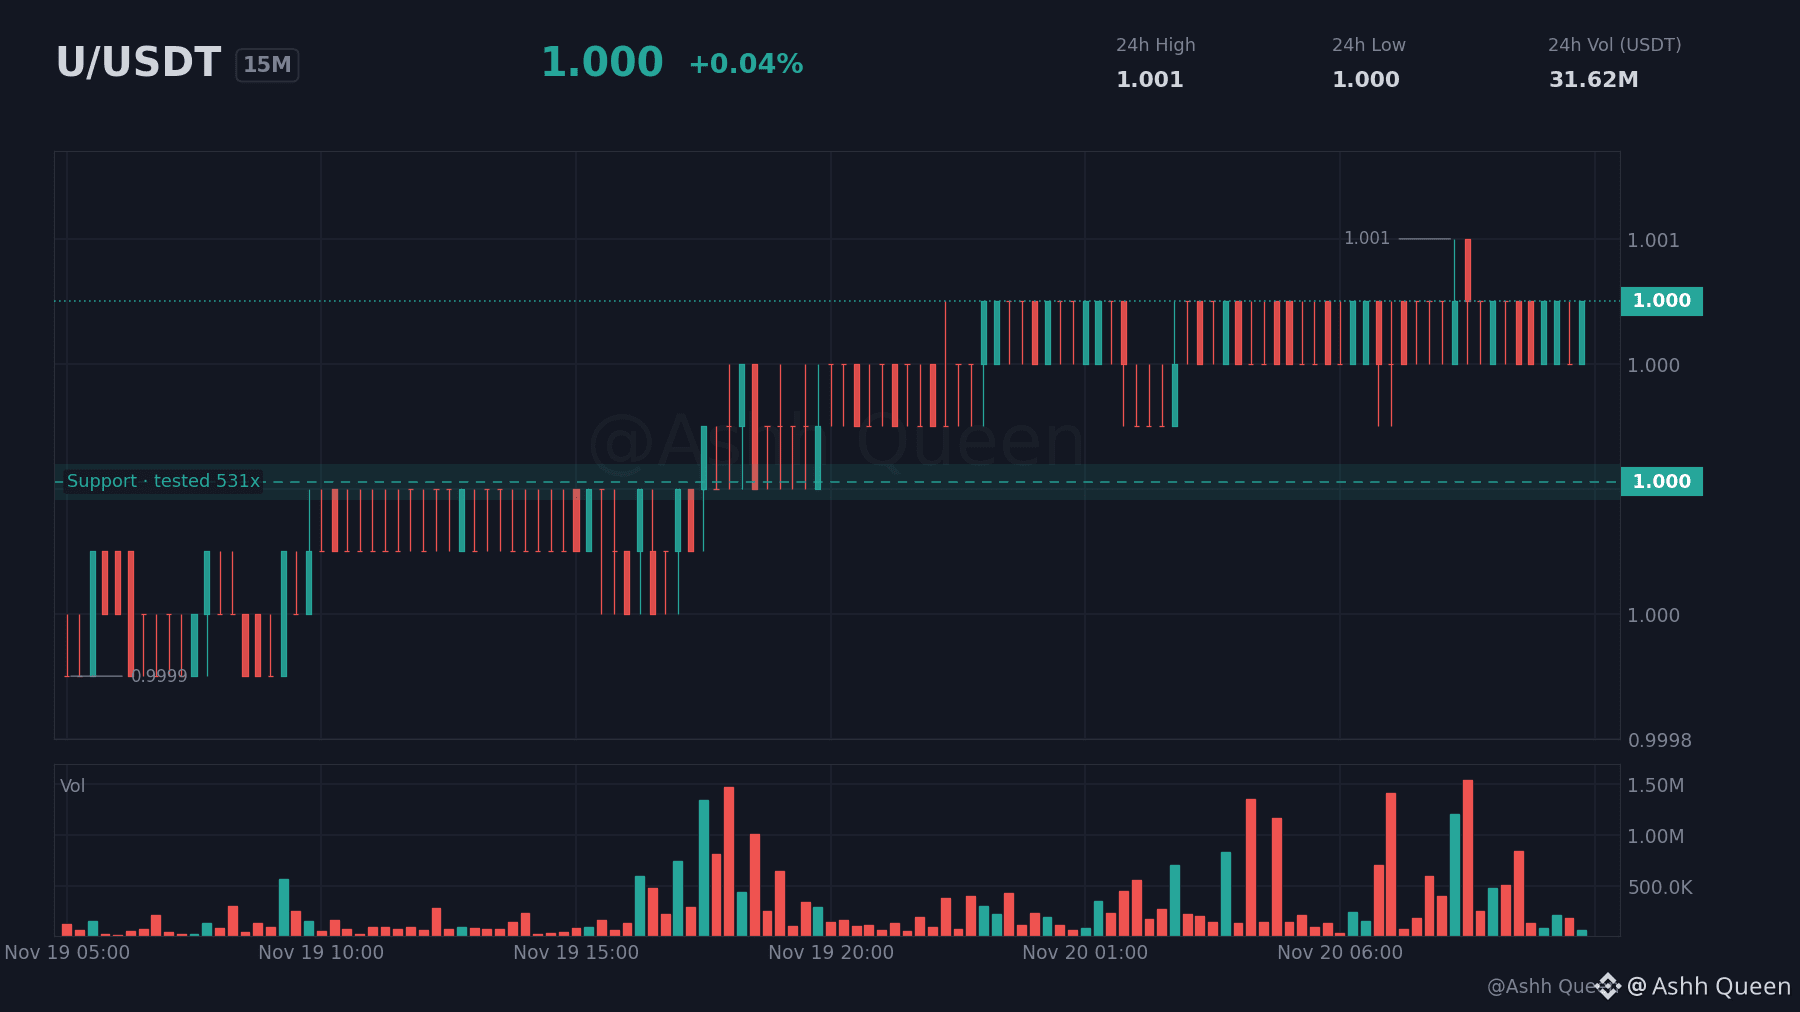
Can $U or $NEAR win the next leg? ⚔️
$U stays steady above VWAP at 1.000 but lacks momentum. Meanwhile, $NEAR struggles below resistance at 3.119 with a +11.42% performance lag. 🐂
I am watching if $U holds support at 1.000 or if $NEAR stays stuck. 🐻
Do you trade this on the short or longer timeframe?
#U #NEAR #NEARProtocol #MarketUpdate
This is analysis, not a recommendation. Manage risk first, profit second.
Can $U or $NEAR win the next leg? ⚔️
$U stays steady above VWAP at 1.000 but lacks momentum. Meanwhile, $NEAR struggles below resistance at 3.119 with a +11.42% performance lag. 🐂
I am watching if $U holds support at 1.000 or if $NEAR stays stuck. 🐻
Do you trade this on the short or longer timeframe?
#U #NEAR #NEARProtocol #MarketUpdate
This is analysis, not a recommendation. Manage risk first, profit second.
$U stays steady above VWAP at 1.000 but lacks momentum. Meanwhile, $NEAR struggles below resistance at 3.119 with a +11.42% performance lag. 🐂
I am watching if $U holds support at 1.000 or if $NEAR stays stuck. 🐻
Do you trade this on the short or longer timeframe?
#U #NEAR #NEARProtocol #MarketUpdate
This is analysis, not a recommendation. Manage risk first, profit second.
2
·
--
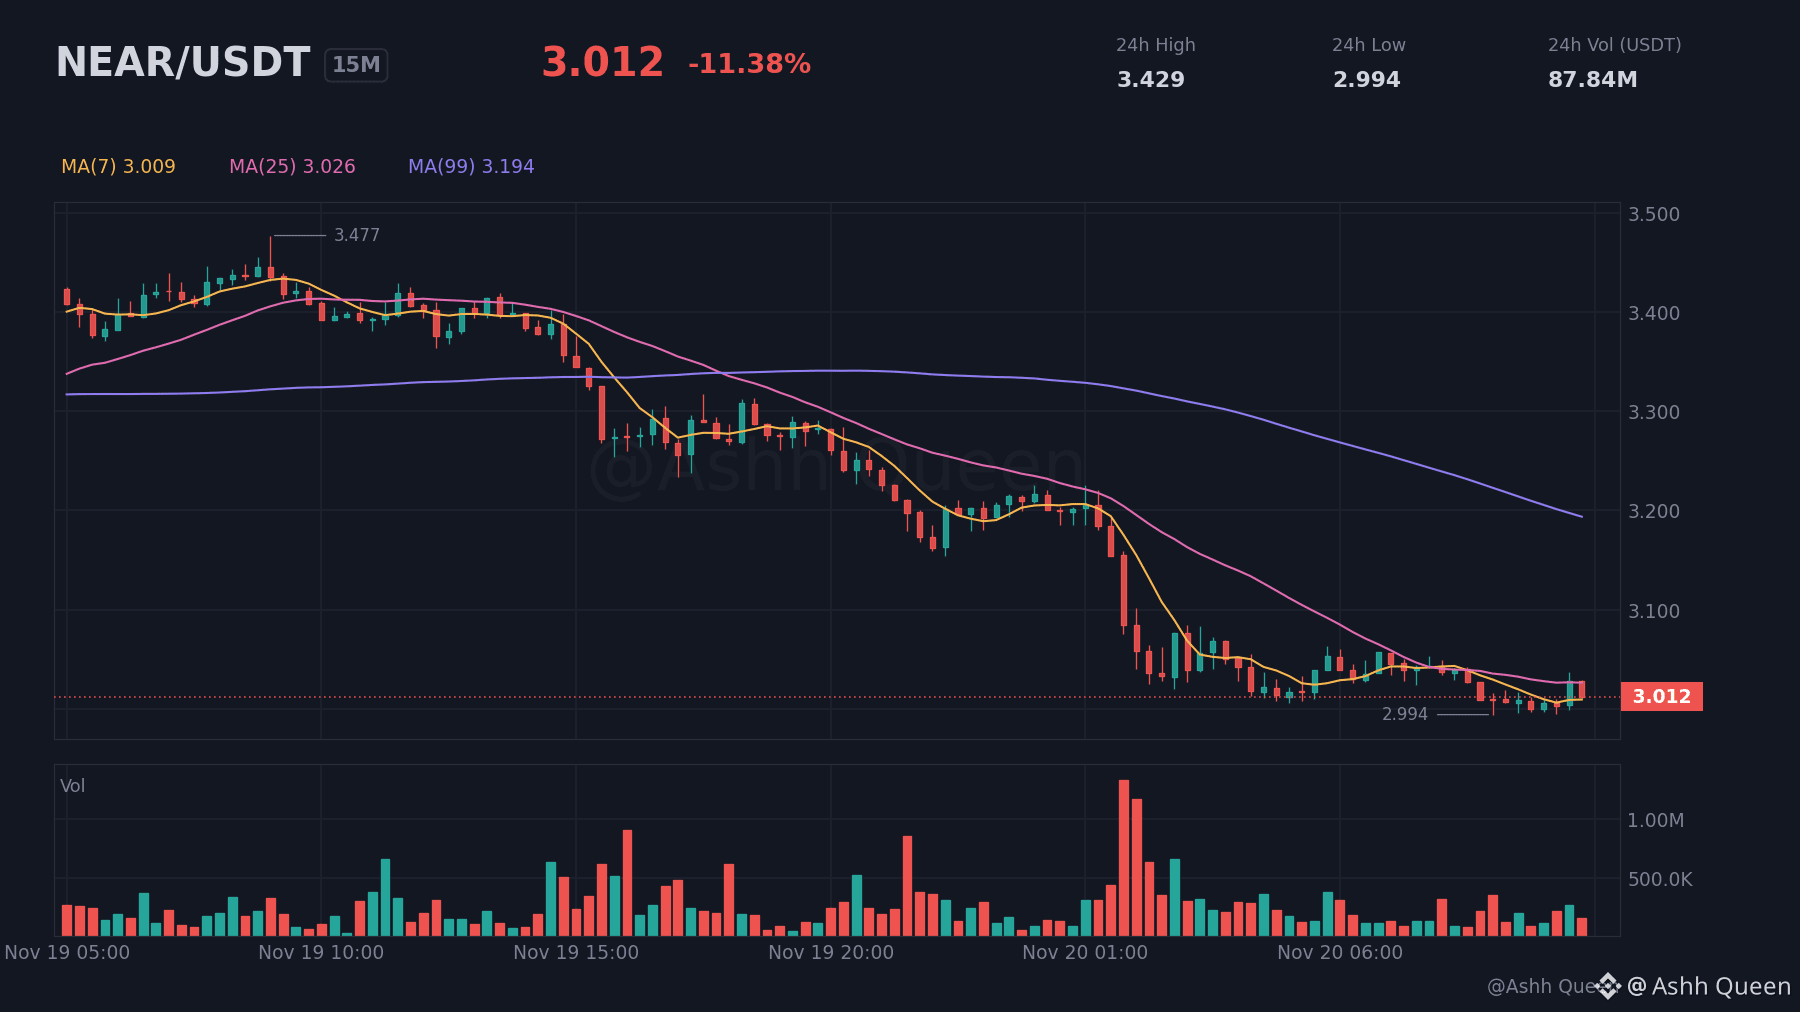
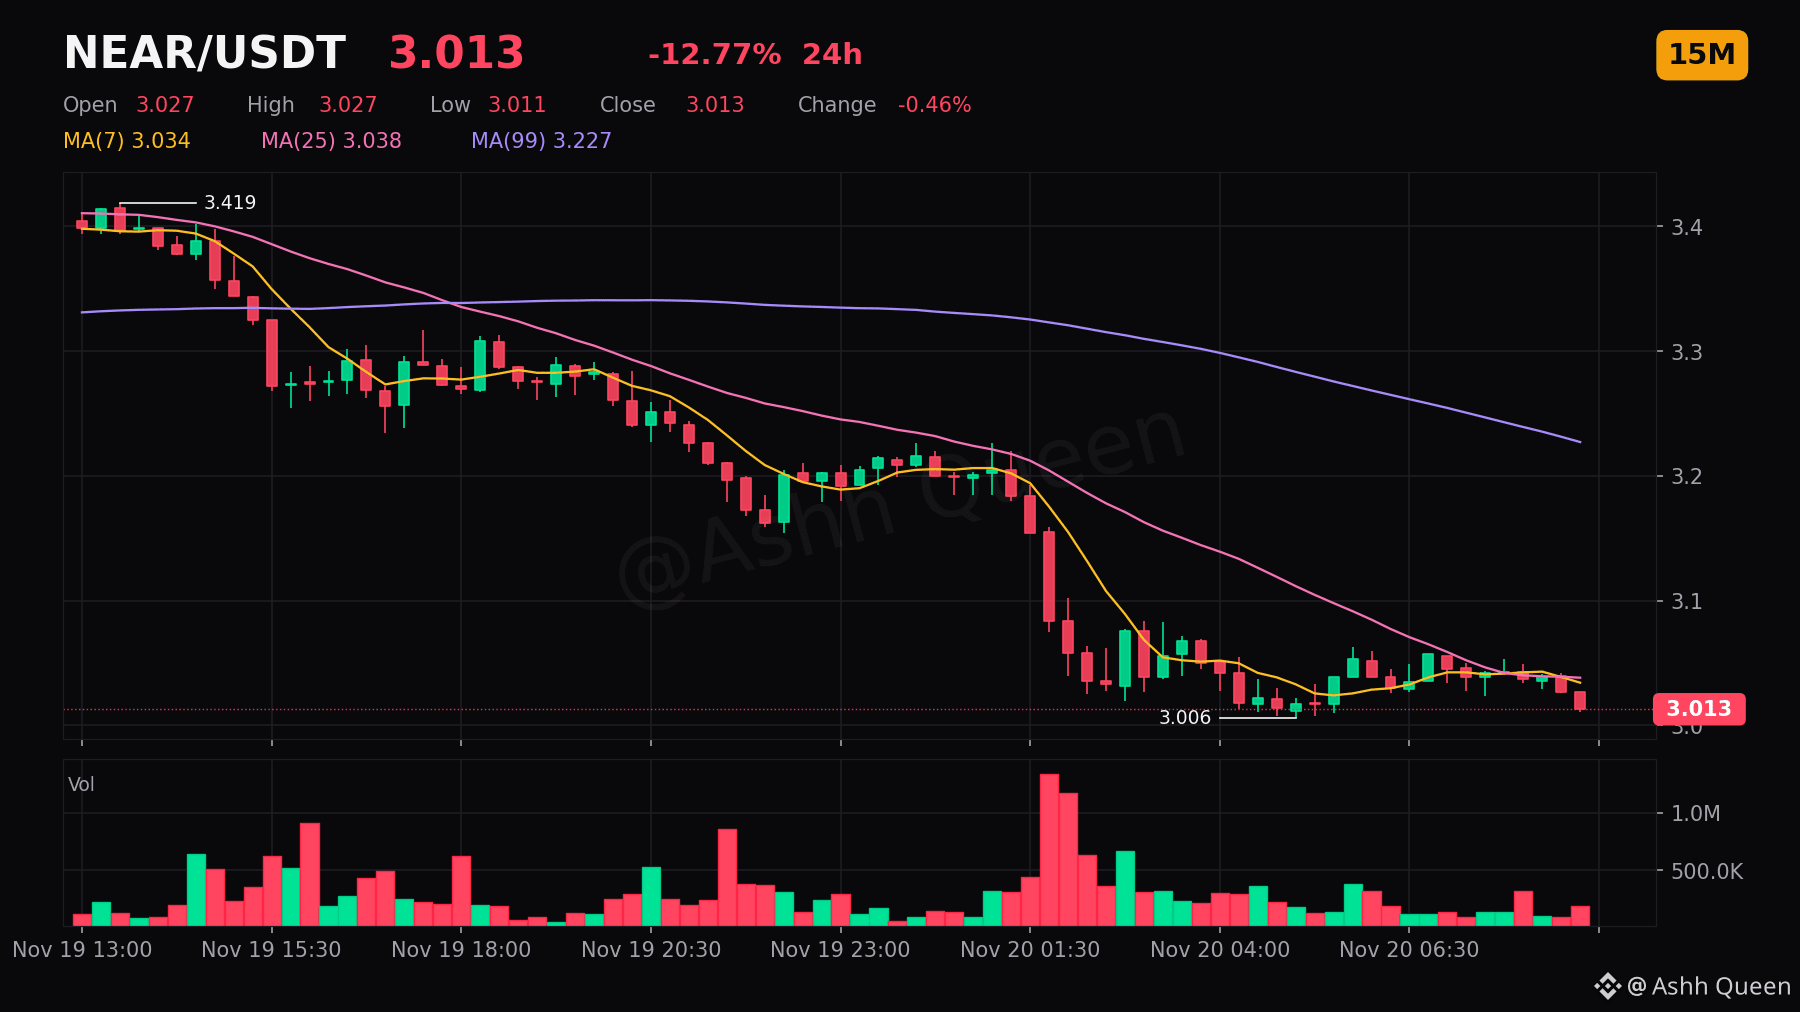
Many expect a bounce on $NEAR, but the data tells a cooling story.
Price at 3.012 remains below VWAP at 3.074 and EMA50 at 3.105, signaling persistent weakness. Even with a positive MACD, the RSI at 34.72 shows no oversold urgency. ⚔️
Think of EMA50 at 3.105 as a ceiling; until price reclaims it, downside risk remains toward SUPPORT at 2.971. 🐻
Do you see this as a temporary consolidation or a deeper trend reversal?
#NEAR #NEARProtocol #Altcoins
Not financial advice. Markets are volatile, so use stop-losses and only risk what you can afford to lose.
Many expect a bounce on $NEAR , but the data tells a cooling story.
Price at 3.012 remains below VWAP at 3.074 and EMA50 at 3.105, signaling persistent weakness. Even with a positive MACD, the RSI at 34.72 shows no oversold urgency. ⚔️
Think of EMA50 at 3.105 as a ceiling; until price reclaims it, downside risk remains toward SUPPORT at 2.971. 🐻
Do you see this as a temporary consolidation or a deeper trend reversal?
#NEAR #NEARProtocol #Altcoins
Not financial advice. Markets are volatile, so use stop-losses and only risk what you can afford to lose.
Price at 3.012 remains below VWAP at 3.074 and EMA50 at 3.105, signaling persistent weakness. Even with a positive MACD, the RSI at 34.72 shows no oversold urgency. ⚔️
Think of EMA50 at 3.105 as a ceiling; until price reclaims it, downside risk remains toward SUPPORT at 2.971. 🐻
Do you see this as a temporary consolidation or a deeper trend reversal?
#NEAR #NEARProtocol #Altcoins
Not financial advice. Markets are volatile, so use stop-losses and only risk what you can afford to lose.
8

·
--
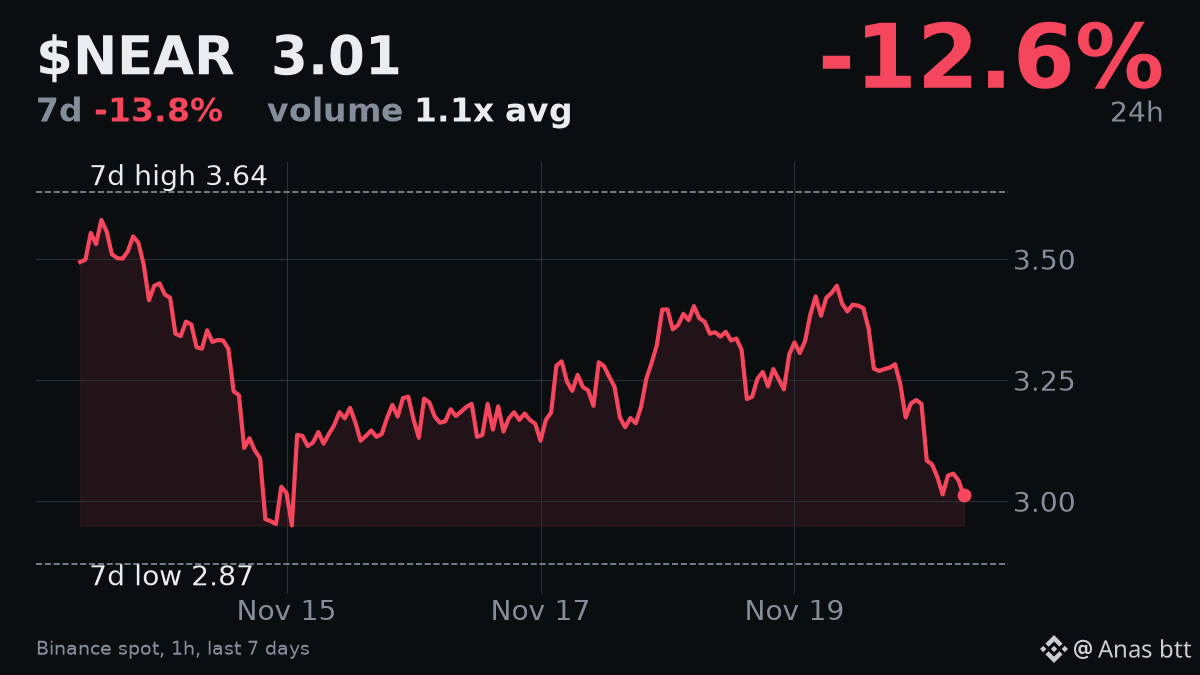
$NEAR is down 12.594% today, currently at $3.012. This movement comes as Cointelegraph reports record outflows from BlackRock’s IBIT ETF, leading to a broader market dip.
The overall market is showing 'Extreme Fear' with the index at 12. $NEAR has also declined 13.795% over the past seven days, hitting an RSI of 26.6, which suggests it is oversold.
My view is that $NEAR's current price action is heavily influenced by the wider market's reaction to $BTC ETF outflows. While the oversold RSI could signal a bounce, the underlying market sentiment remains cautious.
I would look for $NEAR to sustain a clear break above $3.10, accompanied by increased volume, before considering any short-term bullish outlook. Otherwise, the general market pressure could continue.
I am watching the overall $BTC price stability and future ETF flow data for a change in sentiment.
#NEARProtocol #BTCETFs
$NEAR is down 12.594% today, currently at $3.012. This movement comes as Cointelegraph reports record outflows from BlackRock’s IBIT ETF, leading to a broader market dip.
The overall market is showing 'Extreme Fear' with the index at 12. $NEAR has also declined 13.795% over the past seven days, hitting an RSI of 26.6, which suggests it is oversold.
My view is that $NEAR 's current price action is heavily influenced by the wider market's reaction to $BTC ETF outflows. While the oversold RSI could signal a bounce, the underlying market sentiment remains cautious.
I would look for $NEAR to sustain a clear break above $3.10, accompanied by increased volume, before considering any short-term bullish outlook. Otherwise, the general market pressure could continue.
I am watching the overall $BTC price stability and future ETF flow data for a change in sentiment.
#NEARProtocol #BTCETFs
The overall market is showing 'Extreme Fear' with the index at 12. $NEAR has also declined 13.795% over the past seven days, hitting an RSI of 26.6, which suggests it is oversold.
My view is that $NEAR 's current price action is heavily influenced by the wider market's reaction to $BTC ETF outflows. While the oversold RSI could signal a bounce, the underlying market sentiment remains cautious.
I would look for $NEAR to sustain a clear break above $3.10, accompanied by increased volume, before considering any short-term bullish outlook. Otherwise, the general market pressure could continue.
I am watching the overall $BTC price stability and future ETF flow data for a change in sentiment.
#NEARProtocol #BTCETFs
160
·
--
Article
What you all think about NEAR ??Every Dip Tests Your Faith: $NEAR Fights to Stay Above SupportPersistent selling pressure creates challenging conditions for NEAR holders today
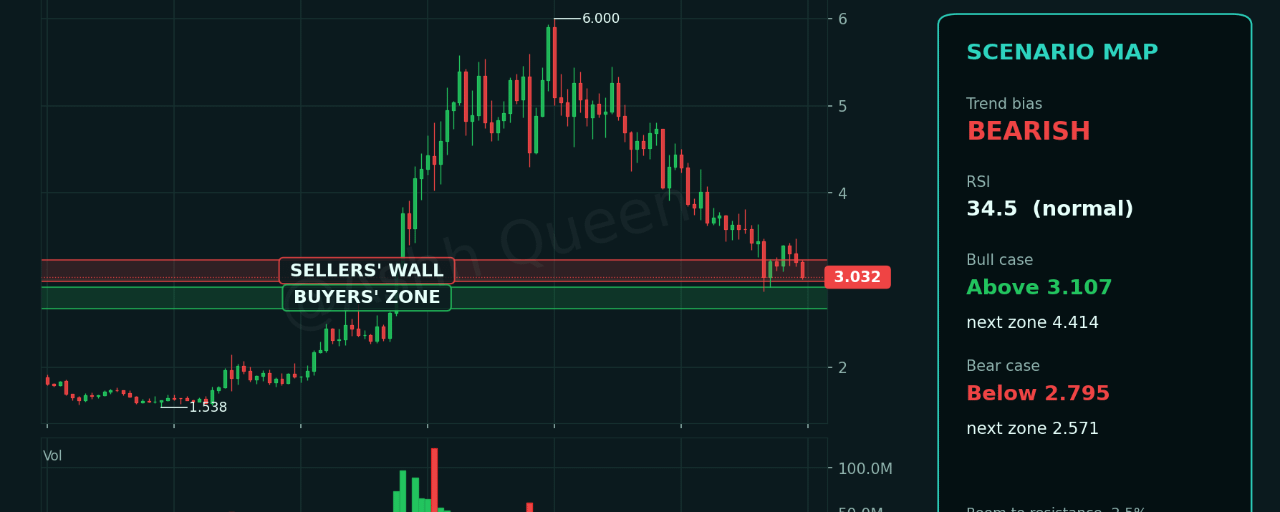
The current market environment for $NEAR is defined by a distinct shift in sentiment, as price action struggles to find a foothold amidst persistent selling pressure. With the asset currently trading at 3.032, participants are closely evaluating the structural integrity of key technical levels across multiple timeframes. This assessment is particularly vital given the recent convergence of bearish indicators that suggest a challenging period for the bulls. Throughout the 1h, 4h, and 1d charts, the consistent rejection from moving averages highlights the depth of the current trend. We will examine how the one-hour RSI at 27.77 and the four-hour RSI at 35.65 reflect the prevailing momentum, while also considering the significance of the daily EMA200 at 3.023 as a critical anchor for potential stability. Understanding the interplay between these zones and the daily EMA50 at 3.852 provides a clearer picture of whether current levels can hold or if further adjustments are likely in the near term.
📊 The Big Picture: $NEAR on the Daily Chart
On the daily timeframe, the structure for NEAR reflects a period of moderated bearish sentiment as the price attempts to stabilize above critical long-term thresholds. Currently hovering at 3.032, the asset remains positioned significantly below the daily EMA50 at 3.852, signaling that the broader trend has yet to shift in favor of a recovery. While the market is navigating this consolidation, the fact that the price is holding just above the daily EMA200 at 3.023 provides a technical floor that patient participants are monitoring closely.
The daily RSI at 34.54 indicates that momentum is currently lacking, sitting in a neutral zone that offers little in the way of immediate bullish conviction. Furthermore, the asset is trading below the daily VWAP at 3.088, suggesting that short-term volume-weighted activity continues to favor the downside. For those observing the macro structure, the path ahead involves watching how the price interacts with the daily resistance1 at 3.107. If the asset fails to reclaim these levels, the daily support1 at 2.795 may see further testing. Ultimately, the current daily configuration suggests a cautious environment where sustained accumulation above the daily EMA200 at 3.023 is essential before any meaningful shift in the current moderate bearish bias can be confirmed.
⏱️ Four-Hour Structure and Momentum
On the 4h timeframe, the technical structure for NEAR shows a pronounced bearish bias, characterized by sustained downward momentum. The price, currently at 3.031, is trading well below key moving averages, reinforcing the current trend of seller dominance. Most notably, the four-hour EMA50 at 3.333 continues to act as a significant barrier for any potential recovery, and as long as the price remains capped below this level, the path of least resistance remains tilted toward the downside. The technical landscape is further defined by the four-hour VWAP at 3.081, which the asset has struggled to reclaim, signaling that participants are generally favoring short-term distribution over accumulation.
Regarding momentum, the 4h RSI at 35.65 sits in a neutral zone, suggesting that while the downward movement has been impactful, the indicator has not yet reached extreme oversold territory. This leaves room for further volatility if the price continues to track toward the four-hour support at 2.343. Furthermore, the four-hour Bollinger Band lower boundary at 3.060 serves as a critical observation point; a consistent close below this band would typically indicate an intensification of the current trend. For market participants, the four-hour resistance at 3.101 remains the primary hurdle that would need to be reclaimed to initiate a shift in the existing bearish market sentiment.
🧭 The One-Hour Map: Levels That Matter Today
On the one-hour timeframe, NEAR is currently navigating a strictly bearish landscape as the price at 3.031 remains suppressed well below key moving averages. The immediate focus for market participants is the VWAP at 3.079, which currently acts as a significant hurdle for any attempted recovery. With the RSI at 27.77 resting in oversold territory, the asset is showing signs of exhaustion, yet the lack of a clear reversal signal suggests that selling pressure remains the dominant theme. Volatility, measured by the ATR at 0.0590, indicates that price swings remain relatively contained despite the overall downward bias.
Should the asset struggle to reclaim the VWAP at 3.079, market watchers may look toward the one-hour resistance at 3.106 as a ceiling for intraday price action. Conversely, if the current weakness persists, the one-hour support at 2.870 becomes the next logical area of interest. Monitoring how the price interacts with these levels is essential, as the distance between the current price and the one-hour EMA20 at 3.176 highlights the weight of the prevailing trend. Maintaining an objective view on these technical markers allows for a clearer understanding of the intraday momentum shifts as they develop.
📈 What the Derivatives Market Is Saying
The derivatives market for NEAR currently reflects the underlying caution seen across technical timeframes. With a -10.77% over the last session, market participants are processing a significant shift in sentiment. The current open interest at 54,291,915 suggests that while positions remain active, there is a clear hesitation in aggressive directional commitment. This environment often points to traders waiting for further confirmation before establishing new exposure.
Furthermore, the funding rate at -0.0043% remains in negative territory, which indicates that short-side participants are currently covering the cost to keep their positions open. This crowd positioning can sometimes suggest a crowded sentiment, where the market is leaning heavily in one direction. While this does not provide a definitive trajectory for the asset, it does highlight the current difficulty in sustaining upward momentum. As traders monitor these metrics, the interplay between the prevailing sentiment and the broader structural levels will likely dictate the next phase of volatility for $NEAR. Balancing these data points is essential for understanding the current market equilibrium.
🎯 Scenario Playbook: Bull, Base and Bear Cases
In the current market environment for $NEAR, we can outline three distinct scenarios based on the technical landscape. In the bull case, the primary objective for NEAR is to reclaim the four-hour resistance at 3.101. If the asset can sustain a move above this level, it may signal an attempt to alleviate current selling pressure, provided it also clears the one-hour resistance at 3.106. This scenario would be confirmed if buyers manage to push the price toward the one-hour resistance at 3.168, effectively shifting the immediate short-term sentiment. Conversely, this outlook would be invalidated if the price fails to hold above the one-hour support at 2.870.
The base case suggests a period of consolidation as the market navigates the proximity of the daily EMA200 at 3.023. Here, NEAR may oscillate between the one-hour support at 2.870 and the four-hour resistance at 3.101. This range-bound behavior would be sustained as long as the one-hour RSI at 27.77 remains in a neutral-to-oversold state without a definitive break in either direction.
Finally, the bear case focuses on the potential for continued downward momentum if the price breaks below the one-hour support at 2.870. Such a move would likely lead to a test of the daily support at 2.795 and the one-hour support at 2.781. This scenario is confirmed if the four-hour RSI at 35.65 continues to trend lower, signaling sustained lack of demand. It would be invalidated if NEAR finds enough support at the daily EMA200 at 3.023 to initiate a reversal back toward the four-hour resistance at 3.101.
🛡️ Risk Management and Account Security
Navigating current conditions for NEAR requires a disciplined approach to risk, especially when market volatility, as measured by the four-hour ATR at 0.1213, remains a factor in how price moves through its ranges. Maintaining small position sizes is a fundamental principle, as it allows for broader decision-making room without the emotional strain of excessive exposure. Before considering any market engagement, it is vital to define where an initial thesis is invalidated. By planning the exit strategy alongside the invalidation point, one can effectively manage risk relative to the current four-hour ATR at 0.1213. Avoiding the trap of high leverage is equally critical; leverage magnifies risks disproportionately, often leading to forced exits during standard market fluctuations.
Beyond market mechanics, account security acts as your primary defense. Always ensure that two-factor authentication is active to add a necessary layer of protection beyond simple passwords. Utilize an anti-phishing code to verify official communications and strictly stick to official applications to mitigate the risk of interacting with malicious interfaces. Never share your private keys or seed phrases with anyone, as these are the keys to your assets. A professional approach to the market is built on these foundational security habits, ensuring that your long-term presence is not compromised by avoidable technical vulnerabilities. In a landscape where NEAR fluctuates, staying secure is just as important as being analytical.
✅ Final Take
The current landscape for $NEAR is defined by persistent technical headwinds across multiple timeframes. With the price at 3.032, the immediate focus shifts toward whether the asset can stabilize above the daily EMA200 at 3.023. While the one-hour RSI at 27.77 suggests oversold conditions, the broader trend remains under pressure, as evidenced by the four-hour RSI at 35.65 failing to reclaim neutral ground. Should the selling continue, market participants will likely monitor the one-hour support at 2.870 and the daily support at 2.795 for signs of a potential floor. Conversely, any attempt at a recovery would require a decisive move past the one-hour resistance at 3.106 and the four-hour resistance at 3.101 to improve the technical outlook. Given these ongoing structural challenges, how do you evaluate the current strength of the support zones at these lower levels for $NEAR?
#Near #nearprotocol #CryptoAnalysis" #BİNANCESQUARE
Not financial advice. Markets are volatile, so use stop-losses and only risk what you can afford to lose.
What you all think about NEAR ??Every Dip Tests Your Faith: $NEAR Fights to Stay Above Support
Persistent selling pressure creates challenging conditions for NEAR holders today
The current market environment for $NEAR is defined by a distinct shift in sentiment, as price action struggles to find a foothold amidst persistent selling pressure. With the asset currently trading at 3.032, participants are closely evaluating the structural integrity of key technical levels across multiple timeframes. This assessment is particularly vital given the recent convergence of bearish indicators that suggest a challenging period for the bulls. Throughout the 1h, 4h, and 1d charts, the consistent rejection from moving averages highlights the depth of the current trend. We will examine how the one-hour RSI at 27.77 and the four-hour RSI at 35.65 reflect the prevailing momentum, while also considering the significance of the daily EMA200 at 3.023 as a critical anchor for potential stability. Understanding the interplay between these zones and the daily EMA50 at 3.852 provides a clearer picture of whether current levels can hold or if further adjustments are likely in the near term.
📊 The Big Picture: $NEAR on the Daily Chart
On the daily timeframe, the structure for NEAR reflects a period of moderated bearish sentiment as the price attempts to stabilize above critical long-term thresholds. Currently hovering at 3.032, the asset remains positioned significantly below the daily EMA50 at 3.852, signaling that the broader trend has yet to shift in favor of a recovery. While the market is navigating this consolidation, the fact that the price is holding just above the daily EMA200 at 3.023 provides a technical floor that patient participants are monitoring closely.
The daily RSI at 34.54 indicates that momentum is currently lacking, sitting in a neutral zone that offers little in the way of immediate bullish conviction. Furthermore, the asset is trading below the daily VWAP at 3.088, suggesting that short-term volume-weighted activity continues to favor the downside. For those observing the macro structure, the path ahead involves watching how the price interacts with the daily resistance1 at 3.107. If the asset fails to reclaim these levels, the daily support1 at 2.795 may see further testing. Ultimately, the current daily configuration suggests a cautious environment where sustained accumulation above the daily EMA200 at 3.023 is essential before any meaningful shift in the current moderate bearish bias can be confirmed.
⏱️ Four-Hour Structure and Momentum
On the 4h timeframe, the technical structure for NEAR shows a pronounced bearish bias, characterized by sustained downward momentum. The price, currently at 3.031, is trading well below key moving averages, reinforcing the current trend of seller dominance. Most notably, the four-hour EMA50 at 3.333 continues to act as a significant barrier for any potential recovery, and as long as the price remains capped below this level, the path of least resistance remains tilted toward the downside. The technical landscape is further defined by the four-hour VWAP at 3.081, which the asset has struggled to reclaim, signaling that participants are generally favoring short-term distribution over accumulation.
Regarding momentum, the 4h RSI at 35.65 sits in a neutral zone, suggesting that while the downward movement has been impactful, the indicator has not yet reached extreme oversold territory. This leaves room for further volatility if the price continues to track toward the four-hour support at 2.343. Furthermore, the four-hour Bollinger Band lower boundary at 3.060 serves as a critical observation point; a consistent close below this band would typically indicate an intensification of the current trend. For market participants, the four-hour resistance at 3.101 remains the primary hurdle that would need to be reclaimed to initiate a shift in the existing bearish market sentiment.
🧭 The One-Hour Map: Levels That Matter Today
On the one-hour timeframe, NEAR is currently navigating a strictly bearish landscape as the price at 3.031 remains suppressed well below key moving averages. The immediate focus for market participants is the VWAP at 3.079, which currently acts as a significant hurdle for any attempted recovery. With the RSI at 27.77 resting in oversold territory, the asset is showing signs of exhaustion, yet the lack of a clear reversal signal suggests that selling pressure remains the dominant theme. Volatility, measured by the ATR at 0.0590, indicates that price swings remain relatively contained despite the overall downward bias.
Should the asset struggle to reclaim the VWAP at 3.079, market watchers may look toward the one-hour resistance at 3.106 as a ceiling for intraday price action. Conversely, if the current weakness persists, the one-hour support at 2.870 becomes the next logical area of interest. Monitoring how the price interacts with these levels is essential, as the distance between the current price and the one-hour EMA20 at 3.176 highlights the weight of the prevailing trend. Maintaining an objective view on these technical markers allows for a clearer understanding of the intraday momentum shifts as they develop.
📈 What the Derivatives Market Is Saying
The derivatives market for NEAR currently reflects the underlying caution seen across technical timeframes. With a -10.77% over the last session, market participants are processing a significant shift in sentiment. The current open interest at 54,291,915 suggests that while positions remain active, there is a clear hesitation in aggressive directional commitment. This environment often points to traders waiting for further confirmation before establishing new exposure.
Furthermore, the funding rate at -0.0043% remains in negative territory, which indicates that short-side participants are currently covering the cost to keep their positions open. This crowd positioning can sometimes suggest a crowded sentiment, where the market is leaning heavily in one direction. While this does not provide a definitive trajectory for the asset, it does highlight the current difficulty in sustaining upward momentum. As traders monitor these metrics, the interplay between the prevailing sentiment and the broader structural levels will likely dictate the next phase of volatility for $NEAR . Balancing these data points is essential for understanding the current market equilibrium.
🎯 Scenario Playbook: Bull, Base and Bear Cases
In the current market environment for $NEAR , we can outline three distinct scenarios based on the technical landscape. In the bull case, the primary objective for NEAR is to reclaim the four-hour resistance at 3.101. If the asset can sustain a move above this level, it may signal an attempt to alleviate current selling pressure, provided it also clears the one-hour resistance at 3.106. This scenario would be confirmed if buyers manage to push the price toward the one-hour resistance at 3.168, effectively shifting the immediate short-term sentiment. Conversely, this outlook would be invalidated if the price fails to hold above the one-hour support at 2.870.
The base case suggests a period of consolidation as the market navigates the proximity of the daily EMA200 at 3.023. Here, NEAR may oscillate between the one-hour support at 2.870 and the four-hour resistance at 3.101. This range-bound behavior would be sustained as long as the one-hour RSI at 27.77 remains in a neutral-to-oversold state without a definitive break in either direction.
Finally, the bear case focuses on the potential for continued downward momentum if the price breaks below the one-hour support at 2.870. Such a move would likely lead to a test of the daily support at 2.795 and the one-hour support at 2.781. This scenario is confirmed if the four-hour RSI at 35.65 continues to trend lower, signaling sustained lack of demand. It would be invalidated if NEAR finds enough support at the daily EMA200 at 3.023 to initiate a reversal back toward the four-hour resistance at 3.101.
🛡️ Risk Management and Account Security
Navigating current conditions for NEAR requires a disciplined approach to risk, especially when market volatility, as measured by the four-hour ATR at 0.1213, remains a factor in how price moves through its ranges. Maintaining small position sizes is a fundamental principle, as it allows for broader decision-making room without the emotional strain of excessive exposure. Before considering any market engagement, it is vital to define where an initial thesis is invalidated. By planning the exit strategy alongside the invalidation point, one can effectively manage risk relative to the current four-hour ATR at 0.1213. Avoiding the trap of high leverage is equally critical; leverage magnifies risks disproportionately, often leading to forced exits during standard market fluctuations.
Beyond market mechanics, account security acts as your primary defense. Always ensure that two-factor authentication is active to add a necessary layer of protection beyond simple passwords. Utilize an anti-phishing code to verify official communications and strictly stick to official applications to mitigate the risk of interacting with malicious interfaces. Never share your private keys or seed phrases with anyone, as these are the keys to your assets. A professional approach to the market is built on these foundational security habits, ensuring that your long-term presence is not compromised by avoidable technical vulnerabilities. In a landscape where NEAR fluctuates, staying secure is just as important as being analytical.
✅ Final Take
The current landscape for $NEAR is defined by persistent technical headwinds across multiple timeframes. With the price at 3.032, the immediate focus shifts toward whether the asset can stabilize above the daily EMA200 at 3.023. While the one-hour RSI at 27.77 suggests oversold conditions, the broader trend remains under pressure, as evidenced by the four-hour RSI at 35.65 failing to reclaim neutral ground. Should the selling continue, market participants will likely monitor the one-hour support at 2.870 and the daily support at 2.795 for signs of a potential floor. Conversely, any attempt at a recovery would require a decisive move past the one-hour resistance at 3.106 and the four-hour resistance at 3.101 to improve the technical outlook. Given these ongoing structural challenges, how do you evaluate the current strength of the support zones at these lower levels for $NEAR ?
#Near #nearprotocol #CryptoAnalysis" #BİNANCESQUARE
Not financial advice. Markets are volatile, so use stop-losses and only risk what you can afford to lose.
The current market environment for $NEAR is defined by a distinct shift in sentiment, as price action struggles to find a foothold amidst persistent selling pressure. With the asset currently trading at 3.032, participants are closely evaluating the structural integrity of key technical levels across multiple timeframes. This assessment is particularly vital given the recent convergence of bearish indicators that suggest a challenging period for the bulls. Throughout the 1h, 4h, and 1d charts, the consistent rejection from moving averages highlights the depth of the current trend. We will examine how the one-hour RSI at 27.77 and the four-hour RSI at 35.65 reflect the prevailing momentum, while also considering the significance of the daily EMA200 at 3.023 as a critical anchor for potential stability. Understanding the interplay between these zones and the daily EMA50 at 3.852 provides a clearer picture of whether current levels can hold or if further adjustments are likely in the near term.
📊 The Big Picture: $NEAR on the Daily Chart
On the daily timeframe, the structure for NEAR reflects a period of moderated bearish sentiment as the price attempts to stabilize above critical long-term thresholds. Currently hovering at 3.032, the asset remains positioned significantly below the daily EMA50 at 3.852, signaling that the broader trend has yet to shift in favor of a recovery. While the market is navigating this consolidation, the fact that the price is holding just above the daily EMA200 at 3.023 provides a technical floor that patient participants are monitoring closely.
The daily RSI at 34.54 indicates that momentum is currently lacking, sitting in a neutral zone that offers little in the way of immediate bullish conviction. Furthermore, the asset is trading below the daily VWAP at 3.088, suggesting that short-term volume-weighted activity continues to favor the downside. For those observing the macro structure, the path ahead involves watching how the price interacts with the daily resistance1 at 3.107. If the asset fails to reclaim these levels, the daily support1 at 2.795 may see further testing. Ultimately, the current daily configuration suggests a cautious environment where sustained accumulation above the daily EMA200 at 3.023 is essential before any meaningful shift in the current moderate bearish bias can be confirmed.
⏱️ Four-Hour Structure and Momentum
On the 4h timeframe, the technical structure for NEAR shows a pronounced bearish bias, characterized by sustained downward momentum. The price, currently at 3.031, is trading well below key moving averages, reinforcing the current trend of seller dominance. Most notably, the four-hour EMA50 at 3.333 continues to act as a significant barrier for any potential recovery, and as long as the price remains capped below this level, the path of least resistance remains tilted toward the downside. The technical landscape is further defined by the four-hour VWAP at 3.081, which the asset has struggled to reclaim, signaling that participants are generally favoring short-term distribution over accumulation.
Regarding momentum, the 4h RSI at 35.65 sits in a neutral zone, suggesting that while the downward movement has been impactful, the indicator has not yet reached extreme oversold territory. This leaves room for further volatility if the price continues to track toward the four-hour support at 2.343. Furthermore, the four-hour Bollinger Band lower boundary at 3.060 serves as a critical observation point; a consistent close below this band would typically indicate an intensification of the current trend. For market participants, the four-hour resistance at 3.101 remains the primary hurdle that would need to be reclaimed to initiate a shift in the existing bearish market sentiment.
🧭 The One-Hour Map: Levels That Matter Today
On the one-hour timeframe, NEAR is currently navigating a strictly bearish landscape as the price at 3.031 remains suppressed well below key moving averages. The immediate focus for market participants is the VWAP at 3.079, which currently acts as a significant hurdle for any attempted recovery. With the RSI at 27.77 resting in oversold territory, the asset is showing signs of exhaustion, yet the lack of a clear reversal signal suggests that selling pressure remains the dominant theme. Volatility, measured by the ATR at 0.0590, indicates that price swings remain relatively contained despite the overall downward bias.
Should the asset struggle to reclaim the VWAP at 3.079, market watchers may look toward the one-hour resistance at 3.106 as a ceiling for intraday price action. Conversely, if the current weakness persists, the one-hour support at 2.870 becomes the next logical area of interest. Monitoring how the price interacts with these levels is essential, as the distance between the current price and the one-hour EMA20 at 3.176 highlights the weight of the prevailing trend. Maintaining an objective view on these technical markers allows for a clearer understanding of the intraday momentum shifts as they develop.
📈 What the Derivatives Market Is Saying
The derivatives market for NEAR currently reflects the underlying caution seen across technical timeframes. With a -10.77% over the last session, market participants are processing a significant shift in sentiment. The current open interest at 54,291,915 suggests that while positions remain active, there is a clear hesitation in aggressive directional commitment. This environment often points to traders waiting for further confirmation before establishing new exposure.
Furthermore, the funding rate at -0.0043% remains in negative territory, which indicates that short-side participants are currently covering the cost to keep their positions open. This crowd positioning can sometimes suggest a crowded sentiment, where the market is leaning heavily in one direction. While this does not provide a definitive trajectory for the asset, it does highlight the current difficulty in sustaining upward momentum. As traders monitor these metrics, the interplay between the prevailing sentiment and the broader structural levels will likely dictate the next phase of volatility for $NEAR . Balancing these data points is essential for understanding the current market equilibrium.
🎯 Scenario Playbook: Bull, Base and Bear Cases
In the current market environment for $NEAR , we can outline three distinct scenarios based on the technical landscape. In the bull case, the primary objective for NEAR is to reclaim the four-hour resistance at 3.101. If the asset can sustain a move above this level, it may signal an attempt to alleviate current selling pressure, provided it also clears the one-hour resistance at 3.106. This scenario would be confirmed if buyers manage to push the price toward the one-hour resistance at 3.168, effectively shifting the immediate short-term sentiment. Conversely, this outlook would be invalidated if the price fails to hold above the one-hour support at 2.870.
The base case suggests a period of consolidation as the market navigates the proximity of the daily EMA200 at 3.023. Here, NEAR may oscillate between the one-hour support at 2.870 and the four-hour resistance at 3.101. This range-bound behavior would be sustained as long as the one-hour RSI at 27.77 remains in a neutral-to-oversold state without a definitive break in either direction.
Finally, the bear case focuses on the potential for continued downward momentum if the price breaks below the one-hour support at 2.870. Such a move would likely lead to a test of the daily support at 2.795 and the one-hour support at 2.781. This scenario is confirmed if the four-hour RSI at 35.65 continues to trend lower, signaling sustained lack of demand. It would be invalidated if NEAR finds enough support at the daily EMA200 at 3.023 to initiate a reversal back toward the four-hour resistance at 3.101.
🛡️ Risk Management and Account Security
Navigating current conditions for NEAR requires a disciplined approach to risk, especially when market volatility, as measured by the four-hour ATR at 0.1213, remains a factor in how price moves through its ranges. Maintaining small position sizes is a fundamental principle, as it allows for broader decision-making room without the emotional strain of excessive exposure. Before considering any market engagement, it is vital to define where an initial thesis is invalidated. By planning the exit strategy alongside the invalidation point, one can effectively manage risk relative to the current four-hour ATR at 0.1213. Avoiding the trap of high leverage is equally critical; leverage magnifies risks disproportionately, often leading to forced exits during standard market fluctuations.
Beyond market mechanics, account security acts as your primary defense. Always ensure that two-factor authentication is active to add a necessary layer of protection beyond simple passwords. Utilize an anti-phishing code to verify official communications and strictly stick to official applications to mitigate the risk of interacting with malicious interfaces. Never share your private keys or seed phrases with anyone, as these are the keys to your assets. A professional approach to the market is built on these foundational security habits, ensuring that your long-term presence is not compromised by avoidable technical vulnerabilities. In a landscape where NEAR fluctuates, staying secure is just as important as being analytical.
✅ Final Take
The current landscape for $NEAR is defined by persistent technical headwinds across multiple timeframes. With the price at 3.032, the immediate focus shifts toward whether the asset can stabilize above the daily EMA200 at 3.023. While the one-hour RSI at 27.77 suggests oversold conditions, the broader trend remains under pressure, as evidenced by the four-hour RSI at 35.65 failing to reclaim neutral ground. Should the selling continue, market participants will likely monitor the one-hour support at 2.870 and the daily support at 2.795 for signs of a potential floor. Conversely, any attempt at a recovery would require a decisive move past the one-hour resistance at 3.106 and the four-hour resistance at 3.101 to improve the technical outlook. Given these ongoing structural challenges, how do you evaluate the current strength of the support zones at these lower levels for $NEAR ?
#Near #nearprotocol #CryptoAnalysis" #BİNANCESQUARE
Not financial advice. Markets are volatile, so use stop-losses and only risk what you can afford to lose.
1
1
3

·
--
⚡ $NEAR DEFENDS THE 200 EMA AS SMART MONEY STEPS BACK IN 🦈
Sellers hammered $NEAR down toward the legendary 200 EMA last week, trying to break the structural backbone of the trend. 📊 Instead of a breakdown, order flow flipped as heavy accumulation absorbed every last drop of supply.
Volume is waking up and fresh capital is flooding in, signaling that institutional participants are positioning for the next leg higher. ⚡ This slow, steady grind higher shows strong hands absorbing liquidity rather than retail chasing noise.
💬 Are you accumulating here near key moving average support or waiting for a confirmed breakout? 👇
⚠️ Not financial advice. Always manage your risk. 🛡️
🏷️ #NEAR #NearProtocol #Altcoins #Crypto
🔥 💎
⚡ $NEAR DEFENDS THE 200 EMA AS SMART MONEY STEPS BACK IN 🦈
Sellers hammered $NEAR down toward the legendary 200 EMA last week, trying to break the structural backbone of the trend. 📊 Instead of a breakdown, order flow flipped as heavy accumulation absorbed every last drop of supply.
Volume is waking up and fresh capital is flooding in, signaling that institutional participants are positioning for the next leg higher. ⚡ This slow, steady grind higher shows strong hands absorbing liquidity rather than retail chasing noise.
💬 Are you accumulating here near key moving average support or waiting for a confirmed breakout? 👇
⚠️ Not financial advice. Always manage your risk. 🛡️
🏷️ #NEAR #NearProtocol #Altcoins #Crypto
🔥 💎
Sellers hammered $NEAR down toward the legendary 200 EMA last week, trying to break the structural backbone of the trend. 📊 Instead of a breakdown, order flow flipped as heavy accumulation absorbed every last drop of supply.
Volume is waking up and fresh capital is flooding in, signaling that institutional participants are positioning for the next leg higher. ⚡ This slow, steady grind higher shows strong hands absorbing liquidity rather than retail chasing noise.
💬 Are you accumulating here near key moving average support or waiting for a confirmed breakout? 👇
⚠️ Not financial advice. Always manage your risk. 🛡️
🏷️ #NEAR #NearProtocol #Altcoins #Crypto
🔥 💎
11

·
--
NEAR — DOWNTREND 📉
$NEAR is the day's biggest top-25 loser, -12% in 24h to $3.01 — sitting right on its day low after being rejected at $3.47. Lower highs and lower lows, sellers fully in control while BTC bleeds below $62K.
Support: $3.00 (day low) — losing it opens fresh lows. Resistance: $3.20 / $3.47.
A 4H close above $3.20 would slow the fall; reclaiming $3.47 flips the trend.
#NEAR #NEARProtocol
Not financial advice.
NEAR — DOWNTREND 📉
$NEAR is the day's biggest top-25 loser, -12% in 24h to $3.01 — sitting right on its day low after being rejected at $3.47. Lower highs and lower lows, sellers fully in control while BTC bleeds below $62K.
Support: $3.00 (day low) — losing it opens fresh lows. Resistance: $3.20 / $3.47.
A 4H close above $3.20 would slow the fall; reclaiming $3.47 flips the trend.
#NEAR #NEARProtocol
Not financial advice.
$NEAR is the day's biggest top-25 loser, -12% in 24h to $3.01 — sitting right on its day low after being rejected at $3.47. Lower highs and lower lows, sellers fully in control while BTC bleeds below $62K.
Support: $3.00 (day low) — losing it opens fresh lows. Resistance: $3.20 / $3.47.
A 4H close above $3.20 would slow the fall; reclaiming $3.47 flips the trend.
#NEAR #NEARProtocol
Not financial advice.
7
·
--
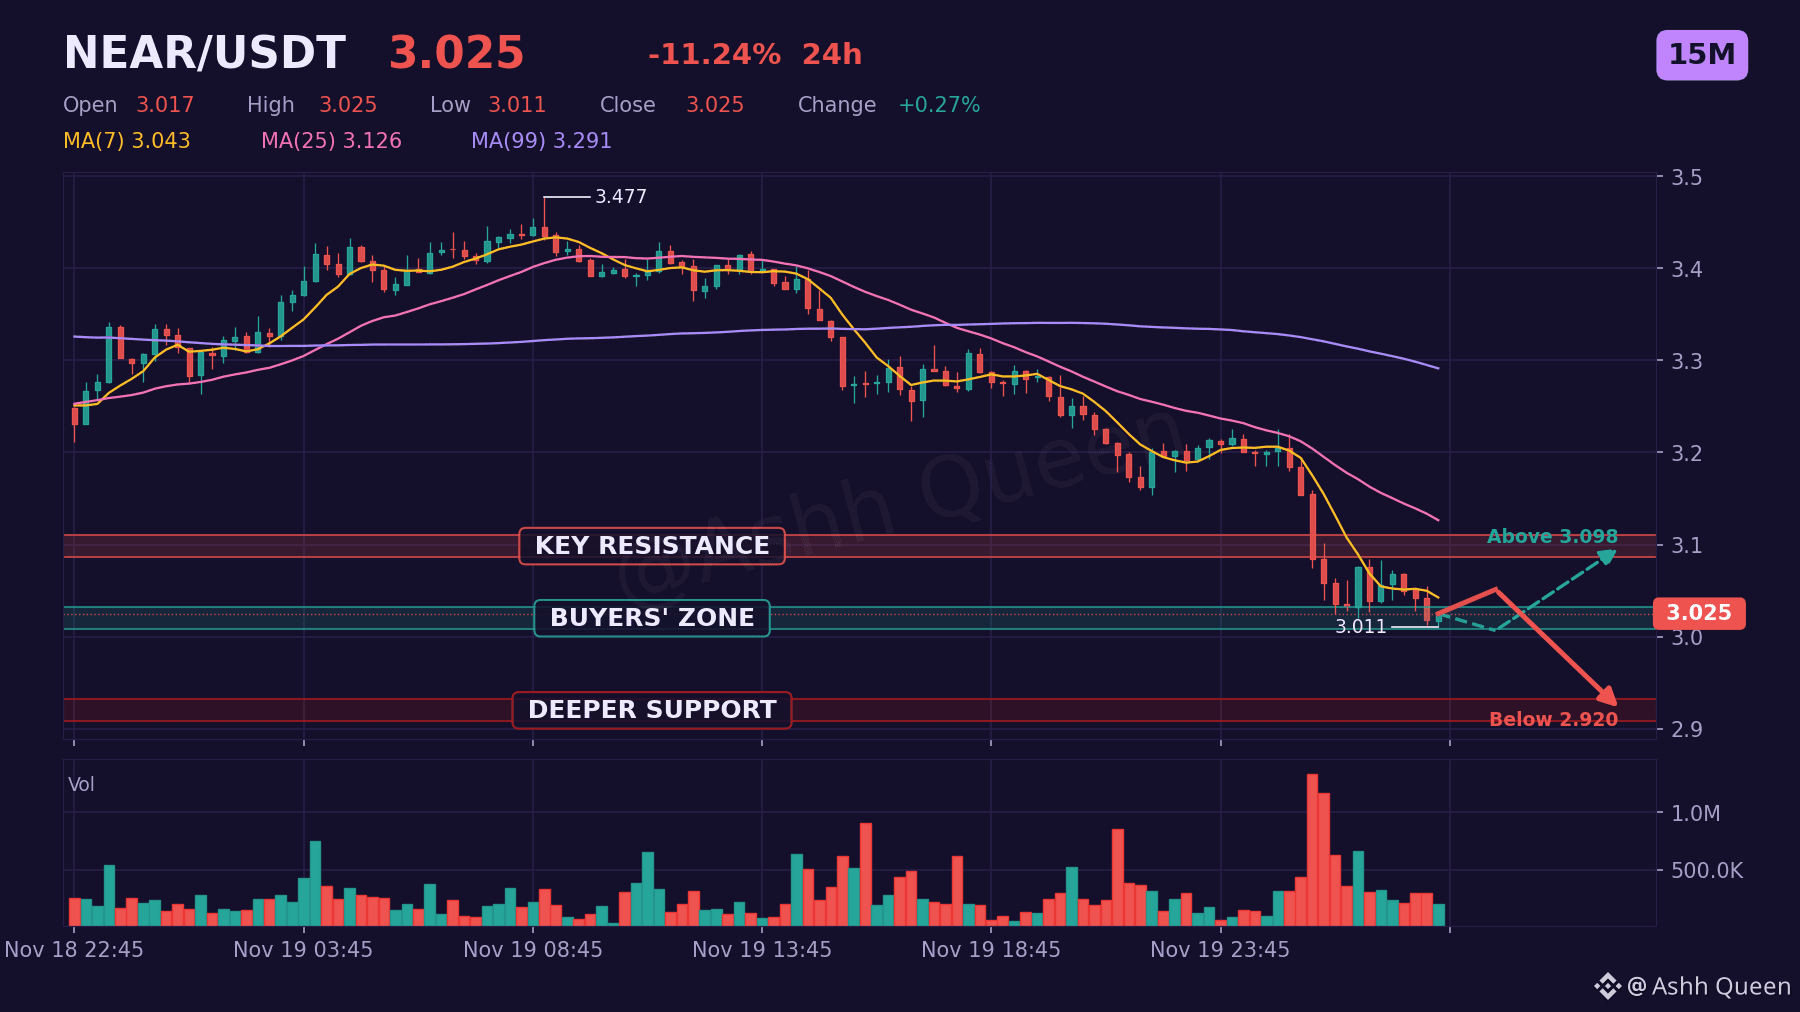
$NEAR is sliding toward the cliff edge on 15m.
Price at 3.025 remains trapped below EMA50 at 3.174 and VWAP at 3.090. Negative funding rate at -0.0019% with open interest at 54,622,944 suggests the market is leaning into a bearish trend, but sellers might be getting exhausted.
If support at 3.020 fails, look for further downward pressure. If it holds, a recovery toward resistance at 3.098 becomes the scenario to watch. 📊 📉
Do you prefer trading these bearish setups on the short or the longer timeframe?
#NEAR #Layer1 #NEARProtocol
This is analysis, not a recommendation. Manage risk first, profit second.
$NEAR is sliding toward the cliff edge on 15m.
Price at 3.025 remains trapped below EMA50 at 3.174 and VWAP at 3.090. Negative funding rate at -0.0019% with open interest at 54,622,944 suggests the market is leaning into a bearish trend, but sellers might be getting exhausted.
If support at 3.020 fails, look for further downward pressure. If it holds, a recovery toward resistance at 3.098 becomes the scenario to watch. 📊 📉
Do you prefer trading these bearish setups on the short or the longer timeframe?
#NEAR #Layer1 #NEARProtocol
This is analysis, not a recommendation. Manage risk first, profit second.
Price at 3.025 remains trapped below EMA50 at 3.174 and VWAP at 3.090. Negative funding rate at -0.0019% with open interest at 54,622,944 suggests the market is leaning into a bearish trend, but sellers might be getting exhausted.
If support at 3.020 fails, look for further downward pressure. If it holds, a recovery toward resistance at 3.098 becomes the scenario to watch. 📊 📉
Do you prefer trading these bearish setups on the short or the longer timeframe?
#NEAR #Layer1 #NEARProtocol
This is analysis, not a recommendation. Manage risk first, profit second.
62

NEAR, UNI and ENA Market Analysis: Oversold Signals Meet a Fragile Altcoin Trend
The latest price action across NEAR Protocol, Uniswap and Ethena shows a market still under pressure, but one where momentum indicators are beginning to reveal important differences. All three assets are trading below key trend averages, which keeps the broader structure cautious. At the same time, UNI and ENA have moved into oversold territory, creating a market environment where sharp volatility can emerge quickly in either direction.
NEAR is currently trading around $3.28 after moving between $3.21 and $3.48 during the latest session. The token is down about 0.82% on the day, while its seven day decline stands near 8.67%. Over the past 30 days, NEAR has fallen around 33.20%, showing that sellers have remained active across the broader market cycle.
The technical picture for NEAR is mixed rather than fully oversold. Its RSI is near 40.15, which suggests momentum is weak but not yet at the extreme levels seen in UNI and ENA. NEAR is trading close to its 7 day moving average near $3.26, but remains below its 25 day and 99 day averages. This means the asset is trying to stabilize in the short term while the medium term trend remains challenged.
NEAR also has a bearish MACD structure and a downward SuperTrend reading, reinforcing the fact that the broader market has not yet confirmed a recovery. However, the latest capital flow shows a modest net inflow, which may indicate that some buyers are becoming active near lower price levels. That does not confirm a trend reversal, but it is a meaningful development for traders watching whether selling pressure is starting to slow.
Uniswap is trading near $5.01 after touching a session high around $5.24 and a low near $4.90. UNI is down approximately 3.45% in the latest session, while its seven day decline has reached about 19.66%. The 30 day drawdown is near 31.56%, placing UNI close to the lower end of its recent market range.
UNI’s RSI is around 25.79, which places the token in oversold territory. This reflects heavy bearish momentum and highlights the possibility of high volatility if short term selling becomes exhausted. Still, oversold conditions alone do not confirm that the trend has reversed. UNI remains below its 7 day, 25 day and 99 day moving averages, while MACD continues to show a bearish signal and the SuperTrend remains pointed downward.
What stands out for UNI is the positive daily capital inflow despite the price decline. That suggests some demand is appearing as the token trades near lower levels. The volume ratio is below its 7 day average, meaning the latest move has occurred with lighter activity than the recent average. This can be interpreted in multiple ways. It may show that sellers are losing intensity, but it may also mean that buyers have not yet returned with strong conviction. The next stage will depend on whether volume expands during recovery attempts.
ENA is trading near $0.1059 after moving between $0.1056 and $0.1138 in the latest session. It is down around 5.45% on the day, 27.27% over seven days and 44.09% across 30 days. ENA is now positioned very close to its recent seven day and 30 day low, which underlines how intense the recent selloff has been.
ENA’s RSI is near 18.90, placing it deeply in oversold territory. This is the weakest momentum reading among the three assets and shows that bearish pressure has been particularly aggressive. The token is also trading below all major moving averages, with the 7 day average near $0.1174, the 25 day average around $0.1573 and the 99 day average near $0.1750. MACD remains bearish, while the SuperTrend continues to point downward.
Unlike NEAR and UNI, ENA is showing net capital outflow in the latest daily reading. This suggests that selling pressure has not fully faded, even after the substantial decline. Volume is also below the recent 7 day average, which points to reduced participation but does not yet prove demand is returning. For ENA, the market will be watching closely for signs of stabilization, improving capital flow and sustained volume before interpreting any rebound as more than a short term reaction.
The key takeaway is that NEAR currently shows the most balanced short term structure, UNI is technically oversold with early signs of demand, and ENA remains the most pressured asset with the deepest recent drawdown. All three are highly sensitive to broader crypto market sentiment, liquidity conditions and Bitcoin’s direction.
This remains a high volatility environment. Oversold readings can support short term rebounds, but trend confirmation requires improving volume, healthier capital flow and a shift in the broader moving average structure. Traders should focus on risk management, avoid reacting emotionally to sudden price swings and independently assess their objectives before taking any market action.
#NEARProtocol #Uniswap #Ethena #CryptoAnalysis #Altcoins
$NEAR
{spot}(NEARUSDT)
$ENA
{spot}(ENAUSDT)
$UNI
{spot}(UNIUSDT)
NEAR, UNI and ENA Market Analysis: Oversold Signals Meet a Fragile Altcoin Trend
The latest price action across NEAR Protocol, Uniswap and Ethena shows a market still under pressure, but one where momentum indicators are beginning to reveal important differences. All three assets are trading below key trend averages, which keeps the broader structure cautious. At the same time, UNI and ENA have moved into oversold territory, creating a market environment where sharp volatility can emerge quickly in either direction.
NEAR is currently trading around $3.28 after moving between $3.21 and $3.48 during the latest session. The token is down about 0.82% on the day, while its seven day decline stands near 8.67%. Over the past 30 days, NEAR has fallen around 33.20%, showing that sellers have remained active across the broader market cycle.
The technical picture for NEAR is mixed rather than fully oversold. Its RSI is near 40.15, which suggests momentum is weak but not yet at the extreme levels seen in UNI and ENA. NEAR is trading close to its 7 day moving average near $3.26, but remains below its 25 day and 99 day averages. This means the asset is trying to stabilize in the short term while the medium term trend remains challenged.
NEAR also has a bearish MACD structure and a downward SuperTrend reading, reinforcing the fact that the broader market has not yet confirmed a recovery. However, the latest capital flow shows a modest net inflow, which may indicate that some buyers are becoming active near lower price levels. That does not confirm a trend reversal, but it is a meaningful development for traders watching whether selling pressure is starting to slow.
Uniswap is trading near $5.01 after touching a session high around $5.24 and a low near $4.90. UNI is down approximately 3.45% in the latest session, while its seven day decline has reached about 19.66%. The 30 day drawdown is near 31.56%, placing UNI close to the lower end of its recent market range.
UNI’s RSI is around 25.79, which places the token in oversold territory. This reflects heavy bearish momentum and highlights the possibility of high volatility if short term selling becomes exhausted. Still, oversold conditions alone do not confirm that the trend has reversed. UNI remains below its 7 day, 25 day and 99 day moving averages, while MACD continues to show a bearish signal and the SuperTrend remains pointed downward.
What stands out for UNI is the positive daily capital inflow despite the price decline. That suggests some demand is appearing as the token trades near lower levels. The volume ratio is below its 7 day average, meaning the latest move has occurred with lighter activity than the recent average. This can be interpreted in multiple ways. It may show that sellers are losing intensity, but it may also mean that buyers have not yet returned with strong conviction. The next stage will depend on whether volume expands during recovery attempts.
ENA is trading near $0.1059 after moving between $0.1056 and $0.1138 in the latest session. It is down around 5.45% on the day, 27.27% over seven days and 44.09% across 30 days. ENA is now positioned very close to its recent seven day and 30 day low, which underlines how intense the recent selloff has been.
ENA’s RSI is near 18.90, placing it deeply in oversold territory. This is the weakest momentum reading among the three assets and shows that bearish pressure has been particularly aggressive. The token is also trading below all major moving averages, with the 7 day average near $0.1174, the 25 day average around $0.1573 and the 99 day average near $0.1750. MACD remains bearish, while the SuperTrend continues to point downward.
Unlike NEAR and UNI, ENA is showing net capital outflow in the latest daily reading. This suggests that selling pressure has not fully faded, even after the substantial decline. Volume is also below the recent 7 day average, which points to reduced participation but does not yet prove demand is returning. For ENA, the market will be watching closely for signs of stabilization, improving capital flow and sustained volume before interpreting any rebound as more than a short term reaction.
The key takeaway is that NEAR currently shows the most balanced short term structure, UNI is technically oversold with early signs of demand, and ENA remains the most pressured asset with the deepest recent drawdown. All three are highly sensitive to broader crypto market sentiment, liquidity conditions and Bitcoin’s direction.
This remains a high volatility environment. Oversold readings can support short term rebounds, but trend confirmation requires improving volume, healthier capital flow and a shift in the broader moving average structure. Traders should focus on risk management, avoid reacting emotionally to sudden price swings and independently assess their objectives before taking any market action.
#NEARProtocol #Uniswap #Ethena #CryptoAnalysis #Altcoins
$NEAR
$ENA
$UNI
NEAR is currently trading around $3.28 after moving between $3.21 and $3.48 during the latest session. The token is down about 0.82% on the day, while its seven day decline stands near 8.67%. Over the past 30 days, NEAR has fallen around 33.20%, showing that sellers have remained active across the broader market cycle.
The technical picture for NEAR is mixed rather than fully oversold. Its RSI is near 40.15, which suggests momentum is weak but not yet at the extreme levels seen in UNI and ENA. NEAR is trading close to its 7 day moving average near $3.26, but remains below its 25 day and 99 day averages. This means the asset is trying to stabilize in the short term while the medium term trend remains challenged.
NEAR also has a bearish MACD structure and a downward SuperTrend reading, reinforcing the fact that the broader market has not yet confirmed a recovery. However, the latest capital flow shows a modest net inflow, which may indicate that some buyers are becoming active near lower price levels. That does not confirm a trend reversal, but it is a meaningful development for traders watching whether selling pressure is starting to slow.
Uniswap is trading near $5.01 after touching a session high around $5.24 and a low near $4.90. UNI is down approximately 3.45% in the latest session, while its seven day decline has reached about 19.66%. The 30 day drawdown is near 31.56%, placing UNI close to the lower end of its recent market range.
UNI’s RSI is around 25.79, which places the token in oversold territory. This reflects heavy bearish momentum and highlights the possibility of high volatility if short term selling becomes exhausted. Still, oversold conditions alone do not confirm that the trend has reversed. UNI remains below its 7 day, 25 day and 99 day moving averages, while MACD continues to show a bearish signal and the SuperTrend remains pointed downward.
What stands out for UNI is the positive daily capital inflow despite the price decline. That suggests some demand is appearing as the token trades near lower levels. The volume ratio is below its 7 day average, meaning the latest move has occurred with lighter activity than the recent average. This can be interpreted in multiple ways. It may show that sellers are losing intensity, but it may also mean that buyers have not yet returned with strong conviction. The next stage will depend on whether volume expands during recovery attempts.
ENA is trading near $0.1059 after moving between $0.1056 and $0.1138 in the latest session. It is down around 5.45% on the day, 27.27% over seven days and 44.09% across 30 days. ENA is now positioned very close to its recent seven day and 30 day low, which underlines how intense the recent selloff has been.
ENA’s RSI is near 18.90, placing it deeply in oversold territory. This is the weakest momentum reading among the three assets and shows that bearish pressure has been particularly aggressive. The token is also trading below all major moving averages, with the 7 day average near $0.1174, the 25 day average around $0.1573 and the 99 day average near $0.1750. MACD remains bearish, while the SuperTrend continues to point downward.
Unlike NEAR and UNI, ENA is showing net capital outflow in the latest daily reading. This suggests that selling pressure has not fully faded, even after the substantial decline. Volume is also below the recent 7 day average, which points to reduced participation but does not yet prove demand is returning. For ENA, the market will be watching closely for signs of stabilization, improving capital flow and sustained volume before interpreting any rebound as more than a short term reaction.
The key takeaway is that NEAR currently shows the most balanced short term structure, UNI is technically oversold with early signs of demand, and ENA remains the most pressured asset with the deepest recent drawdown. All three are highly sensitive to broader crypto market sentiment, liquidity conditions and Bitcoin’s direction.
This remains a high volatility environment. Oversold readings can support short term rebounds, but trend confirmation requires improving volume, healthier capital flow and a shift in the broader moving average structure. Traders should focus on risk management, avoid reacting emotionally to sudden price swings and independently assess their objectives before taking any market action.
#NEARProtocol #Uniswap #Ethena #CryptoAnalysis #Altcoins
$NEAR
$ENA
$UNI
1
32

·
--
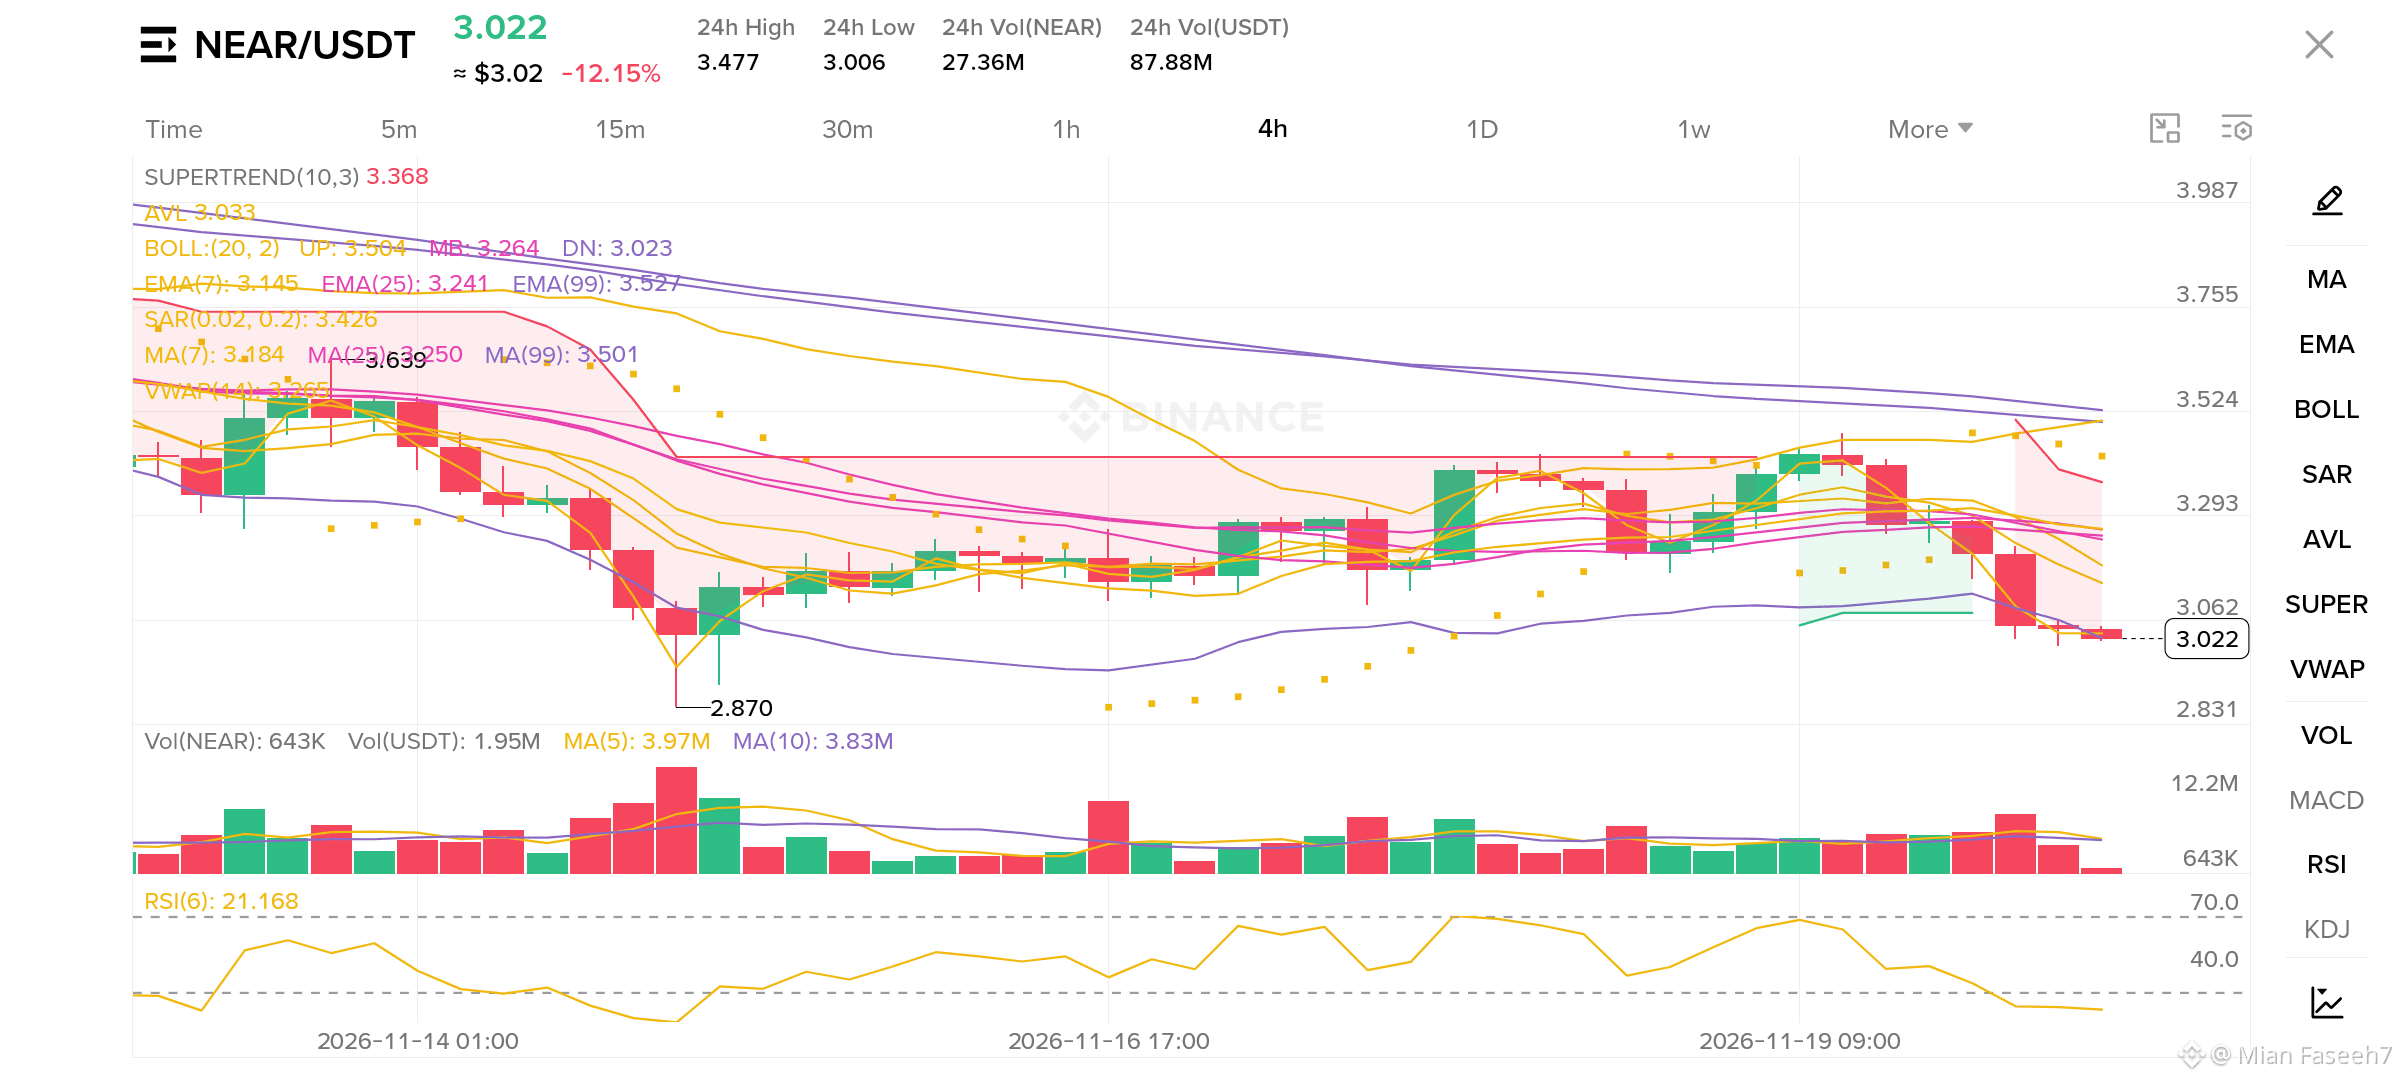
$NEAR is currently around $3.022, and it has seen a huge dump today.
Yesterday, the price went up to $3.477 and then dropped straight down. Now it’s very close to the low of $3.006. This means sellers took complete control from the top, and buyers didn’t get a chance to recover.
Looking at it, if $NEAR keeps holding above $3.006, we could see a small bounce from here to $3.264, which is also the Bollinger midline. And if a 4-hour candle closes above $3.264, the way will be clear toward $3.368.
But if it closes below $3.006, then a test of $2.870 below will be almost certain, so jumping into a long position there would be risky.
The RSI is now at 21, so it’s quite oversold. Selling in a panic right now isn’t a good idea either. In this market, waiting is more beneficial than rushing.
What do you think—will $NEAR bounce from here to $3.264, or will $3.006 break and send it toward $2.870?
Follow for simple daily updates like this. I post every day.
If this analysis helped you, a small tip is appreciated 🙏
#NEAR #NearProtocol #Crypto #BinanceSquare
{spot}(NEARUSDT)
$NEAR is currently around $3.022, and it has seen a huge dump today.
Yesterday, the price went up to $3.477 and then dropped straight down. Now it’s very close to the low of $3.006. This means sellers took complete control from the top, and buyers didn’t get a chance to recover.
Looking at it, if $NEAR keeps holding above $3.006, we could see a small bounce from here to $3.264, which is also the Bollinger midline. And if a 4-hour candle closes above $3.264, the way will be clear toward $3.368.
But if it closes below $3.006, then a test of $2.870 below will be almost certain, so jumping into a long position there would be risky.
The RSI is now at 21, so it’s quite oversold. Selling in a panic right now isn’t a good idea either. In this market, waiting is more beneficial than rushing.
What do you think—will $NEAR bounce from here to $3.264, or will $3.006 break and send it toward $2.870?
Follow for simple daily updates like this. I post every day.
If this analysis helped you, a small tip is appreciated 🙏
#NEAR #NearProtocol #Crypto #BinanceSquare
Yesterday, the price went up to $3.477 and then dropped straight down. Now it’s very close to the low of $3.006. This means sellers took complete control from the top, and buyers didn’t get a chance to recover.
Looking at it, if $NEAR keeps holding above $3.006, we could see a small bounce from here to $3.264, which is also the Bollinger midline. And if a 4-hour candle closes above $3.264, the way will be clear toward $3.368.
But if it closes below $3.006, then a test of $2.870 below will be almost certain, so jumping into a long position there would be risky.
The RSI is now at 21, so it’s quite oversold. Selling in a panic right now isn’t a good idea either. In this market, waiting is more beneficial than rushing.
What do you think—will $NEAR bounce from here to $3.264, or will $3.006 break and send it toward $2.870?
Follow for simple daily updates like this. I post every day.
If this analysis helped you, a small tip is appreciated 🙏
#NEAR #NearProtocol #Crypto #BinanceSquare
GC-Crypto:
Valeu estamos de 👁
1
3
1.4k
·
--
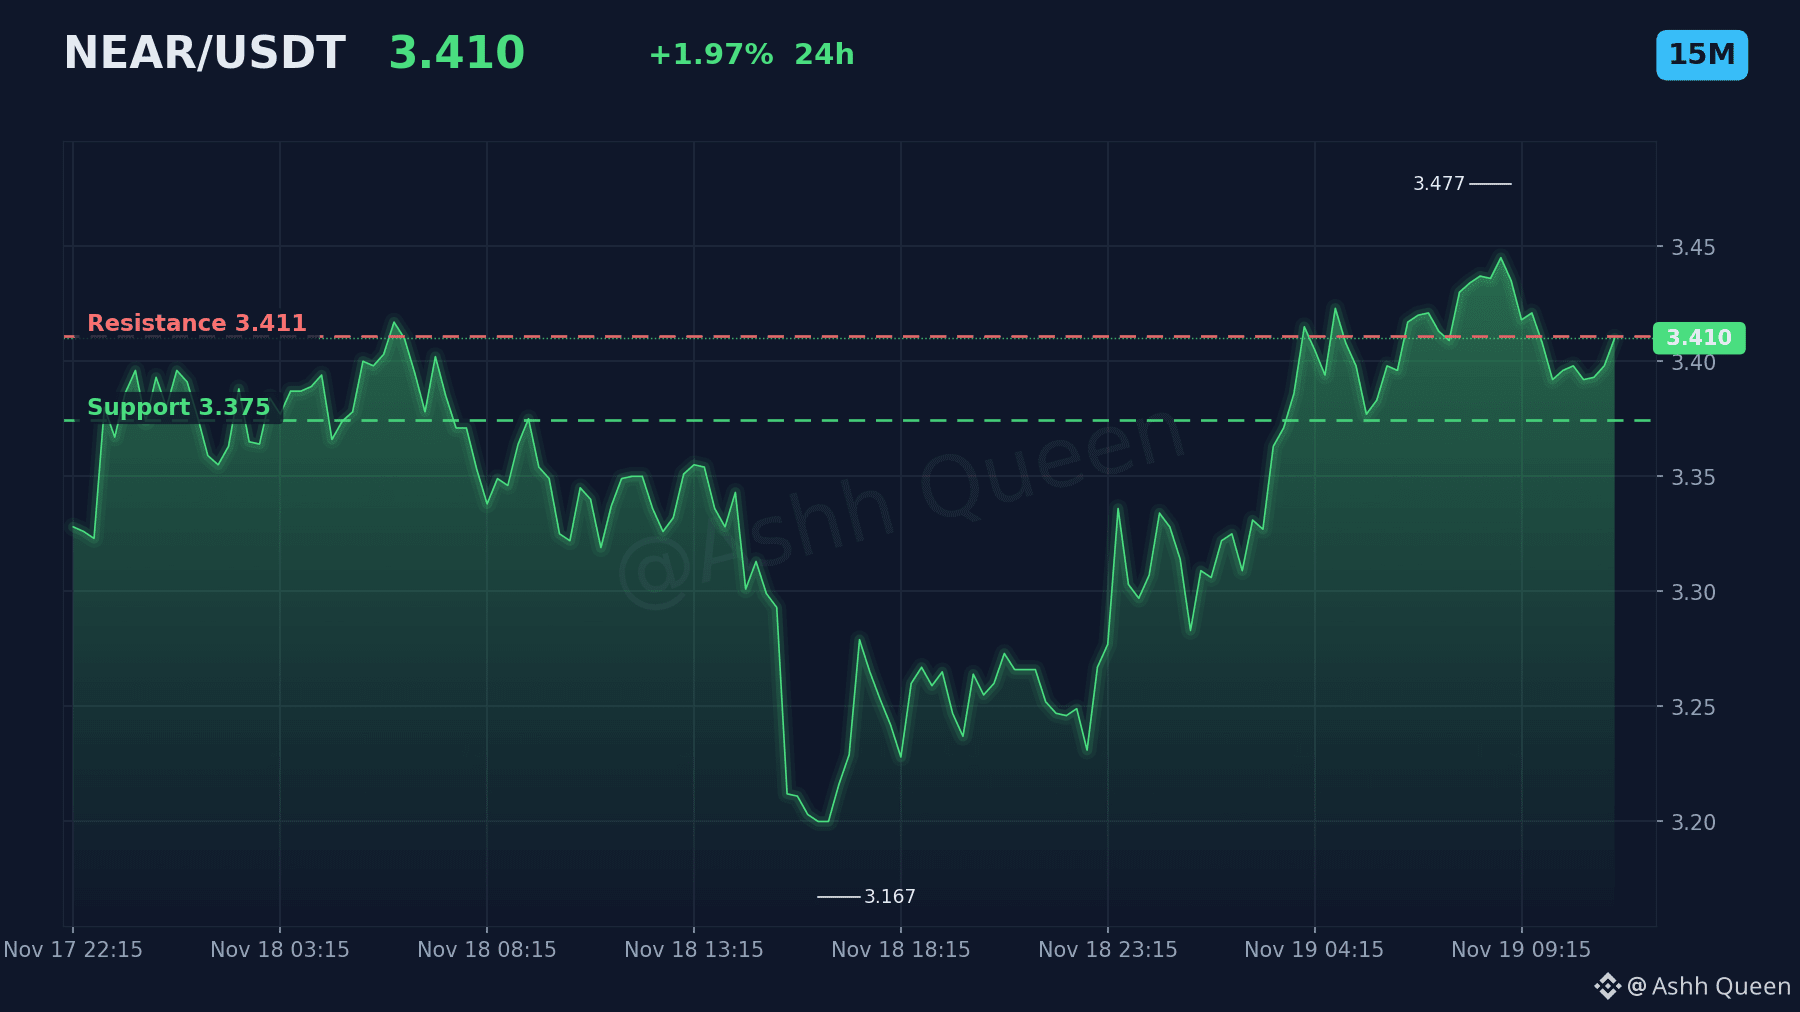
$NEAR is currently hovering at a critical technical junction. ⚡
The price at 3.410 maintains a neutral posture above VWAP at 3.385 and EMA50 at 3.379.
Trend: Bullish alignment
Momentum: Stalled MACD
Key levels: Resistance at 3.411, support at 3.375
Opportunity: Breaking resistance at 3.411
Risk: Falling below support at 3.375
With $NEAR testing resistance at 3.411, what specific price action would force you to change your mind about this neutral outlook? 🔥
#NEAR #NEARProtocol #CryptoAnalysis
DYOR. Size positions carefully and never trade with money you cannot afford to lose.
$NEAR is currently hovering at a critical technical junction. ⚡
The price at 3.410 maintains a neutral posture above VWAP at 3.385 and EMA50 at 3.379.
Trend: Bullish alignment
Momentum: Stalled MACD
Key levels: Resistance at 3.411, support at 3.375
Opportunity: Breaking resistance at 3.411
Risk: Falling below support at 3.375
With $NEAR testing resistance at 3.411, what specific price action would force you to change your mind about this neutral outlook? 🔥
#NEAR #NEARProtocol #CryptoAnalysis
DYOR. Size positions carefully and never trade with money you cannot afford to lose.
The price at 3.410 maintains a neutral posture above VWAP at 3.385 and EMA50 at 3.379.
Trend: Bullish alignment
Momentum: Stalled MACD
Key levels: Resistance at 3.411, support at 3.375
Opportunity: Breaking resistance at 3.411
Risk: Falling below support at 3.375
With $NEAR testing resistance at 3.411, what specific price action would force you to change your mind about this neutral outlook? 🔥
#NEAR #NEARProtocol #CryptoAnalysis
DYOR. Size positions carefully and never trade with money you cannot afford to lose.
24

·
--
🟢 Bullish
$NEAR Signal 🎯
Entry: $2.85
SL: $2.70
TP1: $3.10
TP2: $3.35
$NEAR Protocol is showing strength with ongoing network upgrades and technical developments, making it one to watch. Accumulating around support could pay off as ecosystem catalysts unfold.
#NEARProtocol #Altcoins
🟢 Bullish
$NEAR Signal 🎯
Entry: $2.85
SL: $2.70
TP1: $3.10
TP2: $3.35
$NEAR Protocol is showing strength with ongoing network upgrades and technical developments, making it one to watch. Accumulating around support could pay off as ecosystem catalysts unfold.
#NEARProtocol #Altcoins
$NEAR Signal 🎯
Entry: $2.85
SL: $2.70
TP1: $3.10
TP2: $3.35
$NEAR Protocol is showing strength with ongoing network upgrades and technical developments, making it one to watch. Accumulating around support could pay off as ecosystem catalysts unfold.
#NEARProtocol #Altcoins
2
·
--
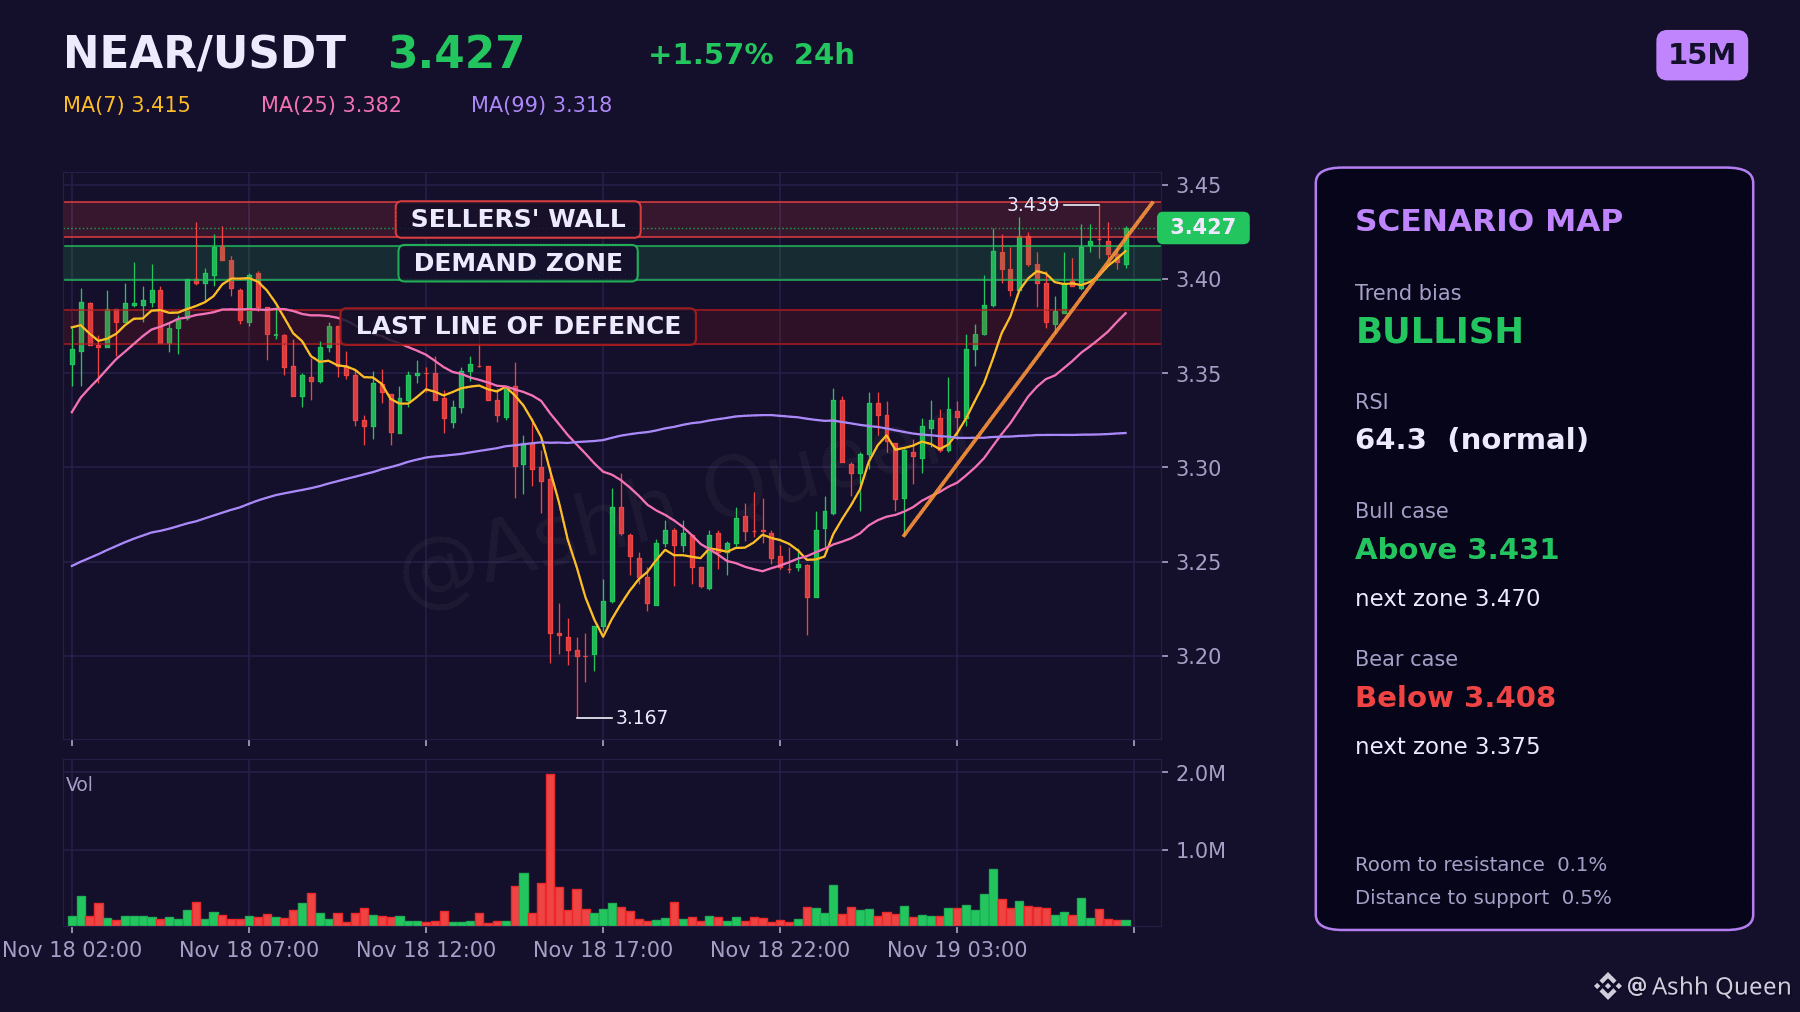
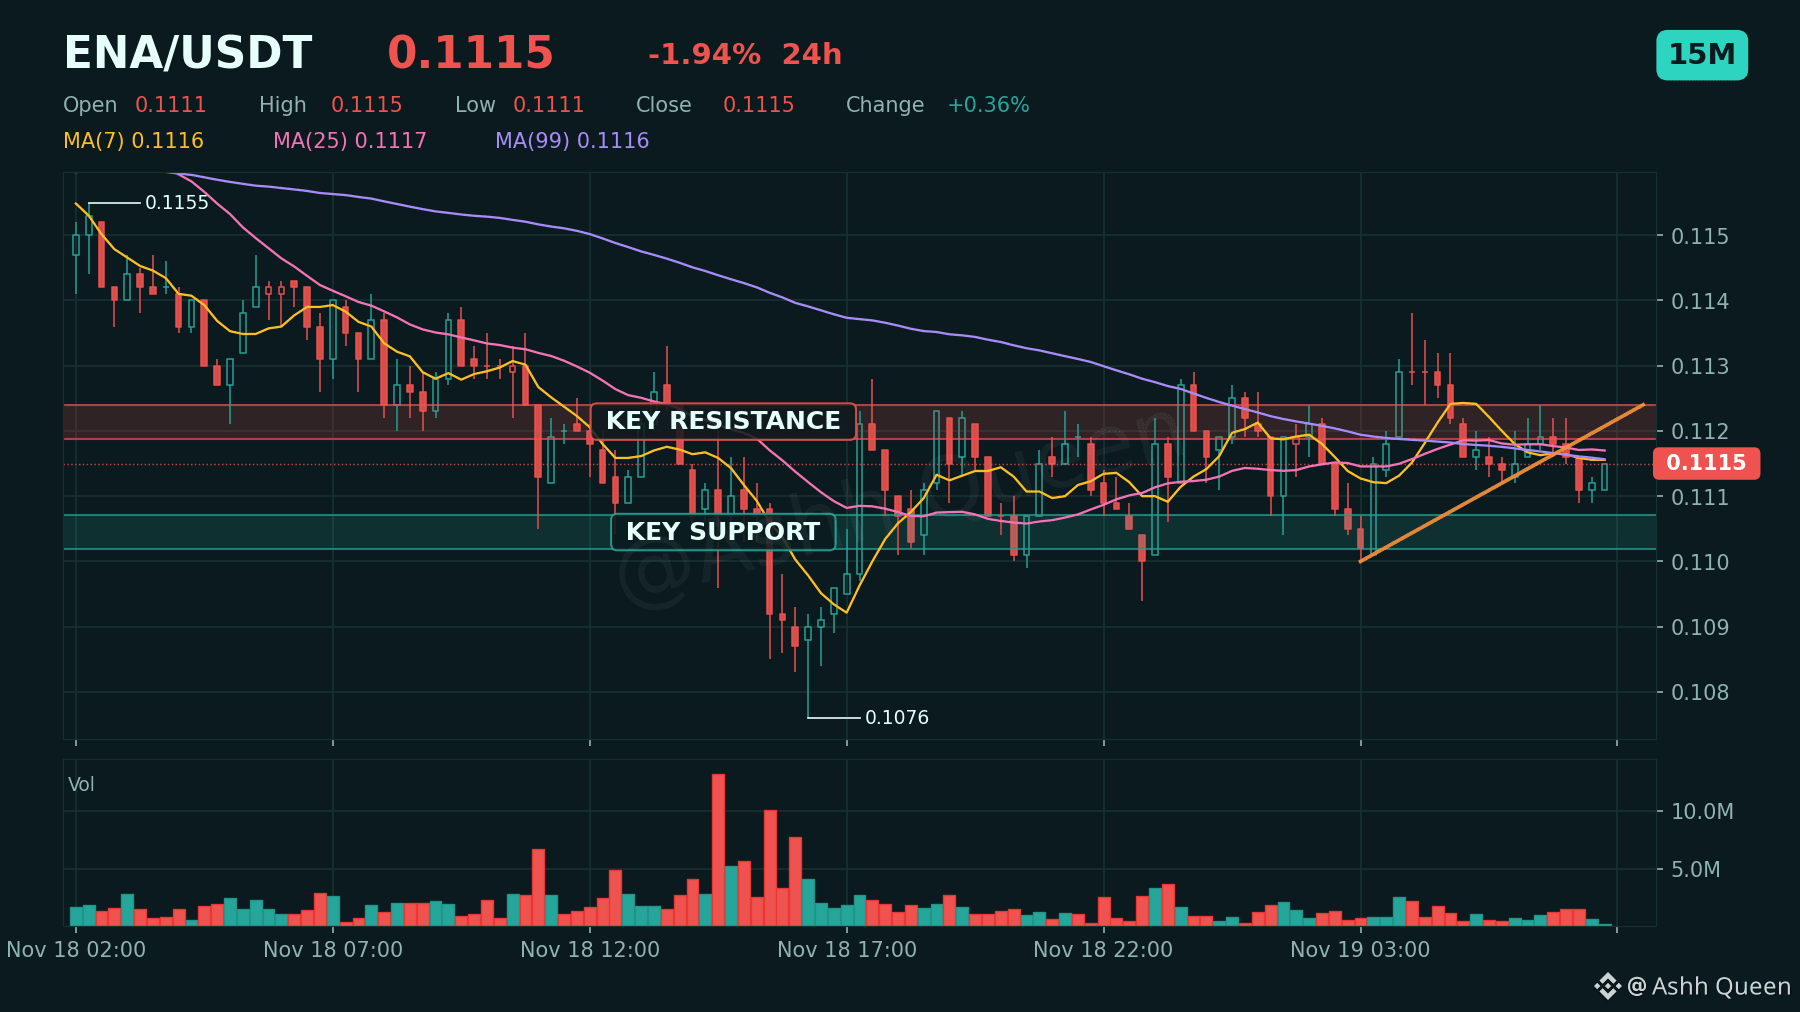
3.427 is the key figure keeping $NEAR afloat today.
Current data shows $NEAR holds above VWAP at 3.371 on the 15m chart, leaning bullish as long as EMA50 at 3.352 remains untouched.
Conversely, $ENA struggles below its own VWAP at 0.1119, reflecting a mild bearish bias with price capped under EMA50 at 0.1116. 🔥 ⚡
Which level are you watching on these charts and why? 🚀
#NEAR #ENA #NEARProtocol #Altcoins
Risk note: leverage magnifies losses. Plan the exit before the entry.
3.427 is the key figure keeping $NEAR afloat today.
Current data shows $NEAR holds above VWAP at 3.371 on the 15m chart, leaning bullish as long as EMA50 at 3.352 remains untouched.
Conversely, $ENA struggles below its own VWAP at 0.1119, reflecting a mild bearish bias with price capped under EMA50 at 0.1116. 🔥 ⚡
Which level are you watching on these charts and why? 🚀
#NEAR #ENA #NEARProtocol #Altcoins
Risk note: leverage magnifies losses. Plan the exit before the entry.
Current data shows $NEAR holds above VWAP at 3.371 on the 15m chart, leaning bullish as long as EMA50 at 3.352 remains untouched.
Conversely, $ENA struggles below its own VWAP at 0.1119, reflecting a mild bearish bias with price capped under EMA50 at 0.1116. 🔥 ⚡
Which level are you watching on these charts and why? 🚀
#NEAR #ENA #NEARProtocol #Altcoins
Risk note: leverage magnifies losses. Plan the exit before the entry.
10
·
--
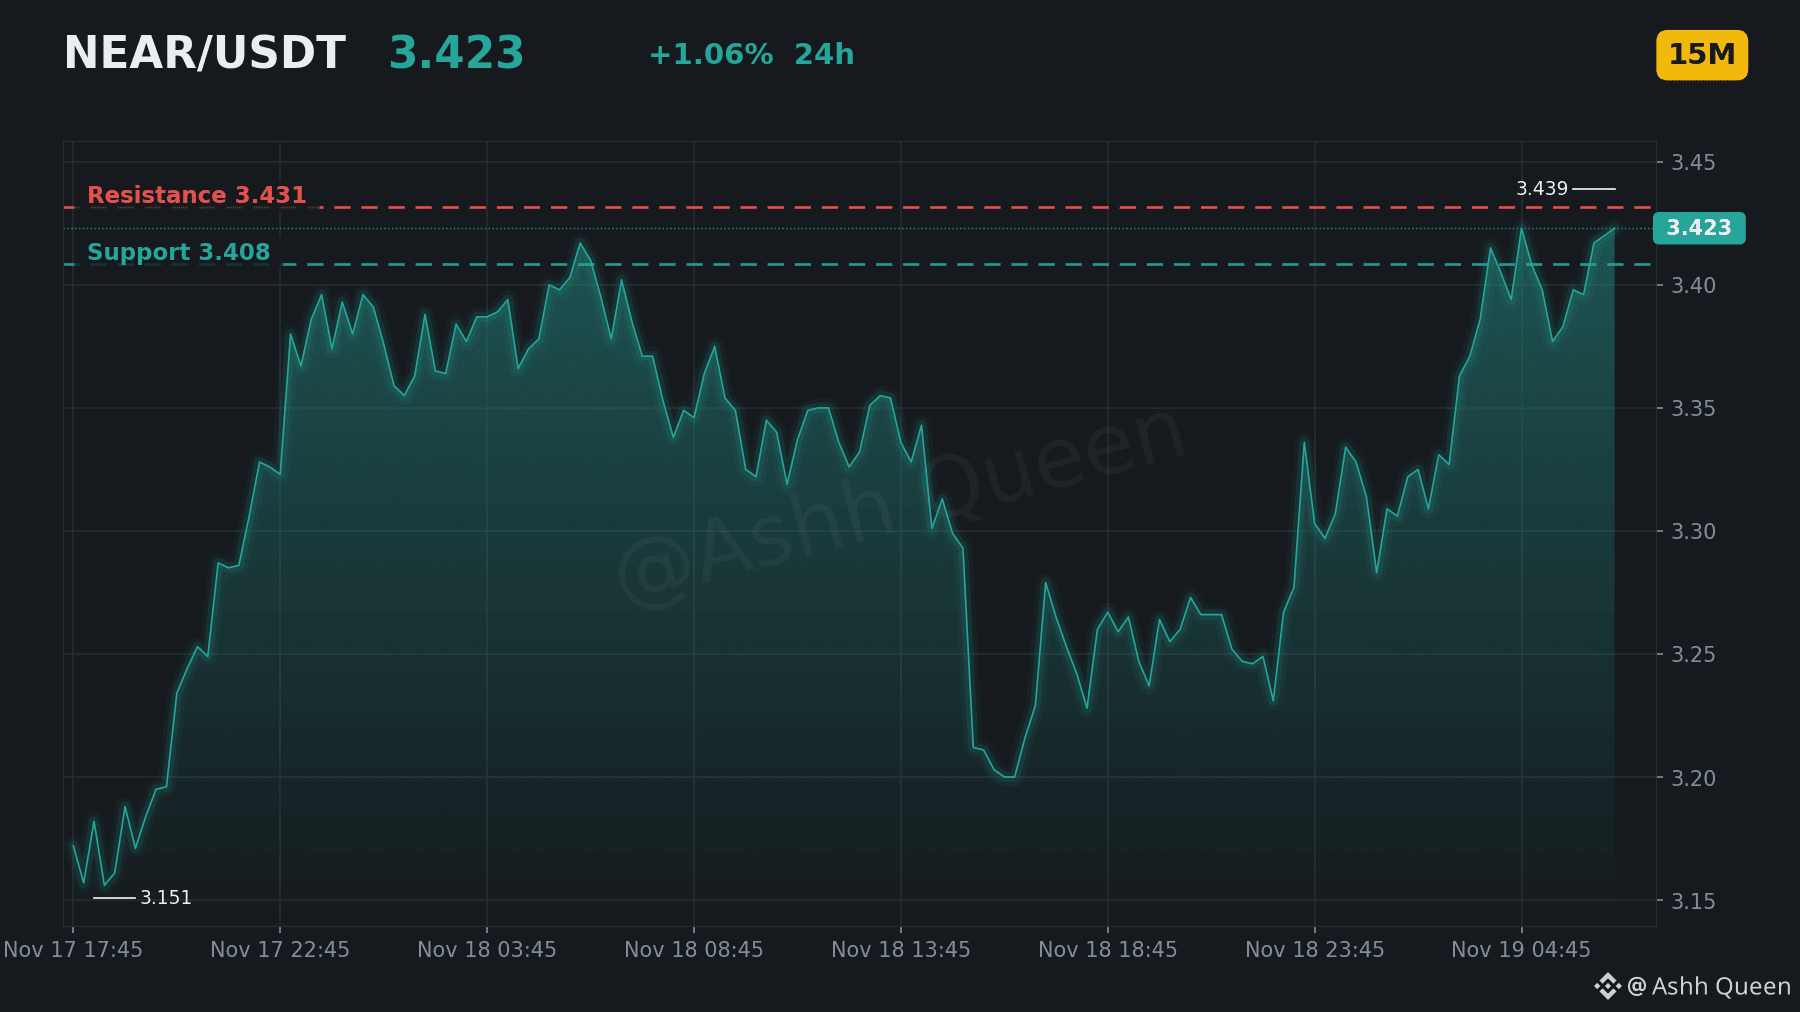
Most traders expect a cooldown on $NEAR, but the data suggests moderate bullish momentum is building instead. 🎯
Trend: Bullish above EMA50 (3.344).
Momentum: MACD histogram is positive with RSI at 64.99.
Key levels: Resistance at 3.431 and support at 3.408.
Opportunity: A breakout above resistance at 3.431 expands the upside.
Risk: A move below VWAP at 3.368 would invalidate the current setup for holders.
$NEAR is clearly respecting the trend, but the market remains cautious. 👀
Are you looking for a test of resistance at 3.431 or a pullback to support at 3.408? 🧭
#NEAR #Layer1 #BinanceSquare #NEARProtocol
Risk note: leverage magnifies losses. Plan the exit before the entry.
Most traders expect a cooldown on $NEAR , but the data suggests moderate bullish momentum is building instead. 🎯
Trend: Bullish above EMA50 (3.344).
Momentum: MACD histogram is positive with RSI at 64.99.
Key levels: Resistance at 3.431 and support at 3.408.
Opportunity: A breakout above resistance at 3.431 expands the upside.
Risk: A move below VWAP at 3.368 would invalidate the current setup for holders.
$NEAR is clearly respecting the trend, but the market remains cautious. 👀
Are you looking for a test of resistance at 3.431 or a pullback to support at 3.408? 🧭
#NEAR #Layer1 #BinanceSquare #NEARProtocol
Risk note: leverage magnifies losses. Plan the exit before the entry.
Trend: Bullish above EMA50 (3.344).
Momentum: MACD histogram is positive with RSI at 64.99.
Key levels: Resistance at 3.431 and support at 3.408.
Opportunity: A breakout above resistance at 3.431 expands the upside.
Risk: A move below VWAP at 3.368 would invalidate the current setup for holders.
$NEAR is clearly respecting the trend, but the market remains cautious. 👀
Are you looking for a test of resistance at 3.431 or a pullback to support at 3.408? 🧭
#NEAR #Layer1 #BinanceSquare #NEARProtocol
Risk note: leverage magnifies losses. Plan the exit before the entry.
7
·
--
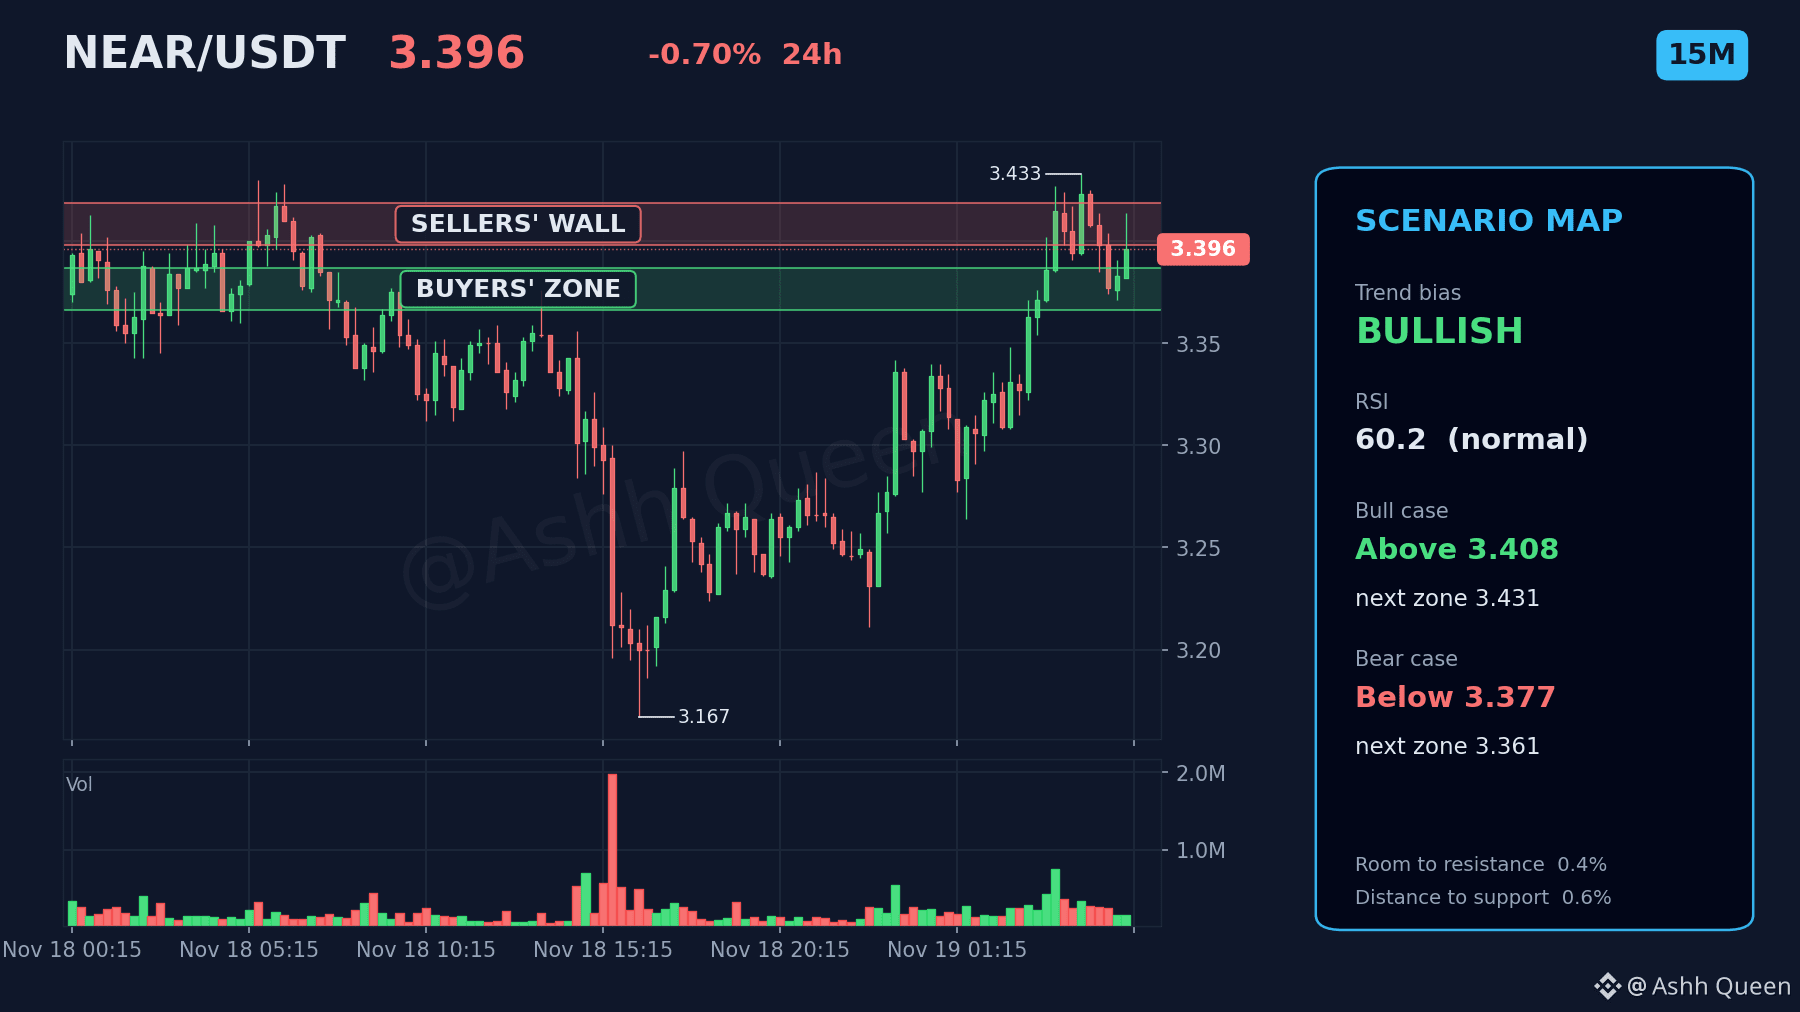
One level on $NEAR that traders should not ignore. ⚠️
Price holds above VWAP at 3.362 and EMA50 at 3.332 on this 15m chart. With room to resistance at 0.36% and distance to support at 0.57%, the downside risk currently outweighs the upside. 🛡️
What is your read on $NEAR and why? 🧐
#NEAR #NEARProtocol #CryptoAnalysis #CryptoMarket
Not financial advice. Protect your capital first, the next setup always comes.
One level on $NEAR that traders should not ignore. ⚠️
Price holds above VWAP at 3.362 and EMA50 at 3.332 on this 15m chart. With room to resistance at 0.36% and distance to support at 0.57%, the downside risk currently outweighs the upside. 🛡️
What is your read on $NEAR and why? 🧐
#NEAR #NEARProtocol #CryptoAnalysis #CryptoMarket
Not financial advice. Protect your capital first, the next setup always comes.
Price holds above VWAP at 3.362 and EMA50 at 3.332 on this 15m chart. With room to resistance at 0.36% and distance to support at 0.57%, the downside risk currently outweighs the upside. 🛡️
What is your read on $NEAR and why? 🧐
#NEAR #NEARProtocol #CryptoAnalysis #CryptoMarket
Not financial advice. Protect your capital first, the next setup always comes.
1
9

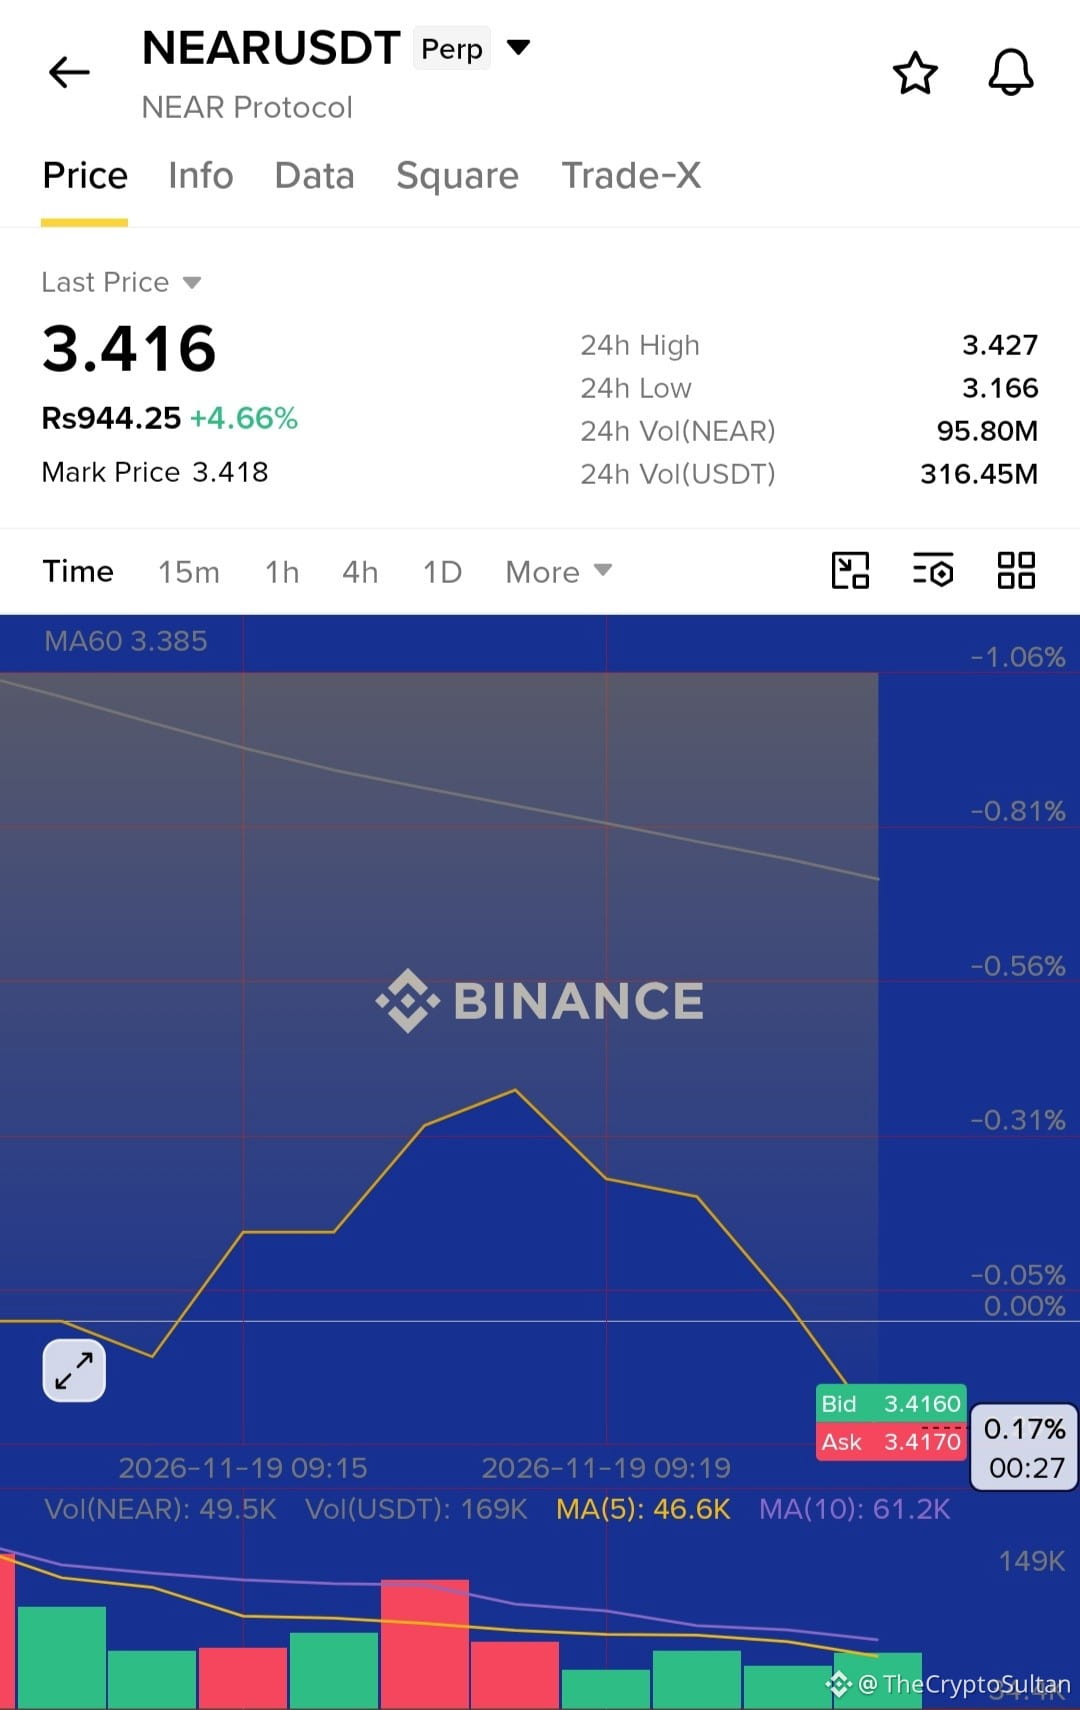
🚀 $NEAR BULLS ARE MAKING A STRONG COMEBACK! 🔥
NEAR is showing promising recovery signals as fresh buying pressure enters the market. Buyers are stepping in, strengthening the short-term bullish structure.
📊 LONG TRADE SETUP
🟢 Entry Zone: $3.3576 – $3.3680
🎯 Take Profit: $3.4200
🛑 Stop Loss: $3.3160
Key Levels to Watch:
$3.3450 – Critical support for bullish momentum.
$3.3740 – Breakout confirmation level.
$3.4200 – Initial upside target.
$3.4720 – Potential extended target if buying pressure continues.
📈 As long as NEAR holds above $3.3450, the bullish outlook remains intact. A confirmed breakout above $3.3740 could open the door for further upside.
🔥 Stay disciplined, manage your risk, and trade smart!
Buy & Trade $NEAR
#NEAR #nearprotocol #cryptotrading #AltcoinSeason #Binance
🚀 $NEAR BULLS ARE MAKING A STRONG COMEBACK! 🔥
NEAR is showing promising recovery signals as fresh buying pressure enters the market. Buyers are stepping in, strengthening the short-term bullish structure.
📊 LONG TRADE SETUP
🟢 Entry Zone: $3.3576 – $3.3680
🎯 Take Profit: $3.4200
🛑 Stop Loss: $3.3160
Key Levels to Watch:
$3.3450 – Critical support for bullish momentum.
$3.3740 – Breakout confirmation level.
$3.4200 – Initial upside target.
$3.4720 – Potential extended target if buying pressure continues.
📈 As long as NEAR holds above $3.3450, the bullish outlook remains intact. A confirmed breakout above $3.3740 could open the door for further upside.
🔥 Stay disciplined, manage your risk, and trade smart!
Buy & Trade $NEAR
#NEAR #nearprotocol #cryptotrading #AltcoinSeason #Binance
NEAR is showing promising recovery signals as fresh buying pressure enters the market. Buyers are stepping in, strengthening the short-term bullish structure.
📊 LONG TRADE SETUP
🟢 Entry Zone: $3.3576 – $3.3680
🎯 Take Profit: $3.4200
🛑 Stop Loss: $3.3160
Key Levels to Watch:
$3.3450 – Critical support for bullish momentum.
$3.3740 – Breakout confirmation level.
$3.4200 – Initial upside target.
$3.4720 – Potential extended target if buying pressure continues.
📈 As long as NEAR holds above $3.3450, the bullish outlook remains intact. A confirmed breakout above $3.3740 could open the door for further upside.
🔥 Stay disciplined, manage your risk, and trade smart!
Buy & Trade $NEAR
#NEAR #nearprotocol #cryptotrading #AltcoinSeason #Binance
9

·
--
$NEAR tests $3.00: drops 11.2% to $3.039 and has already touched $3.006, its low for the day. It’s the steepest drop among the hour’s trending tokens.
24-hour Binance spot volume: $88.8M. The market is in extreme fear (index 12), and NEAR is leading the sell-off: it was at $3.477 and found no buyers all day.
In its favor: if $3.00 holds, the rebound could be quick given how oversold it is. Against it: the candle is vertical, with no sign of slowing, and losing $3.00 could open the door to further declines.
🔴 $NEAR /USDT · Bias: SHORT
Sellers in control: -11.2% on high volume, with the price at the day’s low.
Entry: $3.039
TP1: $2.978 (-2.0%)
TP2: $2.917 (-4.0%)
TP3: $2.857 (-6.0%)
SL: $3.10 (+2.0%)
Note: Medium conviction. Small position size.
Why: Break below the psychological $3.00 level on high volume during a day of extreme fear.
Plan: Close 50% at TP1, 25% at TP2, 25% at TP3, and move the stop to entry after TP1.
Will $3.00 stop the sell-off, or is NEAR heading to $2.92? 👇
#NEARProtocol
This is not financial advice. Do your own research.
$NEAR tests $3.00: drops 11.2% to $3.039 and has already touched $3.006, its low for the day. It’s the steepest drop among the hour’s trending tokens.
24-hour Binance spot volume: $88.8M. The market is in extreme fear (index 12), and NEAR is leading the sell-off: it was at $3.477 and found no buyers all day.
In its favor: if $3.00 holds, the rebound could be quick given how oversold it is. Against it: the candle is vertical, with no sign of slowing, and losing $3.00 could open the door to further declines.
🔴 $NEAR /USDT · Bias: SHORT
Sellers in control: -11.2% on high volume, with the price at the day’s low.
Entry: $3.039
TP1: $2.978 (-2.0%)
TP2: $2.917 (-4.0%)
TP3: $2.857 (-6.0%)
SL: $3.10 (+2.0%)
Note: Medium conviction. Small position size.
Why: Break below the psychological $3.00 level on high volume during a day of extreme fear.
Plan: Close 50% at TP1, 25% at TP2, 25% at TP3, and move the stop to entry after TP1.
Will $3.00 stop the sell-off, or is NEAR heading to $2.92? 👇
#NEARProtocol
This is not financial advice. Do your own research.
24-hour Binance spot volume: $88.8M. The market is in extreme fear (index 12), and NEAR is leading the sell-off: it was at $3.477 and found no buyers all day.
In its favor: if $3.00 holds, the rebound could be quick given how oversold it is. Against it: the candle is vertical, with no sign of slowing, and losing $3.00 could open the door to further declines.
🔴 $NEAR /USDT · Bias: SHORT
Sellers in control: -11.2% on high volume, with the price at the day’s low.
Entry: $3.039
TP1: $2.978 (-2.0%)
TP2: $2.917 (-4.0%)
TP3: $2.857 (-6.0%)
SL: $3.10 (+2.0%)
Note: Medium conviction. Small position size.
Why: Break below the psychological $3.00 level on high volume during a day of extreme fear.
Plan: Close 50% at TP1, 25% at TP2, 25% at TP3, and move the stop to entry after TP1.
Will $3.00 stop the sell-off, or is NEAR heading to $2.92? 👇
#NEARProtocol
This is not financial advice. Do your own research.
1
88
Log in to explore more content
Join global crypto users on Binance Square
⚡️ Get latest and useful information about crypto.
💬 Trusted by the world’s largest crypto exchange.
👍 Discover real insights from verified creators.
Email / Phone number
Trending Topics
1
#CanBTCReboundAfterFallingBelow60K?
0 views
115 Discussing
2
#GlobalStocksFaceLongestLosingStreakSince2023
0 views
268 Discussing
3
#AnthropicPlungesTowardIPOPriceonDay2
0 views
43 Discussing
4
#GaoTengBitcoinETFListsOnHKEX
0 views
264 Discussing
5
#TradFiForBeginners
946,825 views
5,525 Discussing
6
#NvidiaBoardReportedlySplitOverHuang’sReturn
258,674 views
2,405 Discussing
7
#TetherBurns8BillionUSDTInPast20Days
0 views
101 Discussing
8
#BitcoinWalletSignatureFlawExploitableWithinSeconds
0 views
44 Discussing
9
#CanGTA6'sLaunchLiftTTWOShares?
207,868 views
1,711 Discussing
10
#HongKongProposesSFCLicensingForFourVirtualAssetServices
404 views
32 Discussing