
#gwei
gwei
812,245 views
7,029 Discussing
Hot
Latest

·
--
$GWEI +6.86% | $BROCCOLI +6.85% | $FROGGIE +6.66%
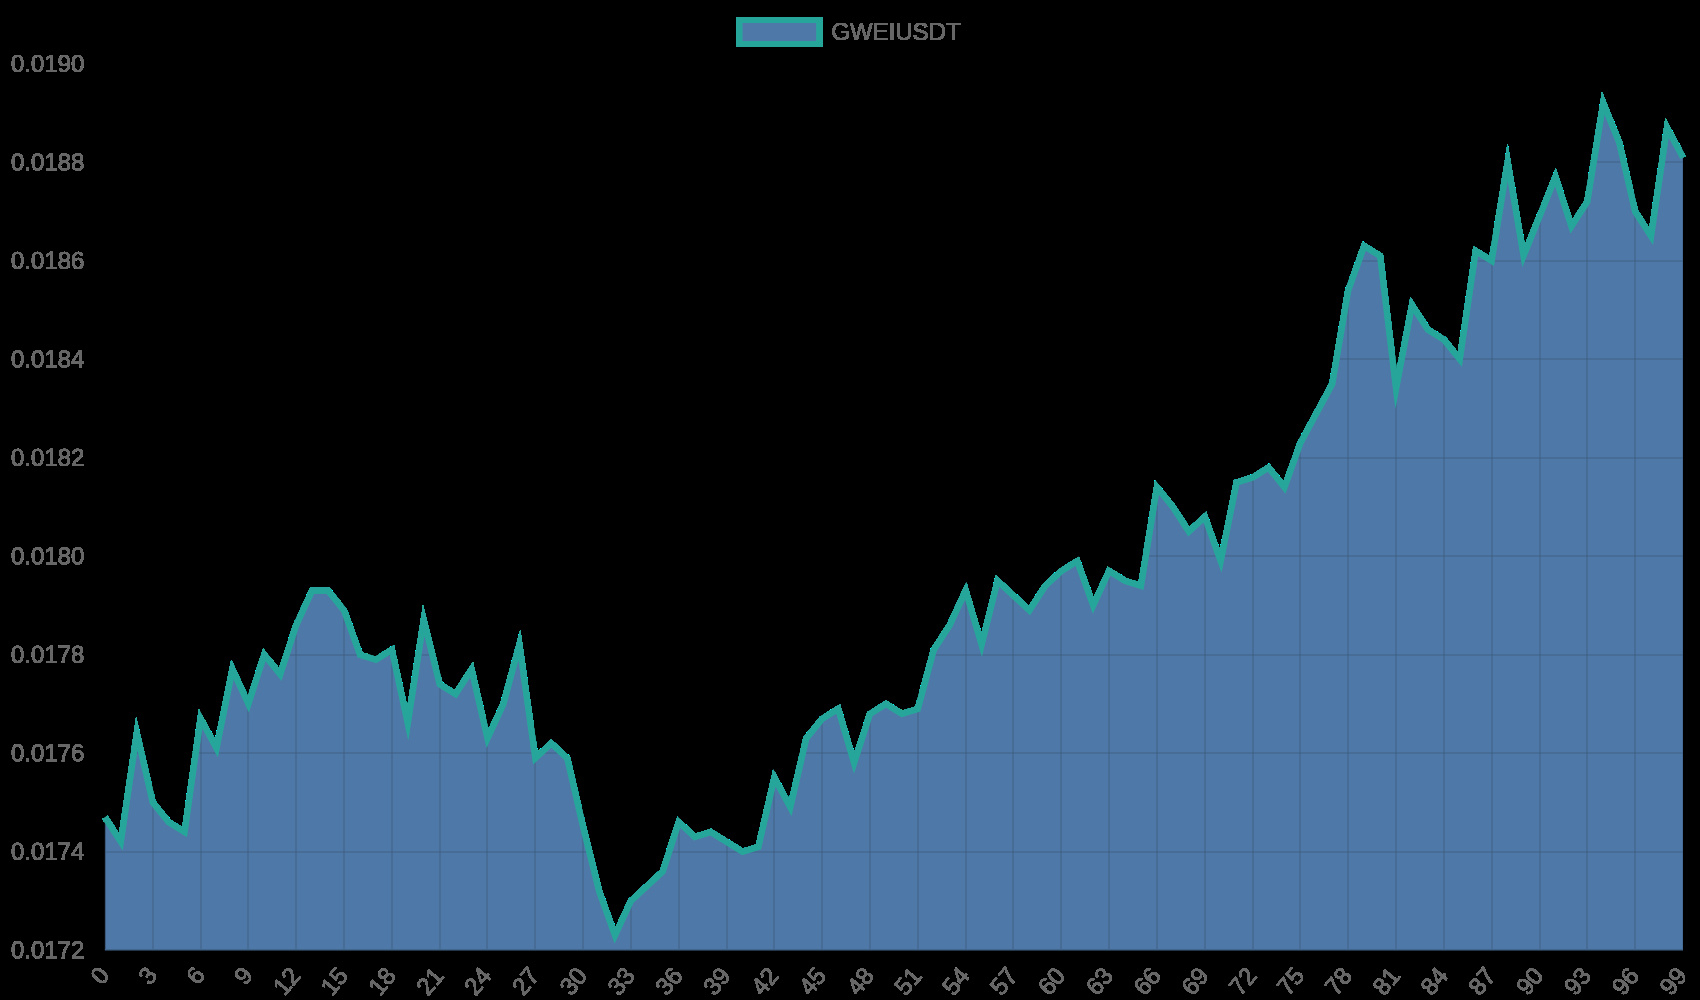
#GWEI on BSC nudged to $0.0187, up +6.86% with $3.4 M volume and a $39.6 M market cap. The bump shows solid buying pressure for this on‑chain Alpha token.
BROCCOLI on BSC ticked higher to $0.00258058, up +6.85% on just $9.8 K of trades, giving it a $475.5 K market cap. Its ultra‑thin liquidity could make the rally fragile.
FROGGIE on BSC rose to $0.0155, up +6.66% with $70.0 K volume and a $15.5 M market cap. Momentum is building, but the modest depth means price swings may still be sharp.
The contrast between BROCCOLI’s sub‑$1 M cap and the larger caps of GWEI and FROGGIE is worth watching.
#BinanceAlpha #TopGainers #Write2Earn #Binance
$GWEI +6.86% | $BROCCOLI +6.85% | $FROGGIE +6.66%
#GWEI on BSC nudged to $0.0187, up +6.86% with $3.4 M volume and a $39.6 M market cap. The bump shows solid buying pressure for this on‑chain Alpha token.
BROCCOLI on BSC ticked higher to $0.00258058, up +6.85% on just $9.8 K of trades, giving it a $475.5 K market cap. Its ultra‑thin liquidity could make the rally fragile.
FROGGIE on BSC rose to $0.0155, up +6.66% with $70.0 K volume and a $15.5 M market cap. Momentum is building, but the modest depth means price swings may still be sharp.
The contrast between BROCCOLI’s sub‑$1 M cap and the larger caps of GWEI and FROGGIE is worth watching.
#BinanceAlpha #TopGainers #Write2Earn #Binance
#GWEI on BSC nudged to $0.0187, up +6.86% with $3.4 M volume and a $39.6 M market cap. The bump shows solid buying pressure for this on‑chain Alpha token.
BROCCOLI on BSC ticked higher to $0.00258058, up +6.85% on just $9.8 K of trades, giving it a $475.5 K market cap. Its ultra‑thin liquidity could make the rally fragile.
FROGGIE on BSC rose to $0.0155, up +6.66% with $70.0 K volume and a $15.5 M market cap. Momentum is building, but the modest depth means price swings may still be sharp.
The contrast between BROCCOLI’s sub‑$1 M cap and the larger caps of GWEI and FROGGIE is worth watching.
#BinanceAlpha #TopGainers #Write2Earn #Binance

·
--
$GWEI +8.10% | $BROCCOLI +8.01% | $TAG +7.55%
#GWEI on BSC nudged up to $0.0188, gaining +8.10% with $3.4 M volume and a $39.8 M market cap.
BROCCOLI on BSC rose to $0.00486751, up +8.01% on modest $58.5 K volume and a $4.9 M market cap.
TAG on BSC ticked higher to $0.00070776, +7.55% backed by $1.1 M volume and a $76.7 M market cap.
⚠️ The thin $58.5 K depth for BROCCOLI suggests its surge could reverse quickly.
#BinanceAlpha #TopGainers #Write2Earn #Binance
$GWEI +8.10% | $BROCCOLI +8.01% | $TAG +7.55%
#GWEI on BSC nudged up to $0.0188, gaining +8.10% with $3.4 M volume and a $39.8 M market cap.
BROCCOLI on BSC rose to $0.00486751, up +8.01% on modest $58.5 K volume and a $4.9 M market cap.
TAG on BSC ticked higher to $0.00070776, +7.55% backed by $1.1 M volume and a $76.7 M market cap.
⚠️ The thin $58.5 K depth for BROCCOLI suggests its surge could reverse quickly.
#BinanceAlpha #TopGainers #Write2Earn #Binance
#GWEI on BSC nudged up to $0.0188, gaining +8.10% with $3.4 M volume and a $39.8 M market cap.
BROCCOLI on BSC rose to $0.00486751, up +8.01% on modest $58.5 K volume and a $4.9 M market cap.
TAG on BSC ticked higher to $0.00070776, +7.55% backed by $1.1 M volume and a $76.7 M market cap.
⚠️ The thin $58.5 K depth for BROCCOLI suggests its surge could reverse quickly.
#BinanceAlpha #TopGainers #Write2Earn #Binance
1

·
--
🚨 BINANCE ALPHA WATCHLIST: GWEI | TMX | IN
Three tokens. Three opportunities. One important rule: wait for confirmation before entering. 👀
⚡ $GWEI (ETHGas)
* Facing strong selling pressure.
* Watch the $0.017 support area.
* A volume-backed recovery could bring bullish momentum.
* Losing support may lead to further downside.
🔥 $TMX
* Trading near depressed levels.
* Needs stronger buying volume.
* Watch for a recovery and trend reversal.
* Avoid chasing sudden pumps.
🚀 $IN
* Watch liquidity and trading volume.
* Look for higher highs and stronger buying pressure.
* A breakout needs confirmation before entry.
📊 Today's Trading Strategy ✅ Monitor volume spikes. ✅ Watch important support and resistance. ✅ Wait for bullish confirmation. ✅ Keep stop-loss discipline.
💬 Which token has the strongest comeback potential?
⚡ GWEI | 🔥 TMX | 🚀 IN
What's your pick? Drop it below! 👇
⚠️ High volatility. Not financial advice. DYOR.
#gwei #TMX #Binance #crypto #TrendingTopic
— Maanfar ✌️ Follow for more crypto market updates and trading ideas. 🚀
{future}(GWEIUSDT)
{alpha}(560x3c2f61f2e27c865981d2e7aaf6b2cdf823030039)
{future}(INUSDT)
🚨 BINANCE ALPHA WATCHLIST: GWEI | TMX | IN
Three tokens. Three opportunities. One important rule: wait for confirmation before entering. 👀
⚡ $GWEI (ETHGas)
* Facing strong selling pressure.
* Watch the $0.017 support area.
* A volume-backed recovery could bring bullish momentum.
* Losing support may lead to further downside.
🔥 $TMX
* Trading near depressed levels.
* Needs stronger buying volume.
* Watch for a recovery and trend reversal.
* Avoid chasing sudden pumps.
🚀 $IN
* Watch liquidity and trading volume.
* Look for higher highs and stronger buying pressure.
* A breakout needs confirmation before entry.
📊 Today's Trading Strategy ✅ Monitor volume spikes. ✅ Watch important support and resistance. ✅ Wait for bullish confirmation. ✅ Keep stop-loss discipline.
💬 Which token has the strongest comeback potential?
⚡ GWEI | 🔥 TMX | 🚀 IN
What's your pick? Drop it below! 👇
⚠️ High volatility. Not financial advice. DYOR.
#gwei #TMX #Binance #crypto #TrendingTopic
— Maanfar ✌️ Follow for more crypto market updates and trading ideas. 🚀
Three tokens. Three opportunities. One important rule: wait for confirmation before entering. 👀
⚡ $GWEI (ETHGas)
* Facing strong selling pressure.
* Watch the $0.017 support area.
* A volume-backed recovery could bring bullish momentum.
* Losing support may lead to further downside.
🔥 $TMX
* Trading near depressed levels.
* Needs stronger buying volume.
* Watch for a recovery and trend reversal.
* Avoid chasing sudden pumps.
🚀 $IN
* Watch liquidity and trading volume.
* Look for higher highs and stronger buying pressure.
* A breakout needs confirmation before entry.
📊 Today's Trading Strategy ✅ Monitor volume spikes. ✅ Watch important support and resistance. ✅ Wait for bullish confirmation. ✅ Keep stop-loss discipline.
💬 Which token has the strongest comeback potential?
⚡ GWEI | 🔥 TMX | 🚀 IN
What's your pick? Drop it below! 👇
⚠️ High volatility. Not financial advice. DYOR.
#gwei #TMX #Binance #crypto #TrendingTopic
— Maanfar ✌️ Follow for more crypto market updates and trading ideas. 🚀
2
848

·
--
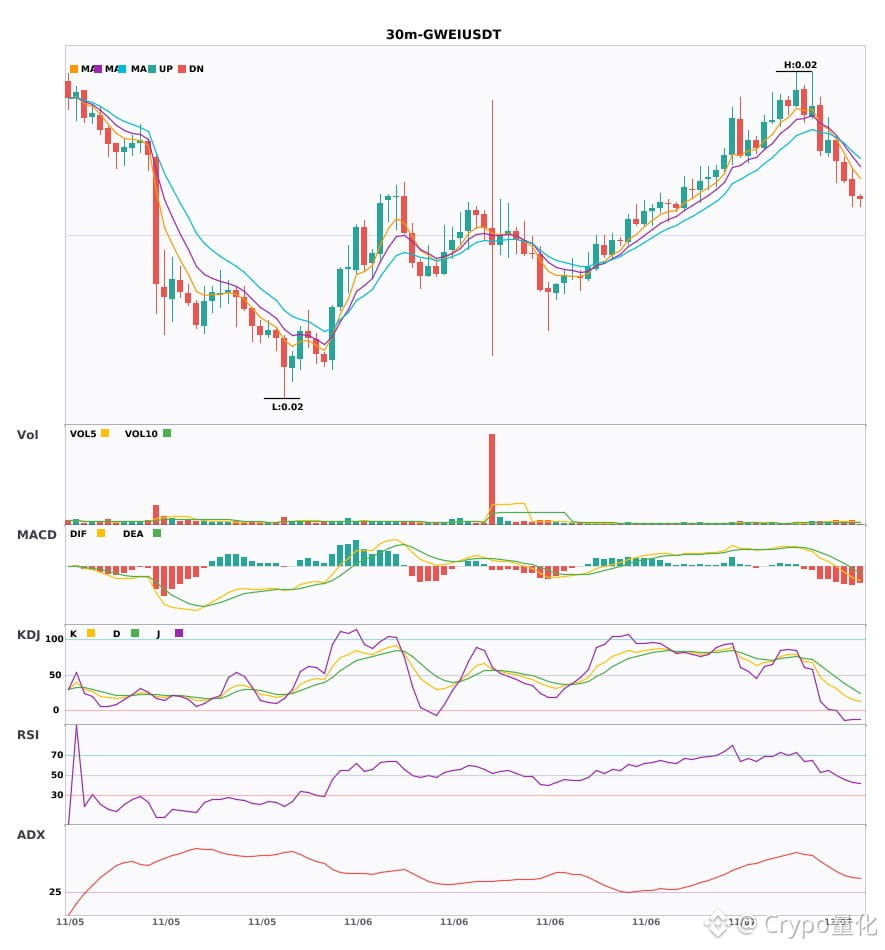
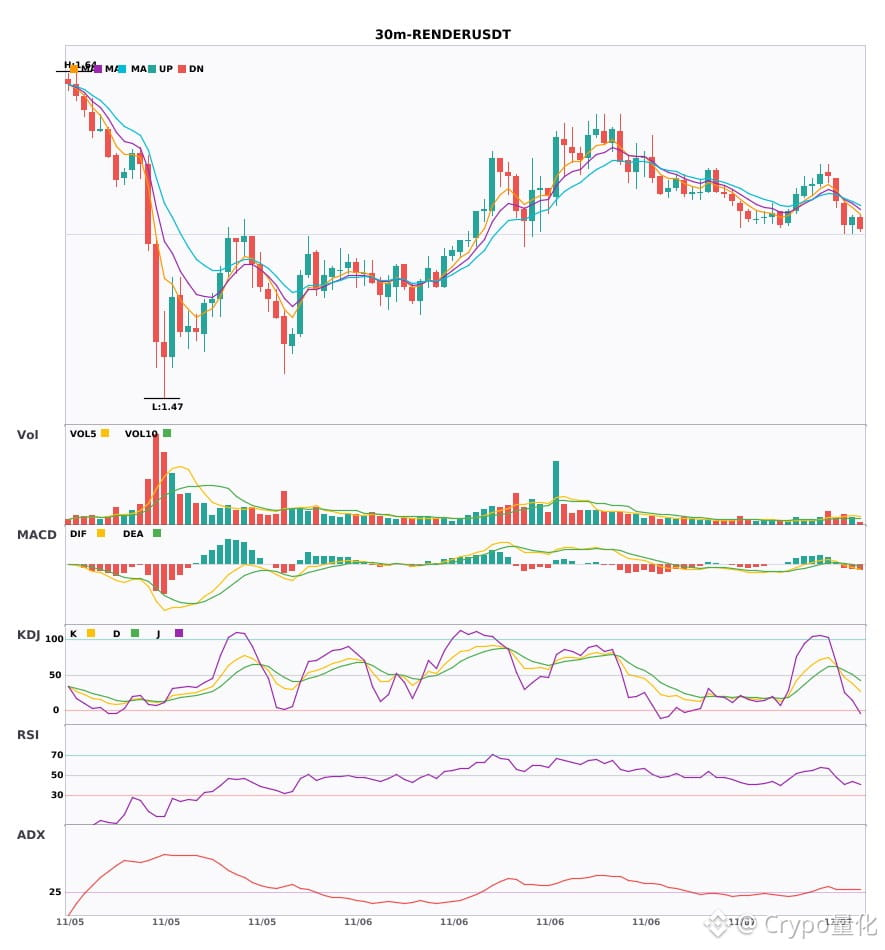
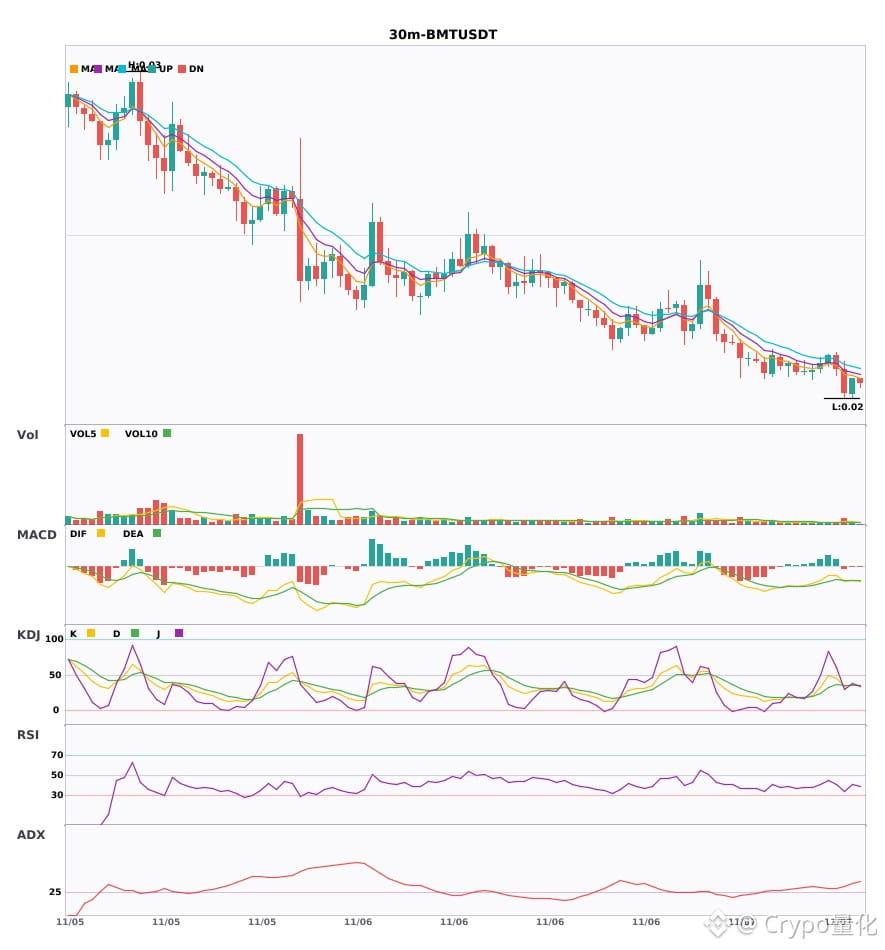
$GWEI / $RENDER / $BMT 30-minute technical indicators are weakening in sync. Be alert to risk 🔥
════════════════════
🟢 $GWEI 30-minute bearish signal
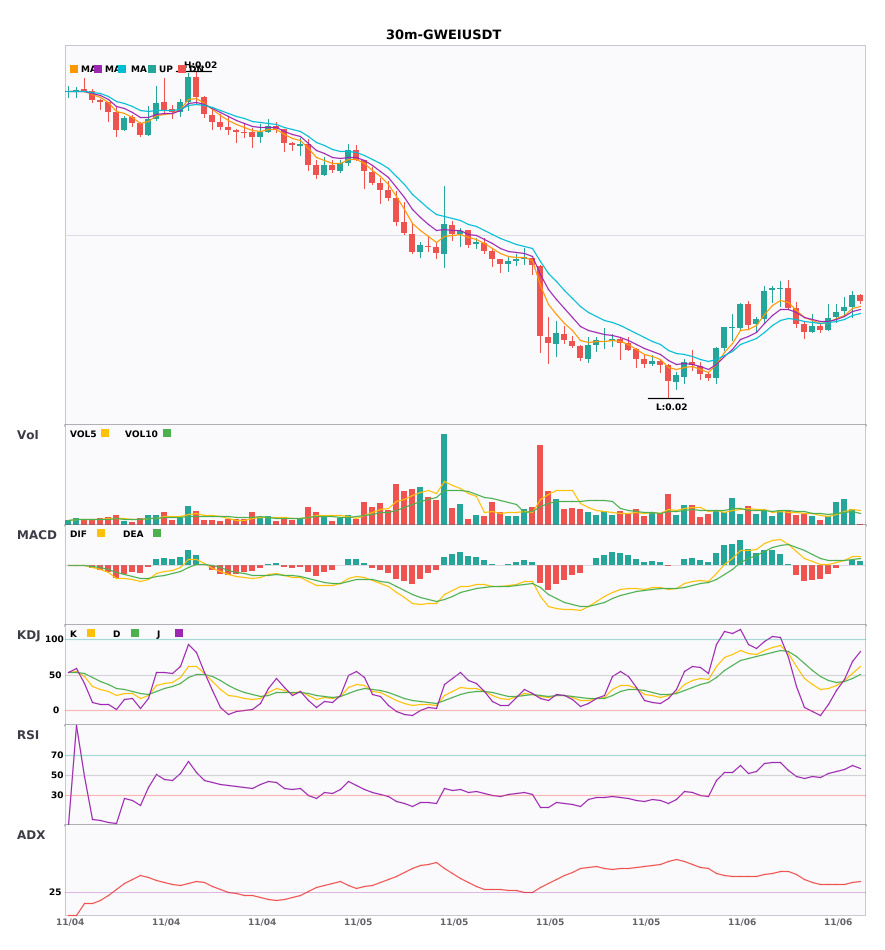
⚠️Technical analysis: ADX(44) indicates a clear trend | MACD is bearish, the trend is weak, and momentum is increasing | EMA5 < EMA8 < EMA13, bearish alignment | KDJ is weak, with bears in control (K: 21.0, D: 38.0) | Volume increased (1.8x)
════════════════════
🟢 $RENDER 30-minute bearish signal
⚠️Technical analysis: ADX(32) indicates a clear trend | MACD bearish cross below zero, bearish momentum accelerating | EMA5 crossed below EMA8, short-term outlook turns bearish | KDJ bearish cross, short-term outlook is bearish (K: 46.1, D: 56.7) | Volume increased (1.6x)
════════════════════
🟢 $BMT 30-minute bearish signal
⚠️Technical analysis: ADX(34) indicates a clear trend | MACD bearish cross below zero, bearish momentum accelerating | EMA5 < EMA8 < EMA13, bearish alignment | KDJ bearish cross, short-term outlook is bearish (K: 33.4, D: 35.3) | Volume increased (2.1x)
════════════════════
🔔 Follow to get first-hand market updates 🔔
#技术分析 #GWEI #RENDER #BMT
📌 When trading, pay attention to whether the candlestick pattern aligns
$GWEI / $RENDER / $BMT 30-minute technical indicators are weakening in sync. Be alert to risk 🔥
════════════════════
🟢 $GWEI 30-minute bearish signal
⚠️Technical analysis: ADX(44) indicates a clear trend | MACD is bearish, the trend is weak, and momentum is increasing | EMA5 < EMA8 < EMA13, bearish alignment | KDJ is weak, with bears in control (K: 21.0, D: 38.0) | Volume increased (1.8x)
════════════════════
🟢 $RENDER 30-minute bearish signal
⚠️Technical analysis: ADX(32) indicates a clear trend | MACD bearish cross below zero, bearish momentum accelerating | EMA5 crossed below EMA8, short-term outlook turns bearish | KDJ bearish cross, short-term outlook is bearish (K: 46.1, D: 56.7) | Volume increased (1.6x)
════════════════════
🟢 $BMT 30-minute bearish signal
⚠️Technical analysis: ADX(34) indicates a clear trend | MACD bearish cross below zero, bearish momentum accelerating | EMA5 < EMA8 < EMA13, bearish alignment | KDJ bearish cross, short-term outlook is bearish (K: 33.4, D: 35.3) | Volume increased (2.1x)
════════════════════
🔔 Follow to get first-hand market updates 🔔
#技术分析 #GWEI #RENDER #BMT
📌 When trading, pay attention to whether the candlestick pattern aligns
════════════════════
🟢 $GWEI 30-minute bearish signal
⚠️Technical analysis: ADX(44) indicates a clear trend | MACD is bearish, the trend is weak, and momentum is increasing | EMA5 < EMA8 < EMA13, bearish alignment | KDJ is weak, with bears in control (K: 21.0, D: 38.0) | Volume increased (1.8x)
════════════════════
🟢 $RENDER 30-minute bearish signal
⚠️Technical analysis: ADX(32) indicates a clear trend | MACD bearish cross below zero, bearish momentum accelerating | EMA5 crossed below EMA8, short-term outlook turns bearish | KDJ bearish cross, short-term outlook is bearish (K: 46.1, D: 56.7) | Volume increased (1.6x)
════════════════════
🟢 $BMT 30-minute bearish signal
⚠️Technical analysis: ADX(34) indicates a clear trend | MACD bearish cross below zero, bearish momentum accelerating | EMA5 < EMA8 < EMA13, bearish alignment | KDJ bearish cross, short-term outlook is bearish (K: 33.4, D: 35.3) | Volume increased (2.1x)
════════════════════
🔔 Follow to get first-hand market updates 🔔
#技术分析 #GWEI #RENDER #BMT
📌 When trading, pay attention to whether the candlestick pattern aligns
5
·
--
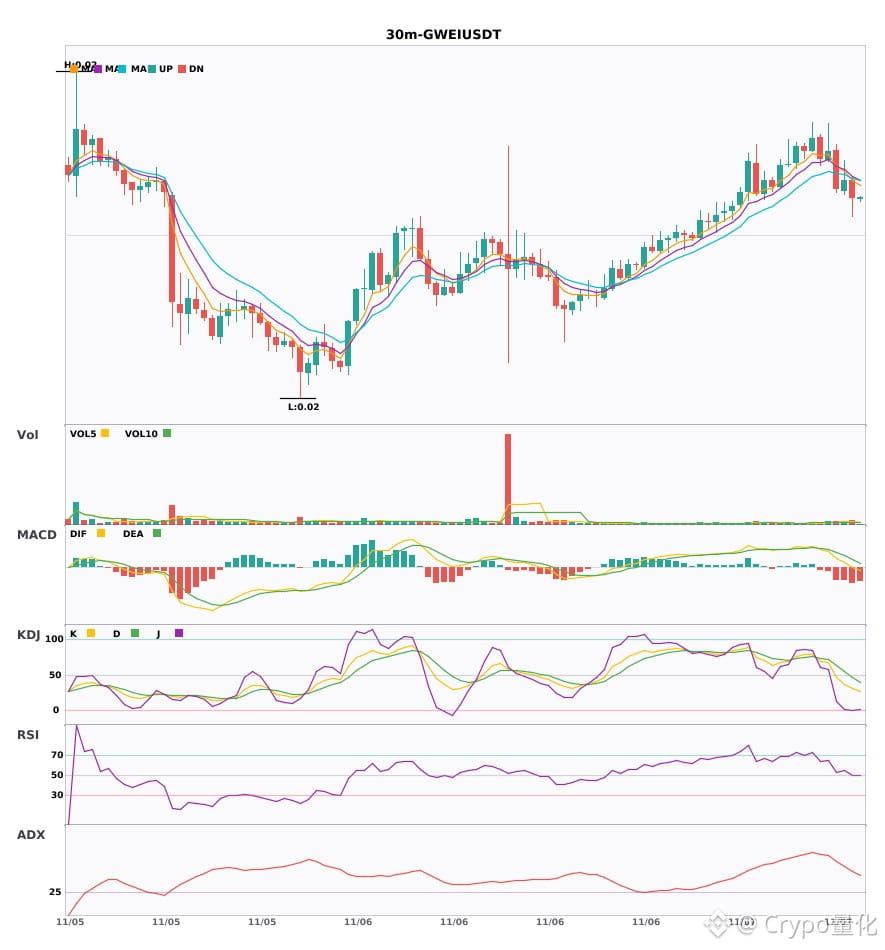
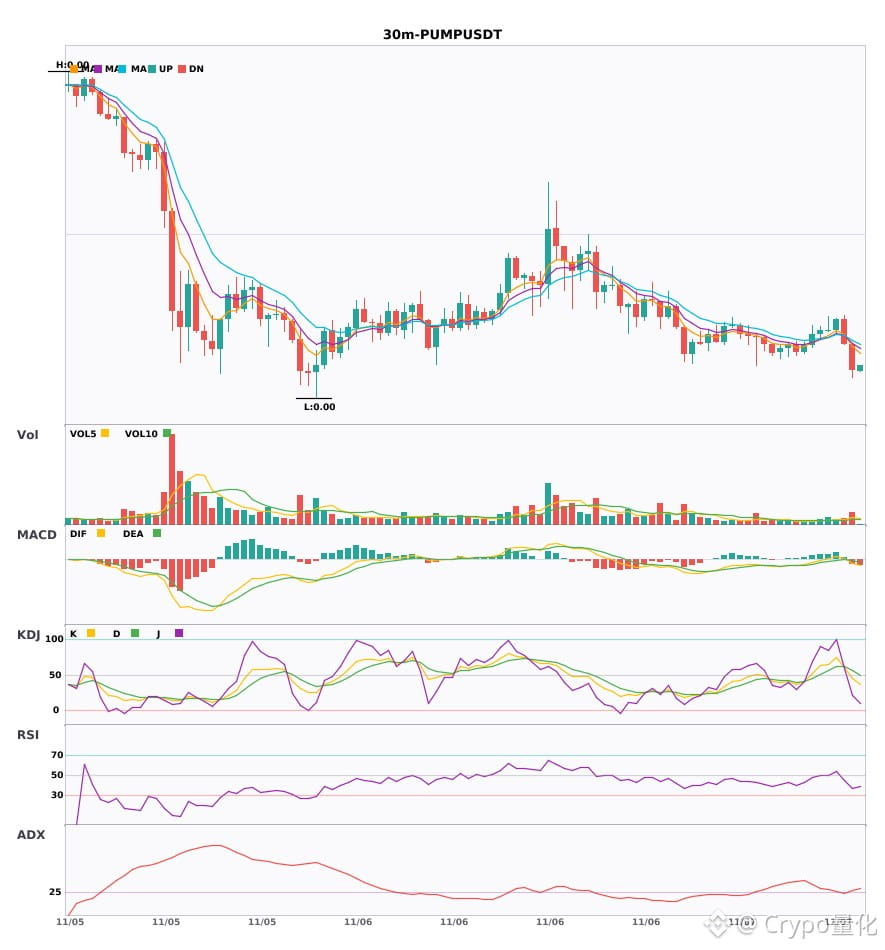
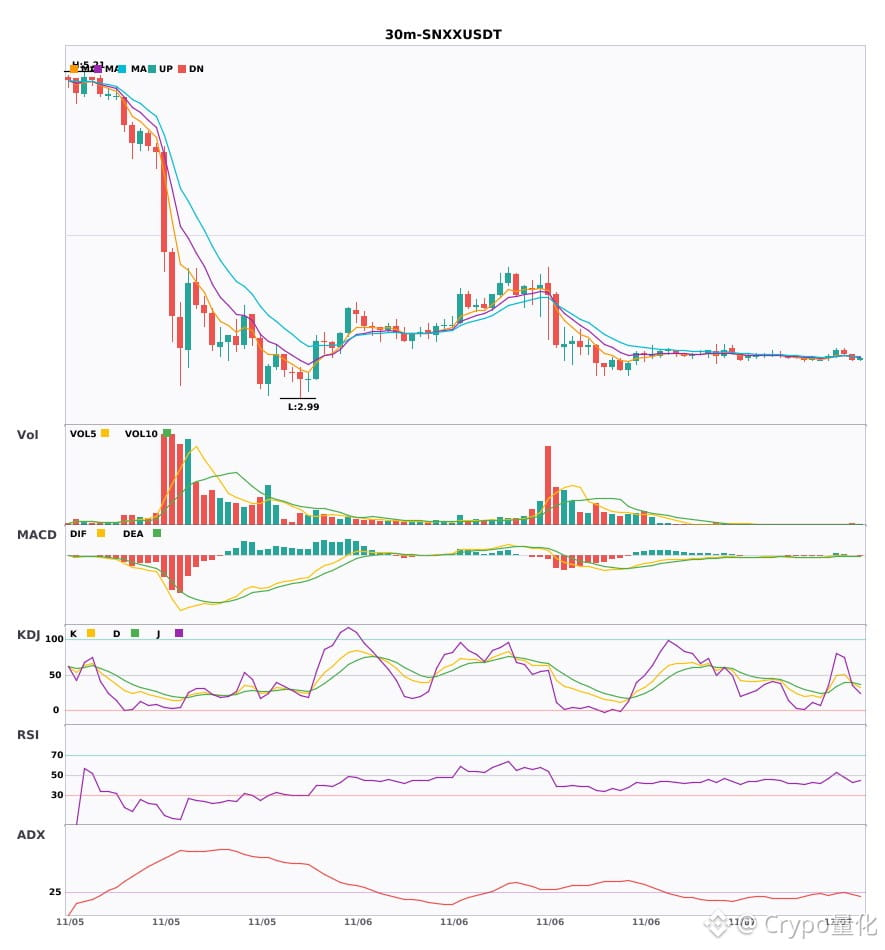
$GWEI / $PUMP / $SNXX 30-minute technical indicators are weakening in sync. Watch out for risk 🔥
════════════════════
🟢 $GWEI 30-minute bearish signal
⚠️Technical indicators: ADX(48) — very strong trend (beware of overbought pullbacks) | MACD DIF has fallen below the zero line, trend turning bearish | Moving averages are converging, building momentum; direction to be determined soon | KDJ is weak, bears have the upper hand (K: 30.9, D: 46.5) | Volume has increased (1.8x)
════════════════════
🟢 $PUMP 30-minute bearish signal
⚠️Technical indicators: ADX(30) — trend is forming; opportunity to participate | MACD bearish crossover below zero, bearish momentum accelerating | EMA5 crossed below EMA8, short-term outlook turning bearish | Volume has increased (2.4x)
════════════════════
🟢 $SNXX 30-minute bearish signal
⚠️Technical indicators: ADX(25) — trend is forming; opportunity to participate | MACD DIF has fallen below the zero line, trend turning bearish | EMA5 crossed below EMA8, short-term outlook turning bearish | KDJ bearish crossover, short-term outlook bearish (K: 37.8, D: 38.9) | Volume has increased (1.7x)
════════════════════
🔔 Follow for real-time market updates 🔔
#技术分析 #GWEI #PUMP #SNXX
📌 When trading, pay attention to whether the candlestick pattern confirms the signal
$GWEI / $PUMP / $SNXX 30-minute technical indicators are weakening in sync. Watch out for risk 🔥
════════════════════
🟢 $GWEI 30-minute bearish signal
⚠️Technical indicators: ADX(48) — very strong trend (beware of overbought pullbacks) | MACD DIF has fallen below the zero line, trend turning bearish | Moving averages are converging, building momentum; direction to be determined soon | KDJ is weak, bears have the upper hand (K: 30.9, D: 46.5) | Volume has increased (1.8x)
════════════════════
🟢 $PUMP 30-minute bearish signal
⚠️Technical indicators: ADX(30) — trend is forming; opportunity to participate | MACD bearish crossover below zero, bearish momentum accelerating | EMA5 crossed below EMA8, short-term outlook turning bearish | Volume has increased (2.4x)
════════════════════
🟢 $SNXX 30-minute bearish signal
⚠️Technical indicators: ADX(25) — trend is forming; opportunity to participate | MACD DIF has fallen below the zero line, trend turning bearish | EMA5 crossed below EMA8, short-term outlook turning bearish | KDJ bearish crossover, short-term outlook bearish (K: 37.8, D: 38.9) | Volume has increased (1.7x)
════════════════════
🔔 Follow for real-time market updates 🔔
#技术分析 #GWEI #PUMP #SNXX
📌 When trading, pay attention to whether the candlestick pattern confirms the signal
════════════════════
🟢 $GWEI 30-minute bearish signal
⚠️Technical indicators: ADX(48) — very strong trend (beware of overbought pullbacks) | MACD DIF has fallen below the zero line, trend turning bearish | Moving averages are converging, building momentum; direction to be determined soon | KDJ is weak, bears have the upper hand (K: 30.9, D: 46.5) | Volume has increased (1.8x)
════════════════════
🟢 $PUMP 30-minute bearish signal
⚠️Technical indicators: ADX(30) — trend is forming; opportunity to participate | MACD bearish crossover below zero, bearish momentum accelerating | EMA5 crossed below EMA8, short-term outlook turning bearish | Volume has increased (2.4x)
════════════════════
🟢 $SNXX 30-minute bearish signal
⚠️Technical indicators: ADX(25) — trend is forming; opportunity to participate | MACD DIF has fallen below the zero line, trend turning bearish | EMA5 crossed below EMA8, short-term outlook turning bearish | KDJ bearish crossover, short-term outlook bearish (K: 37.8, D: 38.9) | Volume has increased (1.7x)
════════════════════
🔔 Follow for real-time market updates 🔔
#技术分析 #GWEI #PUMP #SNXX
📌 When trading, pay attention to whether the candlestick pattern confirms the signal
11

·
--
That's explosive!
$GWEI A new high!
The 24-hour high just got smashed 💪
Current price: 0.01888. The previous high of 0.01883 is now in the rearview mirror!
The first pullback after a breakout is the best way to gauge what's going on. Set your stop-loss before entering.
#GWEI
Don't treat any of this as a buy or sell signal.
That's explosive!
$GWEI A new high!
The 24-hour high just got smashed 💪
Current price: 0.01888. The previous high of 0.01883 is now in the rearview mirror!
The first pullback after a breakout is the best way to gauge what's going on. Set your stop-loss before entering.
#GWEI
Don't treat any of this as a buy or sell signal.
$GWEI A new high!
The 24-hour high just got smashed 💪
Current price: 0.01888. The previous high of 0.01883 is now in the rearview mirror!
The first pullback after a breakout is the best way to gauge what's going on. Set your stop-loss before entering.
#GWEI
Don't treat any of this as a buy or sell signal.

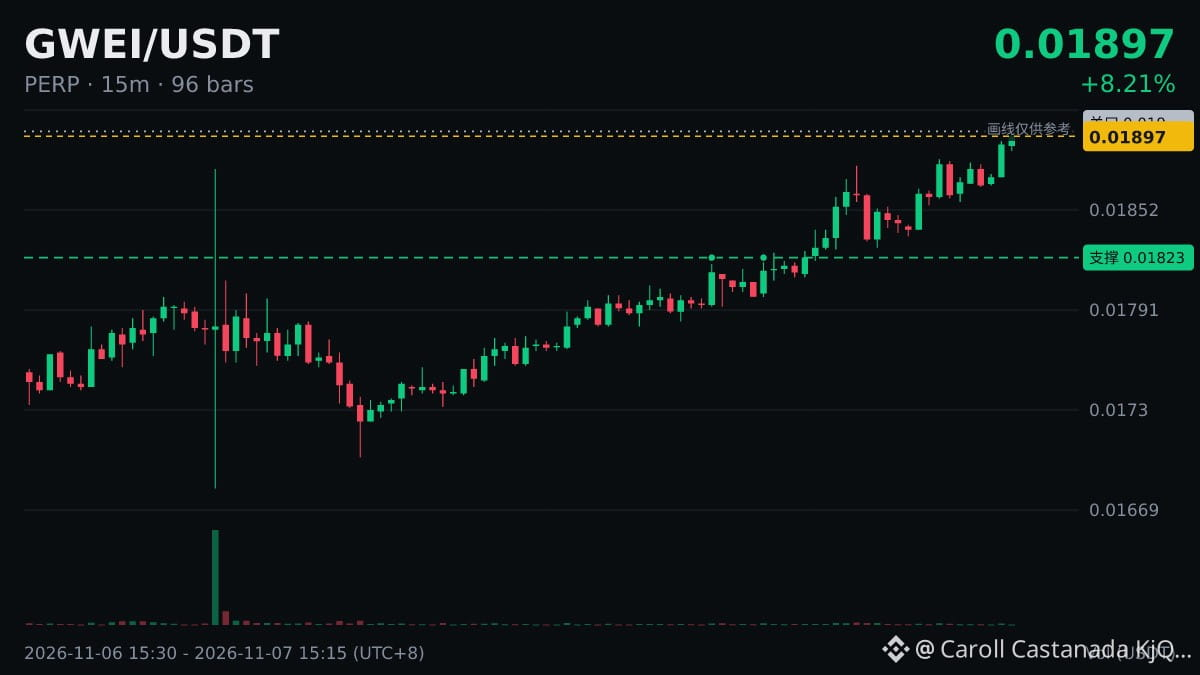
$GWEI sets a new 24-hour high
Current price 0.01892, previous high 0.01883, 24h +7.07%.
Be cautious of a pullback after a low-volume surge; it only counts if the price holds with strong volume. Would you buy the dip if it retests?
#GWEI
I can be wrong too—don't take this as advice.
$GWEI sets a new 24-hour high
Current price 0.01892, previous high 0.01883, 24h +7.07%.
Be cautious of a pullback after a low-volume surge; it only counts if the price holds with strong volume. Would you buy the dip if it retests?
#GWEI
I can be wrong too—don't take this as advice.
Current price 0.01892, previous high 0.01883, 24h +7.07%.
Be cautious of a pullback after a low-volume surge; it only counts if the price holds with strong volume. Would you buy the dip if it retests?
#GWEI
I can be wrong too—don't take this as advice.

·
--
$GWEI Set a new 24-hour high of 0.01889, surpassing the previous high of 0.01883.
A big bullish candle has pushed it up! Strength is often followed by disagreement; the pullback is the real test. What do you watch first after a rally?
#GWEI
$GWEI Set a new 24-hour high of 0.01889, surpassing the previous high of 0.01883.
A big bullish candle has pushed it up! Strength is often followed by disagreement; the pullback is the real test. What do you watch first after a rally?
#GWEI
A big bullish candle has pushed it up! Strength is often followed by disagreement; the pullback is the real test. What do you watch first after a rally?
#GWEI
1
238

·
--
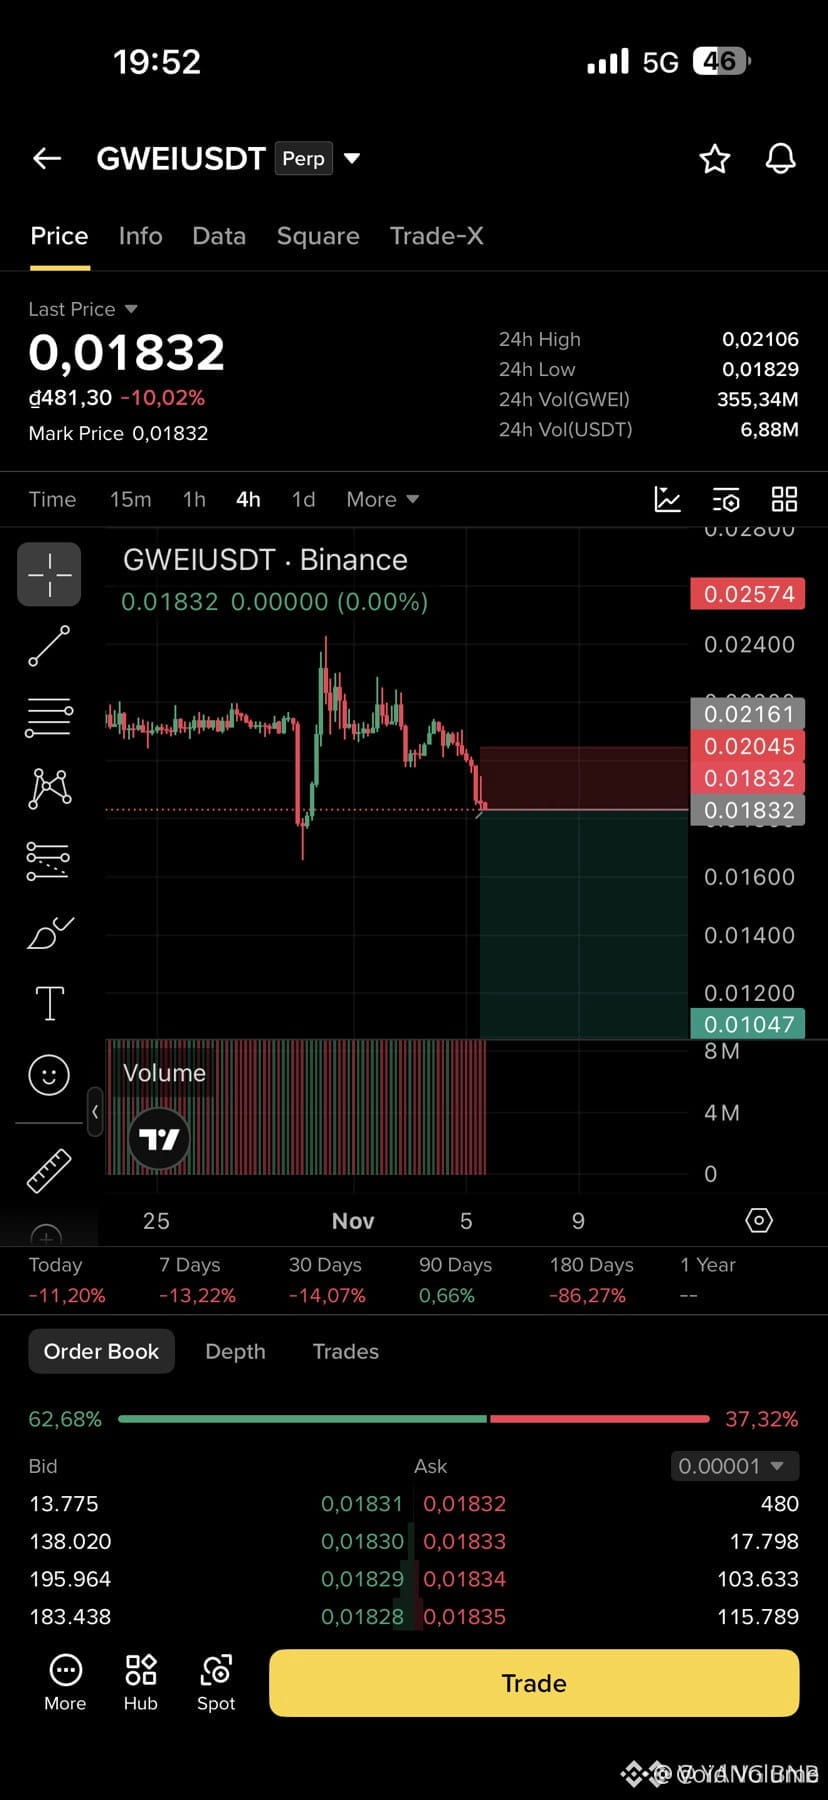
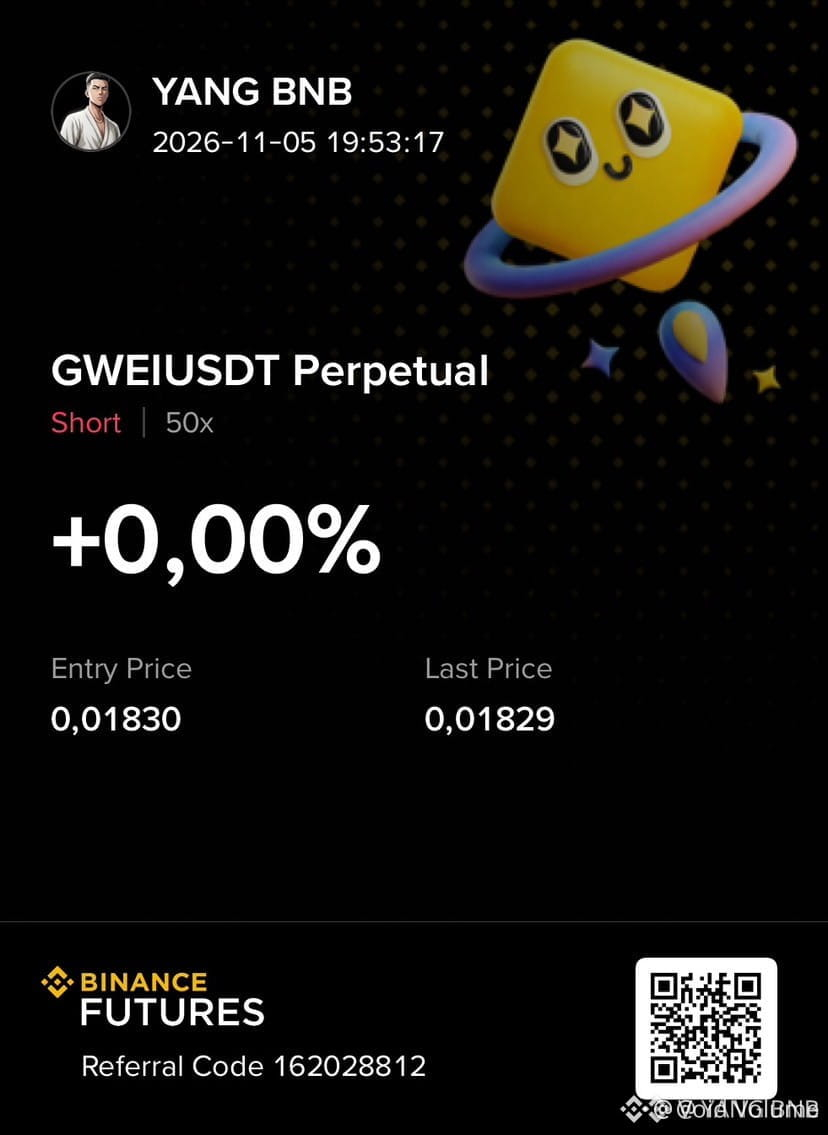
🔴 $GWEI PRIMED FOR HARD SHORT SWEEP 🦈
Entry: 0.01832-0.02045 ⚡
Target: 0.01047 🚀
📊 The 4H order block between 0.0183 and 0.0205 has repeatedly absorbed buying pressure, leaving a deep liquidity pocket below 0.0120. 🦈 Smart‑money is likely to trigger a cascade sell, hunting the remaining long positions before the price collapses toward the buy‑back zone. ⚡ Volume spikes on the last 30‑minute candle confirm the aggressive intent, while the RSI skirts the overbought threshold, hinting at a near‑term reversal.
💬 Do you see the liquidity sweep completing before the next support holds? 👇
⚠️ Not financial advice. Always manage your risk. 🛡️
🏷️ #GWEI #ShortSetup #LiquiditySweep #Crypto
🦈 🔥
🔴 $GWEI PRIMED FOR HARD SHORT SWEEP 🦈
Entry: 0.01832-0.02045 ⚡
Target: 0.01047 🚀
📊 The 4H order block between 0.0183 and 0.0205 has repeatedly absorbed buying pressure, leaving a deep liquidity pocket below 0.0120. 🦈 Smart‑money is likely to trigger a cascade sell, hunting the remaining long positions before the price collapses toward the buy‑back zone. ⚡ Volume spikes on the last 30‑minute candle confirm the aggressive intent, while the RSI skirts the overbought threshold, hinting at a near‑term reversal.
💬 Do you see the liquidity sweep completing before the next support holds? 👇
⚠️ Not financial advice. Always manage your risk. 🛡️
🏷️ #GWEI #ShortSetup #LiquiditySweep #Crypto
🦈 🔥
Entry: 0.01832-0.02045 ⚡
Target: 0.01047 🚀
📊 The 4H order block between 0.0183 and 0.0205 has repeatedly absorbed buying pressure, leaving a deep liquidity pocket below 0.0120. 🦈 Smart‑money is likely to trigger a cascade sell, hunting the remaining long positions before the price collapses toward the buy‑back zone. ⚡ Volume spikes on the last 30‑minute candle confirm the aggressive intent, while the RSI skirts the overbought threshold, hinting at a near‑term reversal.
💬 Do you see the liquidity sweep completing before the next support holds? 👇
⚠️ Not financial advice. Always manage your risk. 🛡️
🏷️ #GWEI #ShortSetup #LiquiditySweep #Crypto
🦈 🔥
8

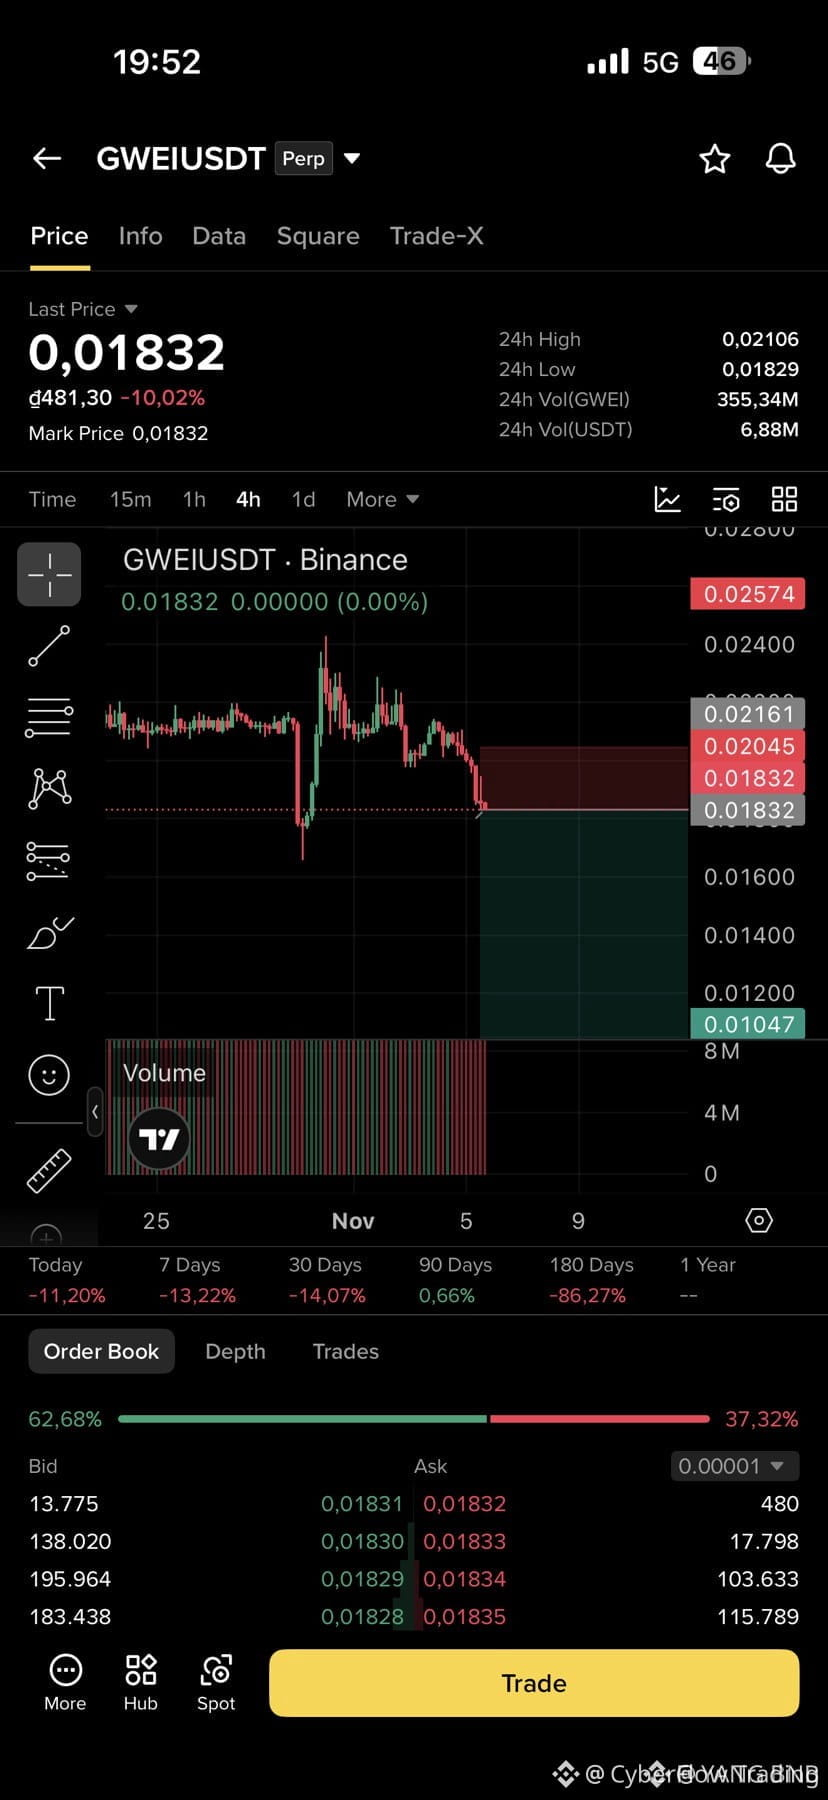
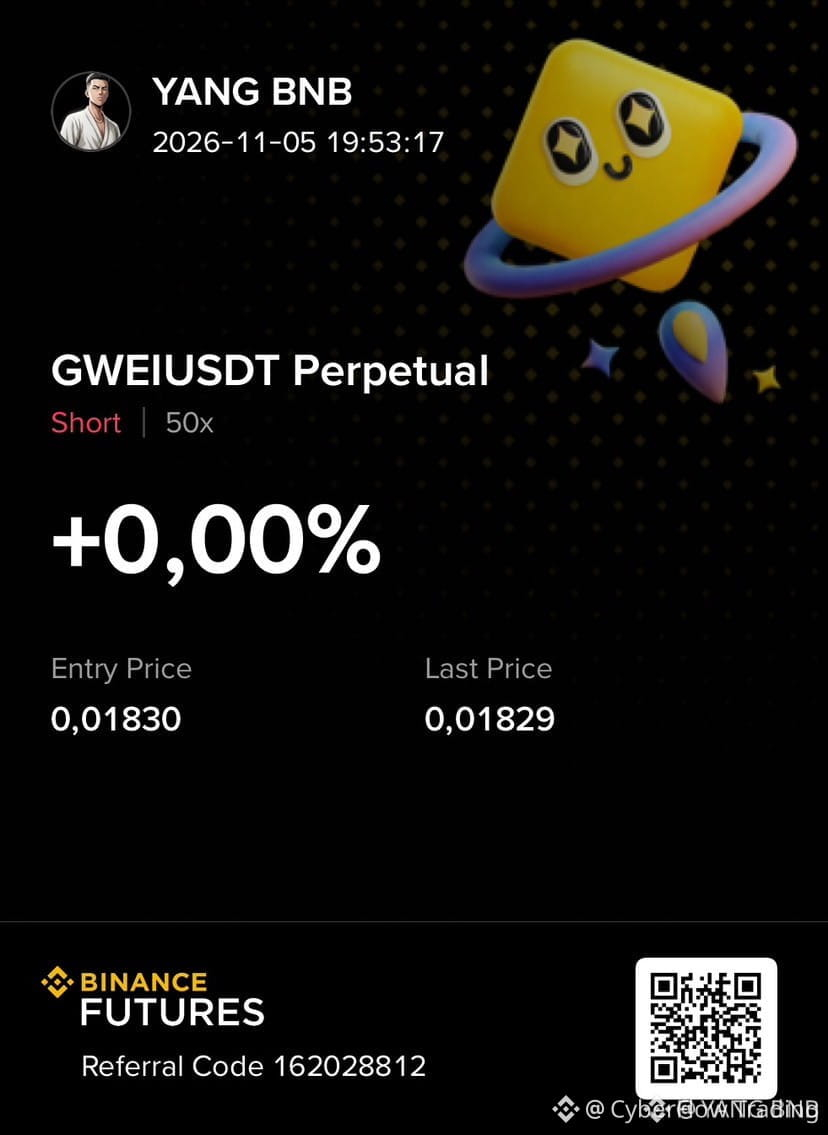
🔴 $GWEI PREPARES FOR DEEP DIVE INTO BULLISH LIQUIDITY SWEEP 🦈
Entry: 0.01832-0.02045 ⚡
Target: 0.01047 🚀
Smart money is unloading $GWEI hard, hammering the 0.0183‑0.0205 band as sellers flood the order book. 📊 Volume spikes confirm a decisive liquidity grab, pushing price toward the next buy‑back zone.
The 0.01047 level marks the next demand pocket where whales are likely to snap up the dip, setting up a clean profit corridor. ⚡ Keep eyes on the 4H for a potential reversal candle before the next sweep. 💡
💬 Who’s ready to ride the short wave and catch the rebound? 👇
⚠️ Not financial advice. Always manage your risk. 🛡️
🏷️ #GWEI #ShortSetup #LiquiditySweep #Crypto
🦈 🔥
🔴 $GWEI PREPARES FOR DEEP DIVE INTO BULLISH LIQUIDITY SWEEP 🦈
Entry: 0.01832-0.02045 ⚡
Target: 0.01047 🚀
Smart money is unloading $GWEI hard, hammering the 0.0183‑0.0205 band as sellers flood the order book. 📊 Volume spikes confirm a decisive liquidity grab, pushing price toward the next buy‑back zone.
The 0.01047 level marks the next demand pocket where whales are likely to snap up the dip, setting up a clean profit corridor. ⚡ Keep eyes on the 4H for a potential reversal candle before the next sweep. 💡
💬 Who’s ready to ride the short wave and catch the rebound? 👇
⚠️ Not financial advice. Always manage your risk. 🛡️
🏷️ #GWEI #ShortSetup #LiquiditySweep #Crypto
🦈 🔥
Entry: 0.01832-0.02045 ⚡
Target: 0.01047 🚀
Smart money is unloading $GWEI hard, hammering the 0.0183‑0.0205 band as sellers flood the order book. 📊 Volume spikes confirm a decisive liquidity grab, pushing price toward the next buy‑back zone.
The 0.01047 level marks the next demand pocket where whales are likely to snap up the dip, setting up a clean profit corridor. ⚡ Keep eyes on the 4H for a potential reversal candle before the next sweep. 💡
💬 Who’s ready to ride the short wave and catch the rebound? 👇
⚠️ Not financial advice. Always manage your risk. 🛡️
🏷️ #GWEI #ShortSetup #LiquiditySweep #Crypto
🦈 🔥
22
·
--
Is big money coming in?
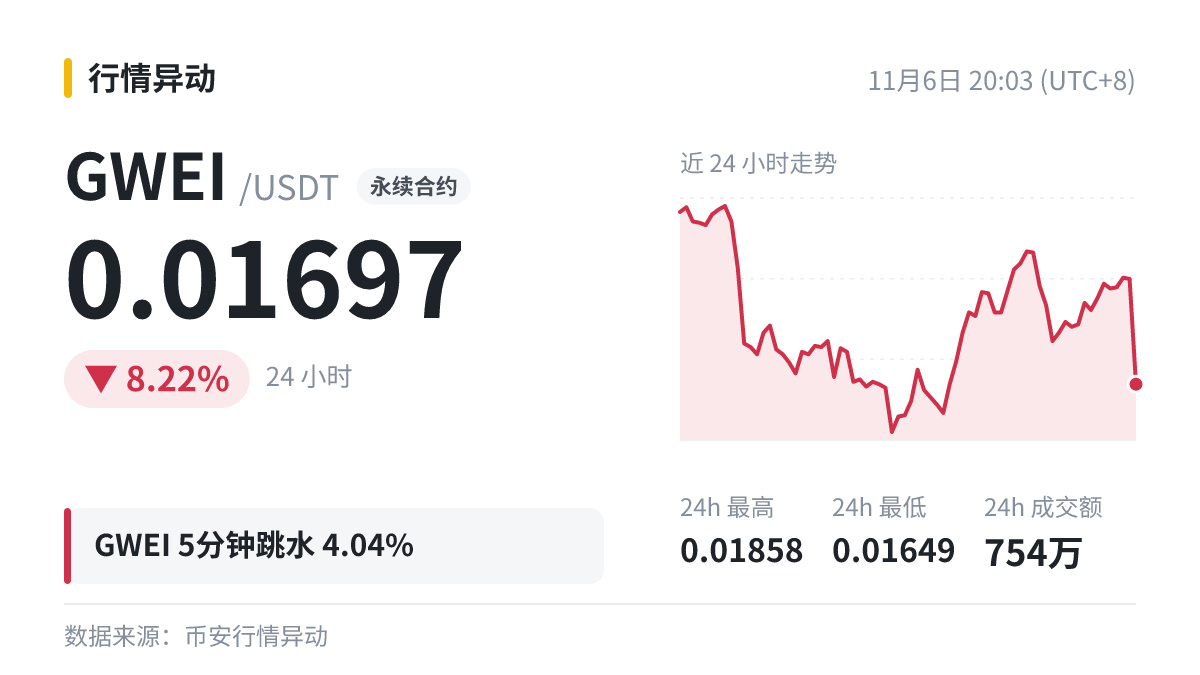
$GWEI 5-minute drop of 4.04%, current price 0.01697, 24h trading volume of $7.49 million.
What do the fund flows tell us?
· The decline was concentrated in just 5 minutes, indicating heavy, concentrated selling pressure
· The 24h change is also -8.32%, with funds flowing out overall
· Watch for large buy orders supporting the price near the lows; without them, it may continue to fall
Share your thoughts in the comments 👇
#GWEI
Is big money coming in?
$GWEI 5-minute drop of 4.04%, current price 0.01697, 24h trading volume of $7.49 million.
What do the fund flows tell us?
· The decline was concentrated in just 5 minutes, indicating heavy, concentrated selling pressure
· The 24h change is also -8.32%, with funds flowing out overall
· Watch for large buy orders supporting the price near the lows; without them, it may continue to fall
Share your thoughts in the comments 👇
#GWEI
$GWEI 5-minute drop of 4.04%, current price 0.01697, 24h trading volume of $7.49 million.
What do the fund flows tell us?
· The decline was concentrated in just 5 minutes, indicating heavy, concentrated selling pressure
· The 24h change is also -8.32%, with funds flowing out overall
· Watch for large buy orders supporting the price near the lows; without them, it may continue to fall
Share your thoughts in the comments 👇
#GWEI
1
204

·
--
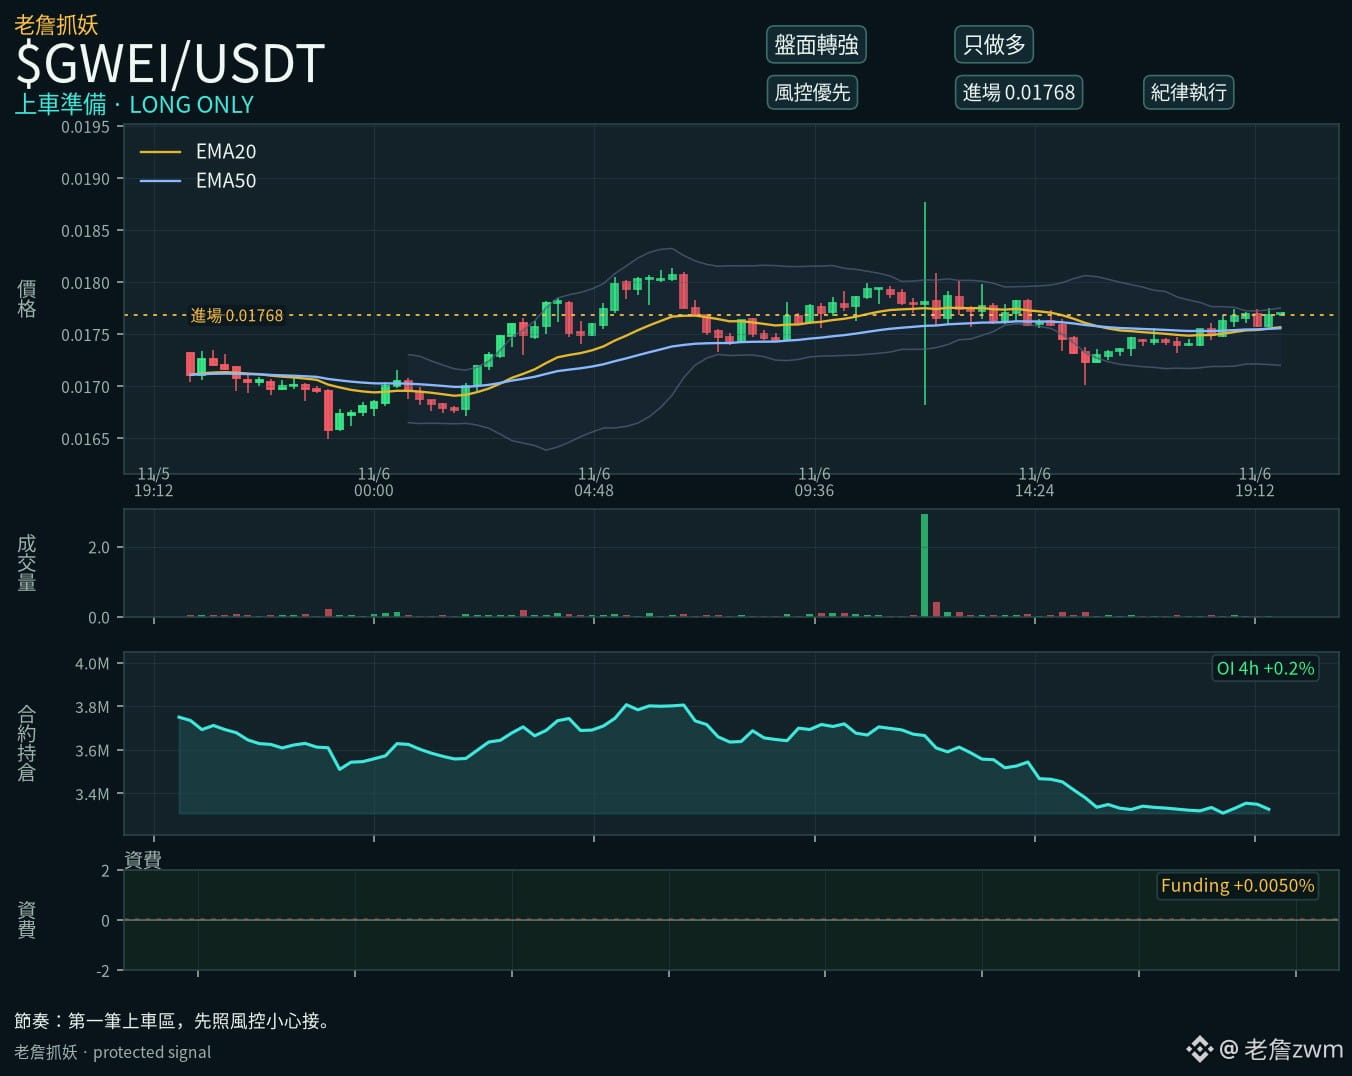
$GWEI is still near the bottom, so we can start watching
It’s barely moved all day
But the futures market hasn’t followed yet, and sellers are still relatively strong on the hourly timeframe
Start with a small position and wait for volume to come in before deciding
Stop loss: 0.01503; first target: 0.01945. Take 30% off when it gets there
#GWEI
$GWEI is still near the bottom, so we can start watching
It’s barely moved all day
But the futures market hasn’t followed yet, and sellers are still relatively strong on the hourly timeframe
Start with a small position and wait for volume to come in before deciding
Stop loss: 0.01503; first target: 0.01945. Take 30% off when it gets there
#GWEI
It’s barely moved all day
But the futures market hasn’t followed yet, and sellers are still relatively strong on the hourly timeframe
Start with a small position and wait for volume to come in before deciding
Stop loss: 0.01503; first target: 0.01945. Take 30% off when it gets there
#GWEI
10

·
--
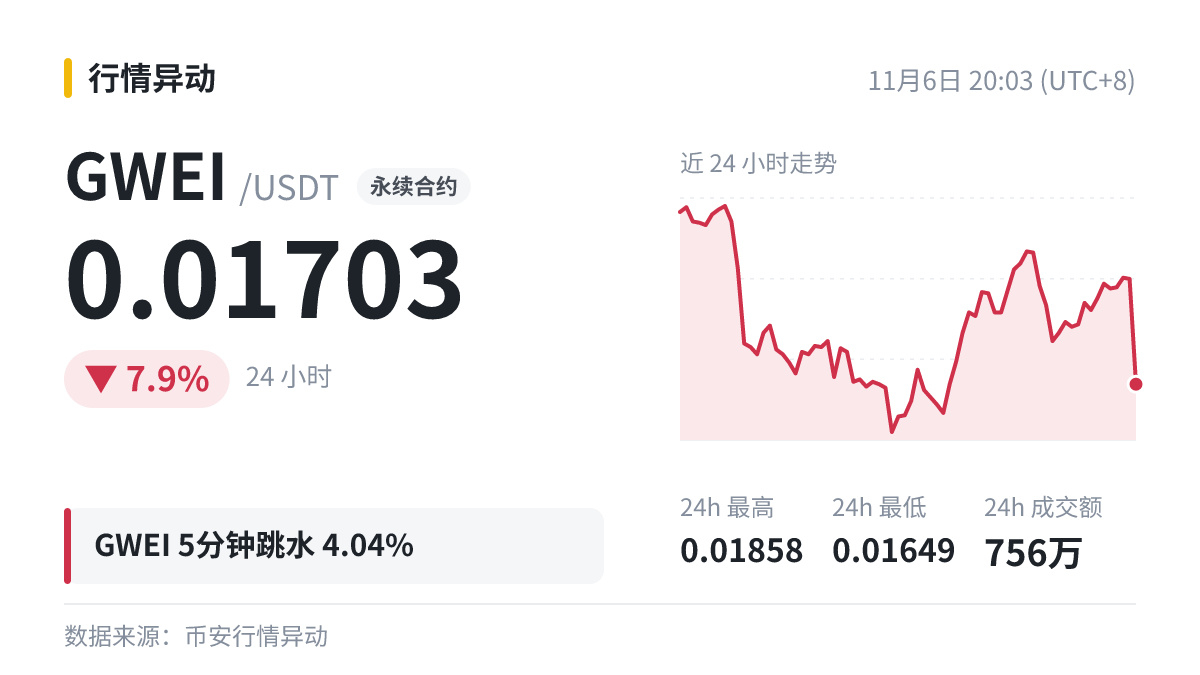
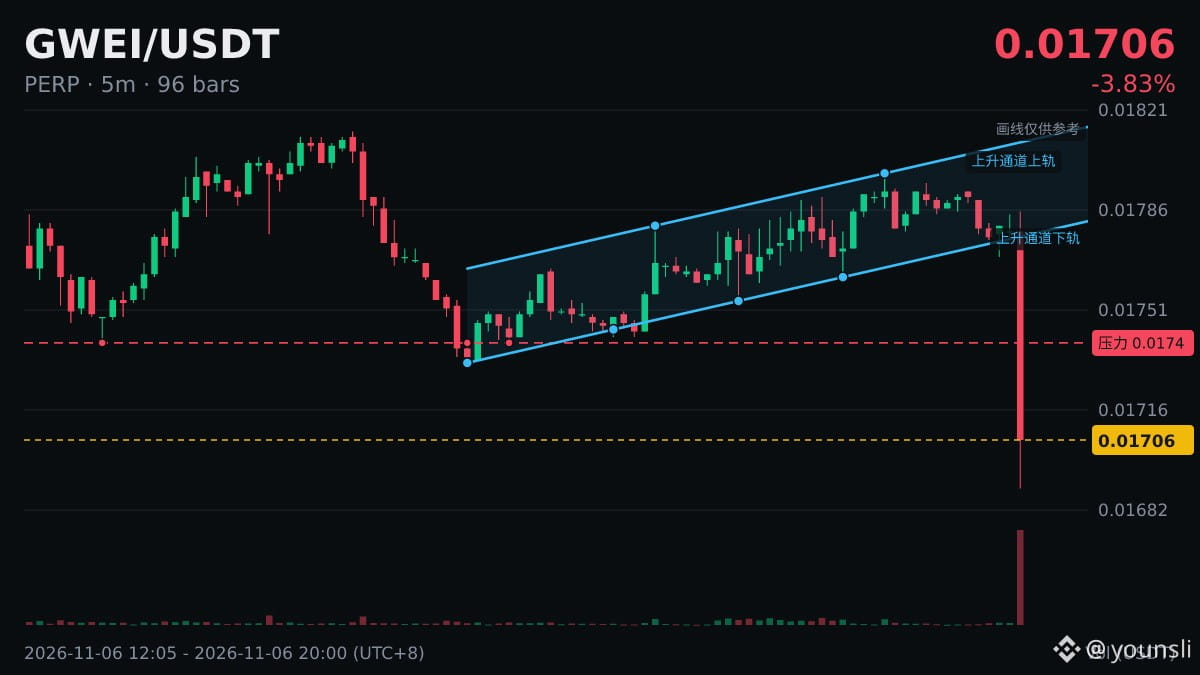
Large orders are being pulled, $GWEI ? Down 4.04% in 5 minutes, latest price 0.01703.
Main players usually don’t chase the first move; they prefer to accumulate in batches on pullbacks, while retail investors are more likely to chase at the very top.
#GWEI
Large orders are being pulled, $GWEI ? Down 4.04% in 5 minutes, latest price 0.01703.
Main players usually don’t chase the first move; they prefer to accumulate in batches on pullbacks, while retail investors are more likely to chase at the very top.
#GWEI
Main players usually don’t chase the first move; they prefer to accumulate in batches on pullbacks, while retail investors are more likely to chase at the very top.
#GWEI
219
·
--
GWEI contracts: At 20:10 Beijing time on 2026-11-06, the 5-minute candle closed up 6.59%. At 20:10:01 Beijing time on 2026-11-06, the observed price was 0.01816, 24-hour volume was 9.0105 million, price was above VWAP at 0.0176886, and volume was 5.1x (on a low base). I’d rather wait for further confirmation. Don’t focus on just one candle. The key point is: don’t treat it as a breakout before confirmation, but strong buying support makes it worth continuing to watch.
Can it hold VWAP at 0.0176886 on a pullback? I’ll wait for confirmation rather than jumping in at the first opportunity.
#GWEI #UnusualMoveAlert
GWEI contracts: At 20:10 Beijing time on 2026-11-06, the 5-minute candle closed up 6.59%. At 20:10:01 Beijing time on 2026-11-06, the observed price was 0.01816, 24-hour volume was 9.0105 million, price was above VWAP at 0.0176886, and volume was 5.1x (on a low base). I’d rather wait for further confirmation. Don’t focus on just one candle. The key point is: don’t treat it as a breakout before confirmation, but strong buying support makes it worth continuing to watch.
Can it hold VWAP at 0.0176886 on a pullback? I’ll wait for confirmation rather than jumping in at the first opportunity.
#GWEI #UnusualMoveAlert
Can it hold VWAP at 0.0176886 on a pullback? I’ll wait for confirmation rather than jumping in at the first opportunity.
#GWEI #UnusualMoveAlert
6

·
--
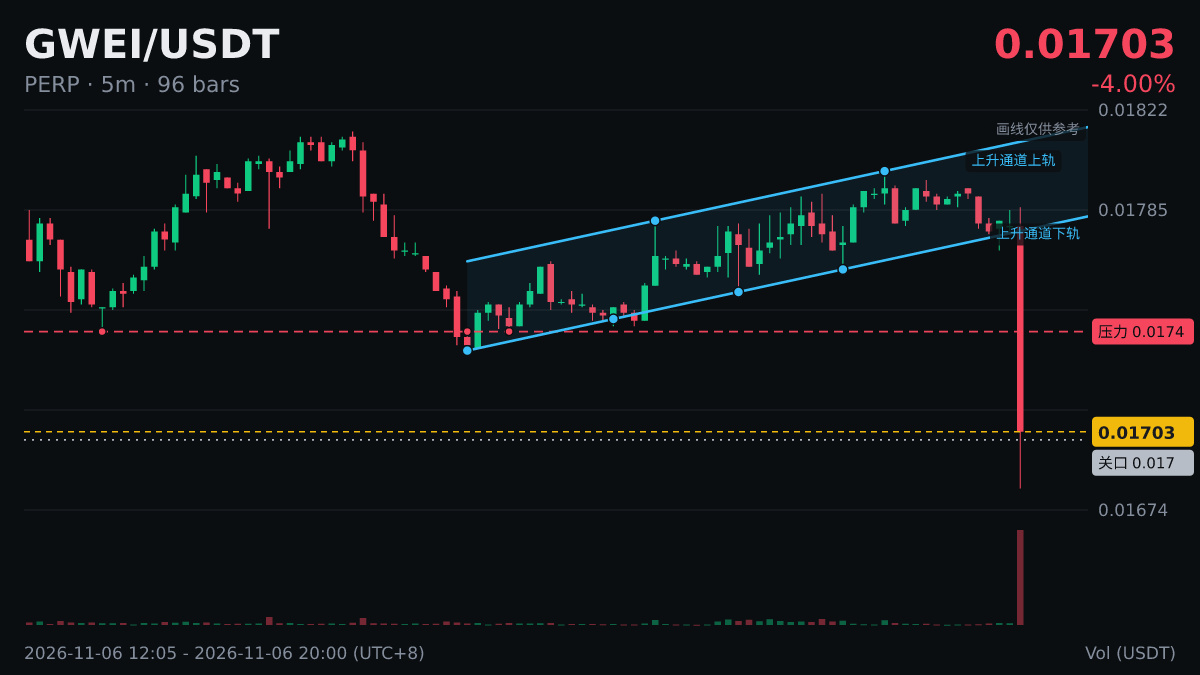
$GWEI 0.01687 (5 min -4.04%, 4h -3.6%)
After a sharp drop, a period of choppy trading is often the beginning of stabilization. A direct V-shaped reversal is less common. What conditions do you usually wait for before making a move?
#GWEI
Just use it as a reference; don't believe everything.
$GWEI 0.01687 (5 min -4.04%, 4h -3.6%)
After a sharp drop, a period of choppy trading is often the beginning of stabilization. A direct V-shaped reversal is less common. What conditions do you usually wait for before making a move?
#GWEI
Just use it as a reference; don't believe everything.
After a sharp drop, a period of choppy trading is often the beginning of stabilization. A direct V-shaped reversal is less common. What conditions do you usually wait for before making a move?
#GWEI
Just use it as a reference; don't believe everything.
4

·
--
📎 $GWEI Rapid Decline Monitoring
5 min: -4.04%|1h: -4.88%|4h: -3.03%|24h: -8.22%
Current price 0.01697, 24h low 0.01649
The 5-minute decline is modest, suggesting a short-term pullback.
#GWEI
📎 $GWEI Rapid Decline Monitoring
5 min: -4.04%|1h: -4.88%|4h: -3.03%|24h: -8.22%
Current price 0.01697, 24h low 0.01649
The 5-minute decline is modest, suggesting a short-term pullback.
#GWEI
5 min: -4.04%|1h: -4.88%|4h: -3.03%|24h: -8.22%
Current price 0.01697, 24h low 0.01649
The 5-minute decline is modest, suggesting a short-term pullback.
#GWEI
1

·
--
Oh my god!
$GWEI 5 minutes and it’s down 4.04%📉
Current price: 0.0169. Bulls, are you holding up?
Sell orders suddenly came pouring in. If you’re heavily positioned, watch your risk—the most important thing is to survive. Are you more afraid of missing out or getting stuck holding the bag?
#GWEI
Oh my god!
$GWEI 5 minutes and it’s down 4.04%📉
Current price: 0.0169. Bulls, are you holding up?
Sell orders suddenly came pouring in. If you’re heavily positioned, watch your risk—the most important thing is to survive. Are you more afraid of missing out or getting stuck holding the bag?
#GWEI
$GWEI 5 minutes and it’s down 4.04%📉
Current price: 0.0169. Bulls, are you holding up?
Sell orders suddenly came pouring in. If you’re heavily positioned, watch your risk—the most important thing is to survive. Are you more afraid of missing out or getting stuck holding the bag?
#GWEI
3

·
--
It's taking a nosedive, folks!
$GWEI 5 minutes: -4.04%; already down -7.94% over 24 hours!
Sentiment got tense in an instant…
Anyone trying to buy the dip? Leave some room in your position.
Let's see if support holds—don't rush to catch a falling knife.
#GWEI
Just my personal opinion, not investment advice.
It's taking a nosedive, folks!
$GWEI 5 minutes: -4.04%; already down -7.94% over 24 hours!
Sentiment got tense in an instant…
Anyone trying to buy the dip? Leave some room in your position.
Let's see if support holds—don't rush to catch a falling knife.
#GWEI
Just my personal opinion, not investment advice.
$GWEI 5 minutes: -4.04%; already down -7.94% over 24 hours!
Sentiment got tense in an instant…
Anyone trying to buy the dip? Leave some room in your position.
Let's see if support holds—don't rush to catch a falling knife.
#GWEI
Just my personal opinion, not investment advice.
4
·
--
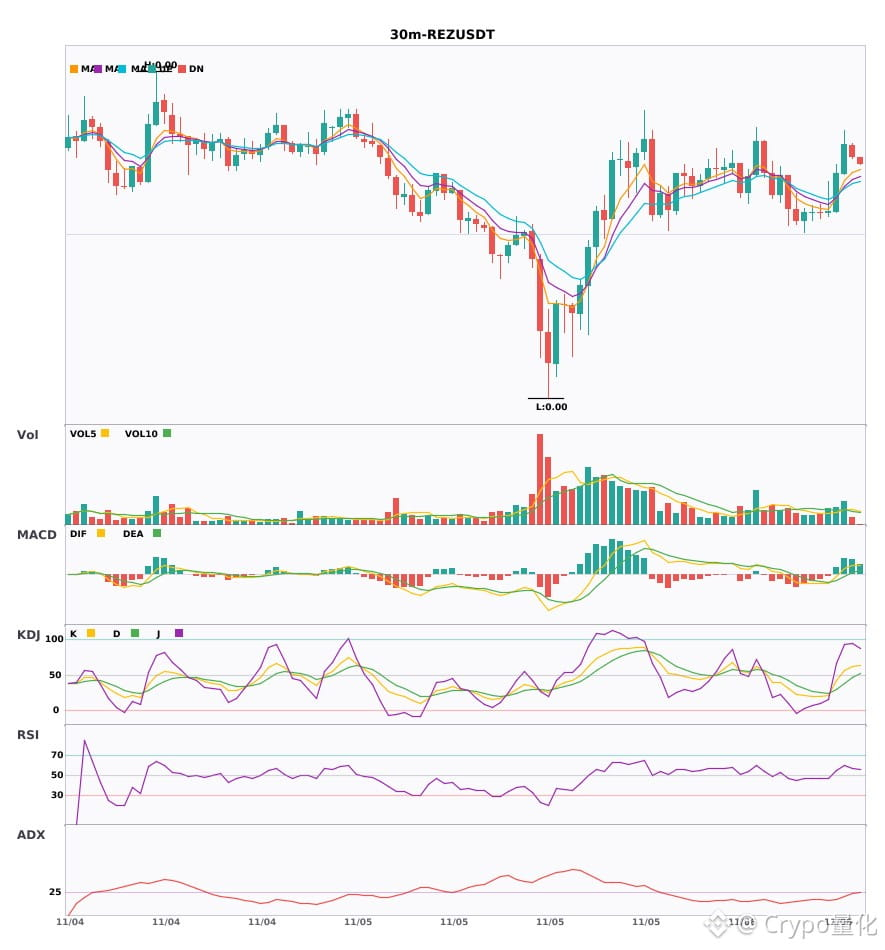
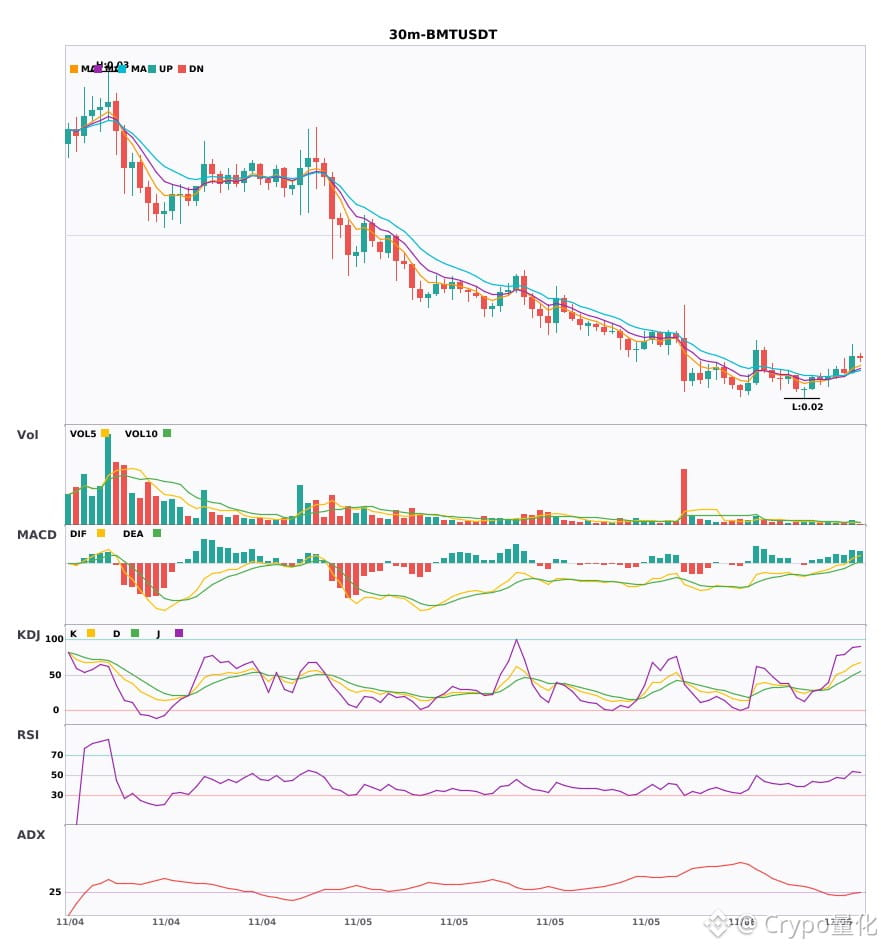
$REZ / $BMT / $GWEI 30-minute technical indicators are strengthening in sync. Which has greater explosive potential? 🔥
════════════════════
🔴 $REZ 30-minute bullish signal
⚠️Technical analysis: ADX(25): Trend is forming; opportunity to participate | MACD DIF breaks above the zero line, signaling a bullish trend | EMA5 > EMA8 > EMA13: Bullish alignment | Volume increases (1.6x)
════════════════════
🔴 $BMT 30-minute bullish signal
⚠️Technical analysis: ADX(25): Trend is forming; opportunity to participate | MACD DIF breaks above the zero line, signaling a bullish trend | EMA5 > EMA8 > EMA13: Bullish alignment | Volume increases (1.6x)
════════════════════
🔴 $GWEI 30-minute bullish signal
⚠️Technical analysis: ADX(35): Clear trending market | MACD golden cross above zero; bullish momentum is being released | EMA5 > EMA8 > EMA13: Bullish alignment | KDJ golden cross; short-term outlook is bullish (K: 41.7, D: 40.5) | Volume increases (2.0x)
════════════════════
🔔 Follow us for first-hand market alerts 🔔
#技术分析 #REZ #BMT #GWEI
📌 When trading, pay attention to whether the candlestick pattern confirms the signal
$REZ / $BMT / $GWEI 30-minute technical indicators are strengthening in sync. Which has greater explosive potential? 🔥
════════════════════
🔴 $REZ 30-minute bullish signal
⚠️Technical analysis: ADX(25): Trend is forming; opportunity to participate | MACD DIF breaks above the zero line, signaling a bullish trend | EMA5 > EMA8 > EMA13: Bullish alignment | Volume increases (1.6x)
════════════════════
🔴 $BMT 30-minute bullish signal
⚠️Technical analysis: ADX(25): Trend is forming; opportunity to participate | MACD DIF breaks above the zero line, signaling a bullish trend | EMA5 > EMA8 > EMA13: Bullish alignment | Volume increases (1.6x)
════════════════════
🔴 $GWEI 30-minute bullish signal
⚠️Technical analysis: ADX(35): Clear trending market | MACD golden cross above zero; bullish momentum is being released | EMA5 > EMA8 > EMA13: Bullish alignment | KDJ golden cross; short-term outlook is bullish (K: 41.7, D: 40.5) | Volume increases (2.0x)
════════════════════
🔔 Follow us for first-hand market alerts 🔔
#技术分析 #REZ #BMT #GWEI
📌 When trading, pay attention to whether the candlestick pattern confirms the signal
════════════════════
🔴 $REZ 30-minute bullish signal
⚠️Technical analysis: ADX(25): Trend is forming; opportunity to participate | MACD DIF breaks above the zero line, signaling a bullish trend | EMA5 > EMA8 > EMA13: Bullish alignment | Volume increases (1.6x)
════════════════════
🔴 $BMT 30-minute bullish signal
⚠️Technical analysis: ADX(25): Trend is forming; opportunity to participate | MACD DIF breaks above the zero line, signaling a bullish trend | EMA5 > EMA8 > EMA13: Bullish alignment | Volume increases (1.6x)
════════════════════
🔴 $GWEI 30-minute bullish signal
⚠️Technical analysis: ADX(35): Clear trending market | MACD golden cross above zero; bullish momentum is being released | EMA5 > EMA8 > EMA13: Bullish alignment | KDJ golden cross; short-term outlook is bullish (K: 41.7, D: 40.5) | Volume increases (2.0x)
════════════════════
🔔 Follow us for first-hand market alerts 🔔
#技术分析 #REZ #BMT #GWEI
📌 When trading, pay attention to whether the candlestick pattern confirms the signal
25
Log in to explore more content
Join global crypto users on Binance Square
⚡️ Get latest and useful information about crypto.
💬 Trusted by the world’s largest crypto exchange.
👍 Discover real insights from verified creators.
Email / Phone number
Trending Topics
1
#JobsReportRaisesHikeOdds
358,543 views
2,706 Discussing
2
#CPITestsDecemberRateOutlook
73,902 views
735 Discussing
3
#BitcoinRebounds$75KAsChipsLead
30,945 views
270 Discussing
4
#US Data Center Rules May Constrain AI Expansion
53,643 views
193 Discussing
5
#ARKPlans14ThematicETFsCoveringAIAndTokenizedMarkets
1,438 views
36 Discussing
6
#WillAnthropicListOnTime
98,931 views
1,095 Discussing
7
#WillUS-IranTensionsBoostSafe-HavenDemand?
33,979 views
323 Discussing
8
#BitcoinETFsSee$412MNetOutflows
8,043 views
52 Discussing
9
#HKSFCPlansToRestrictCryptoAndExchangeTerms
30,913 views
392 Discussing
10
#TradFiForBeginners
60,225 views
834 Discussing