
#elliottwaves
elliottwaves
105,560 views
235 Discussing
Hot
Latest
·
--
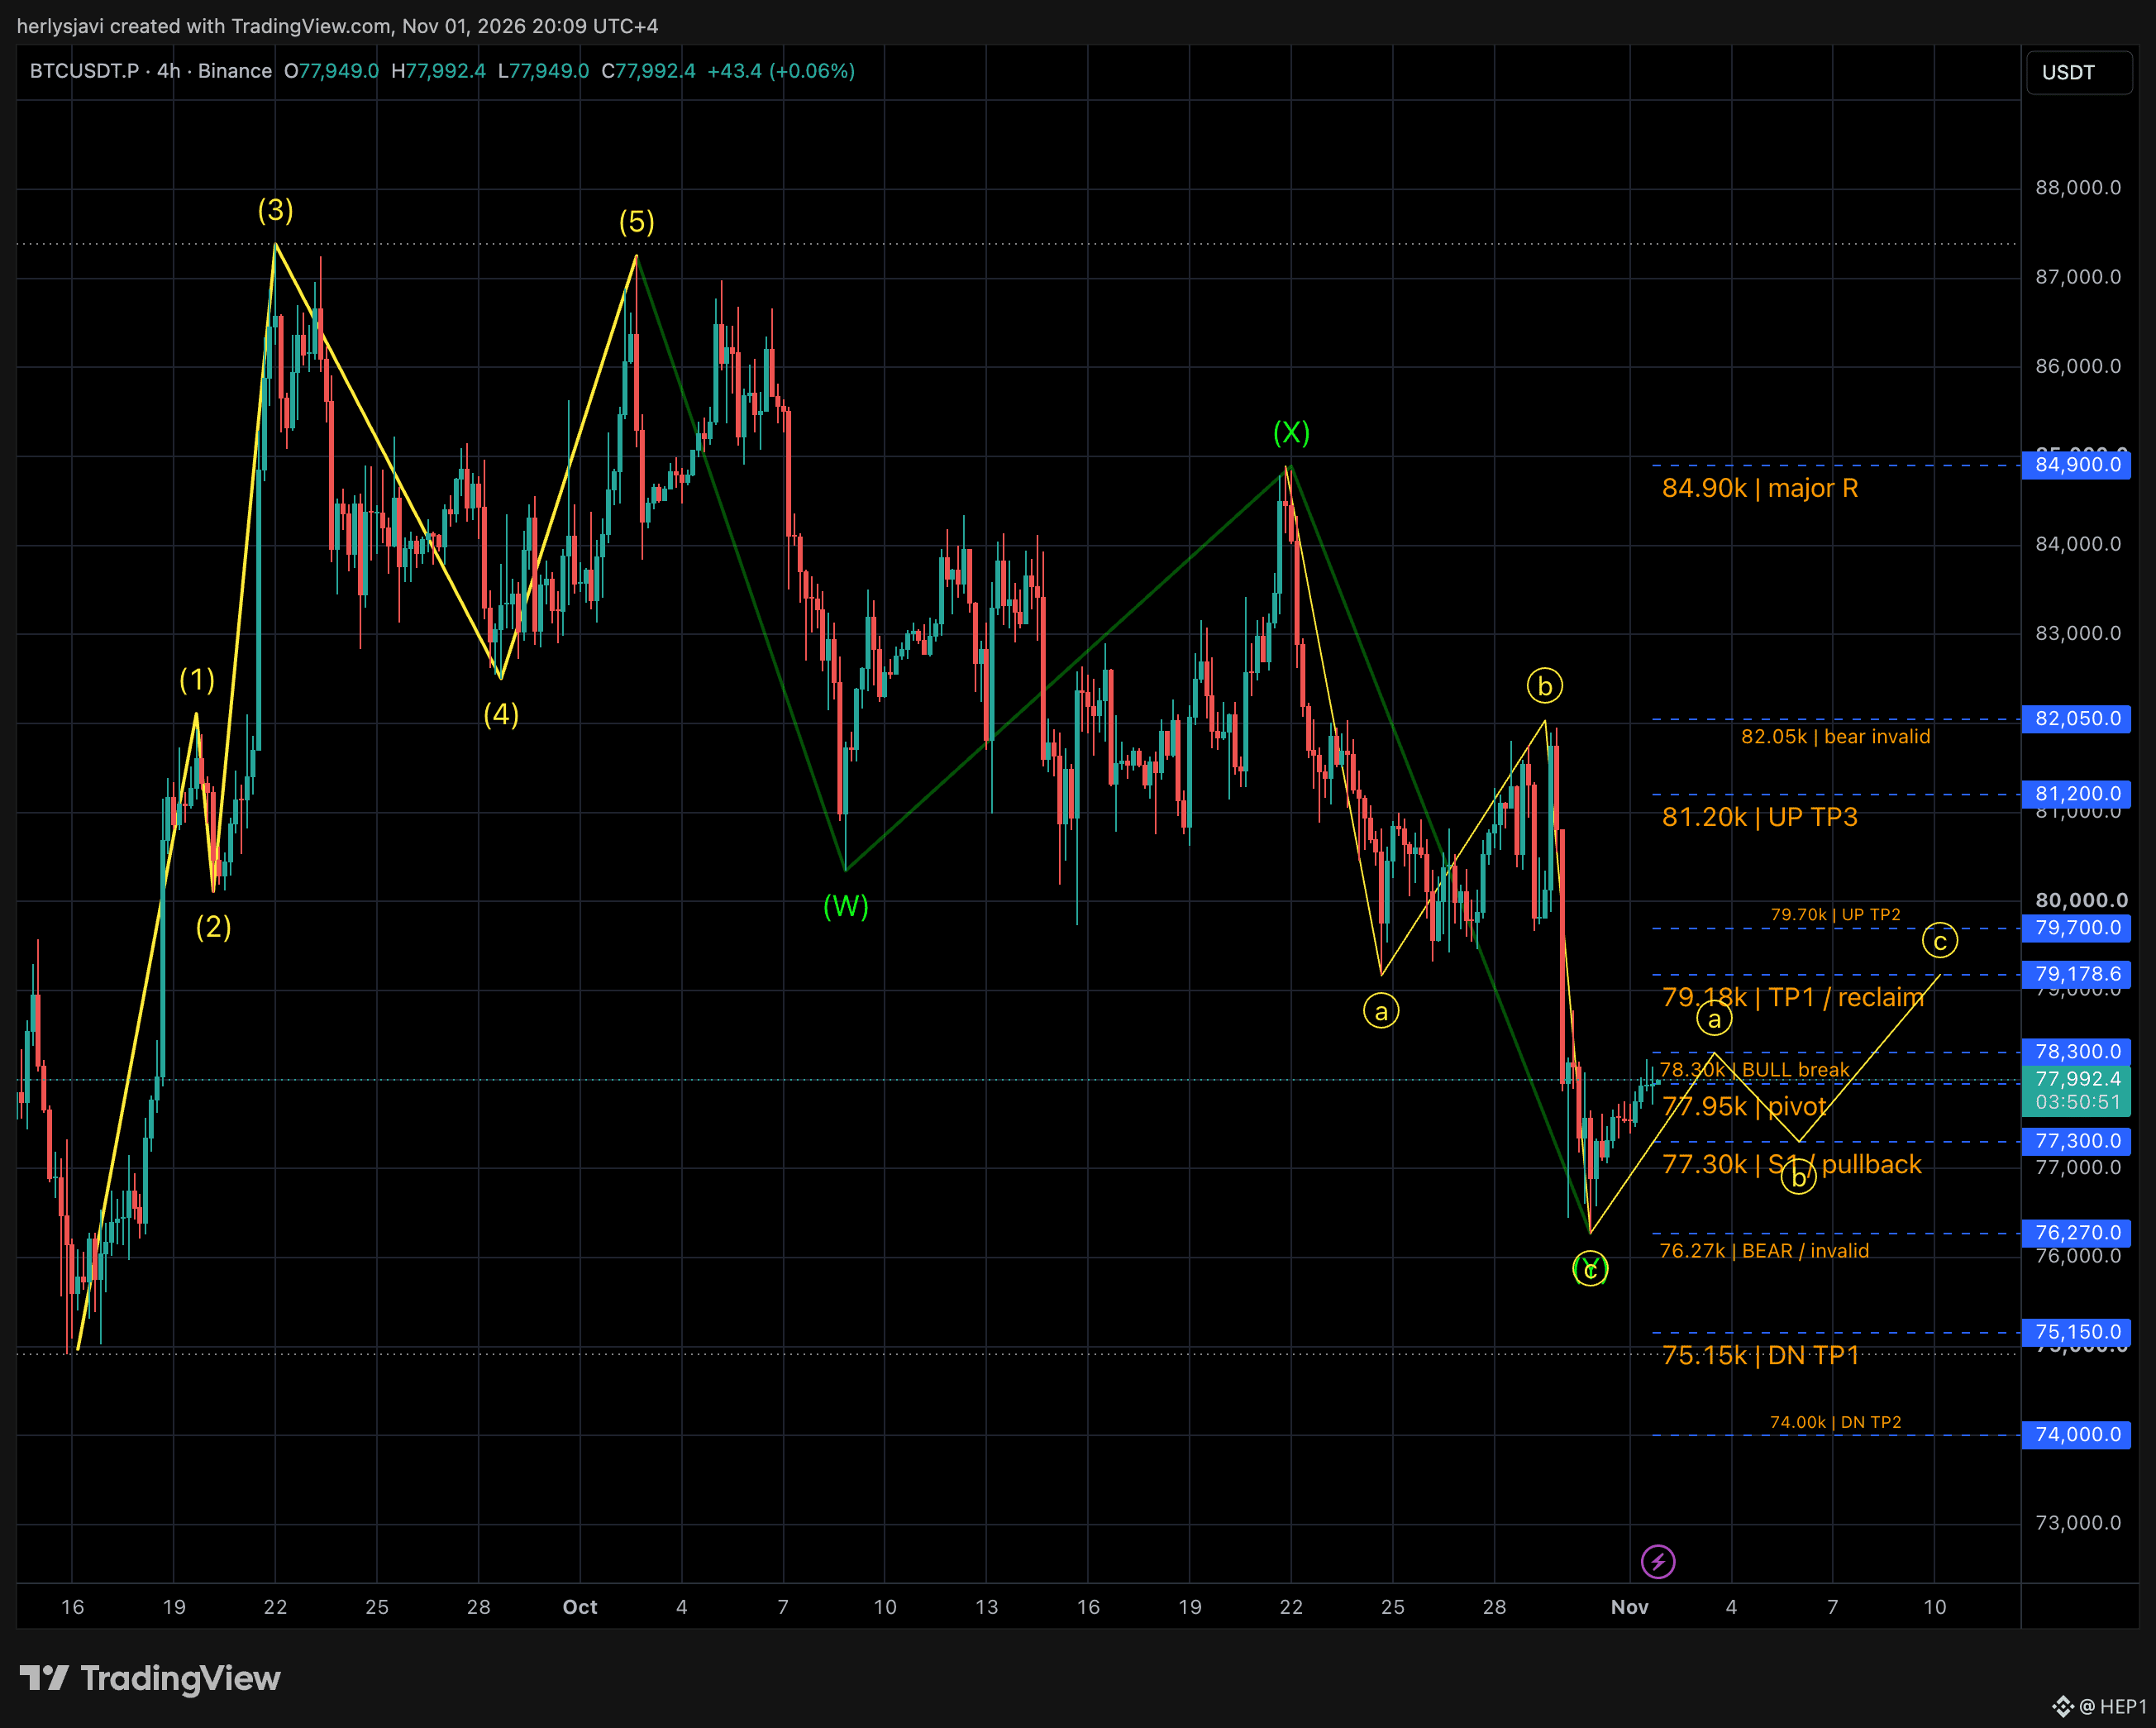
Update.
Bullish: above 78,300, targets 79,178.6 / 79,700 / 81,200.
Bearish: below 76,270, targets 75,150 / 74,000.The old 76,444 bottom failed.
The revised C/Y low and projected ABC rebound remain tentative.
Breakouts require a 4H close and retest.
Share your thoghts
#elliottwaves #ElliottWaveTheory #elliot #elliotwave
Update.
Bullish: above 78,300, targets 79,178.6 / 79,700 / 81,200.
Bearish: below 76,270, targets 75,150 / 74,000.The old 76,444 bottom failed.
The revised C/Y low and projected ABC rebound remain tentative.
Breakouts require a 4H close and retest.
Share your thoghts
#elliottwaves #ElliottWaveTheory #elliot #elliotwave
Bullish: above 78,300, targets 79,178.6 / 79,700 / 81,200.
Bearish: below 76,270, targets 75,150 / 74,000.The old 76,444 bottom failed.
The revised C/Y low and projected ABC rebound remain tentative.
Breakouts require a 4H close and retest.
Share your thoghts
#elliottwaves #ElliottWaveTheory #elliot #elliotwave
HEP1
·
--
#BTC #TradingCommunity #elliottwaves Price has broken below both bearish confirmation levels and traded through the first two downside target zones. The visible 4H candle reached 76,444 and rebounded toward 78,070. That makes a possible C/Y low worth marking, but a completed correction still needs confirmation. The chart is updated.
Bullish reclaim: 79,178.6 → targets 79,700 / 81,200 / 82,050.
Bearish continuation: below 76,444 → 75,150 / 74,000.76,444 is a potential C/Y low; completion remains unconfirmed. Share your thoughts
Bullish reclaim: 79,178.6 → targets 79,700 / 81,200 / 82,050.
Bearish continuation: below 76,444 → 75,150 / 74,000.76,444 is a potential C/Y low; completion remains unconfirmed. Share your thoughts
1
59

·
--
Bearish
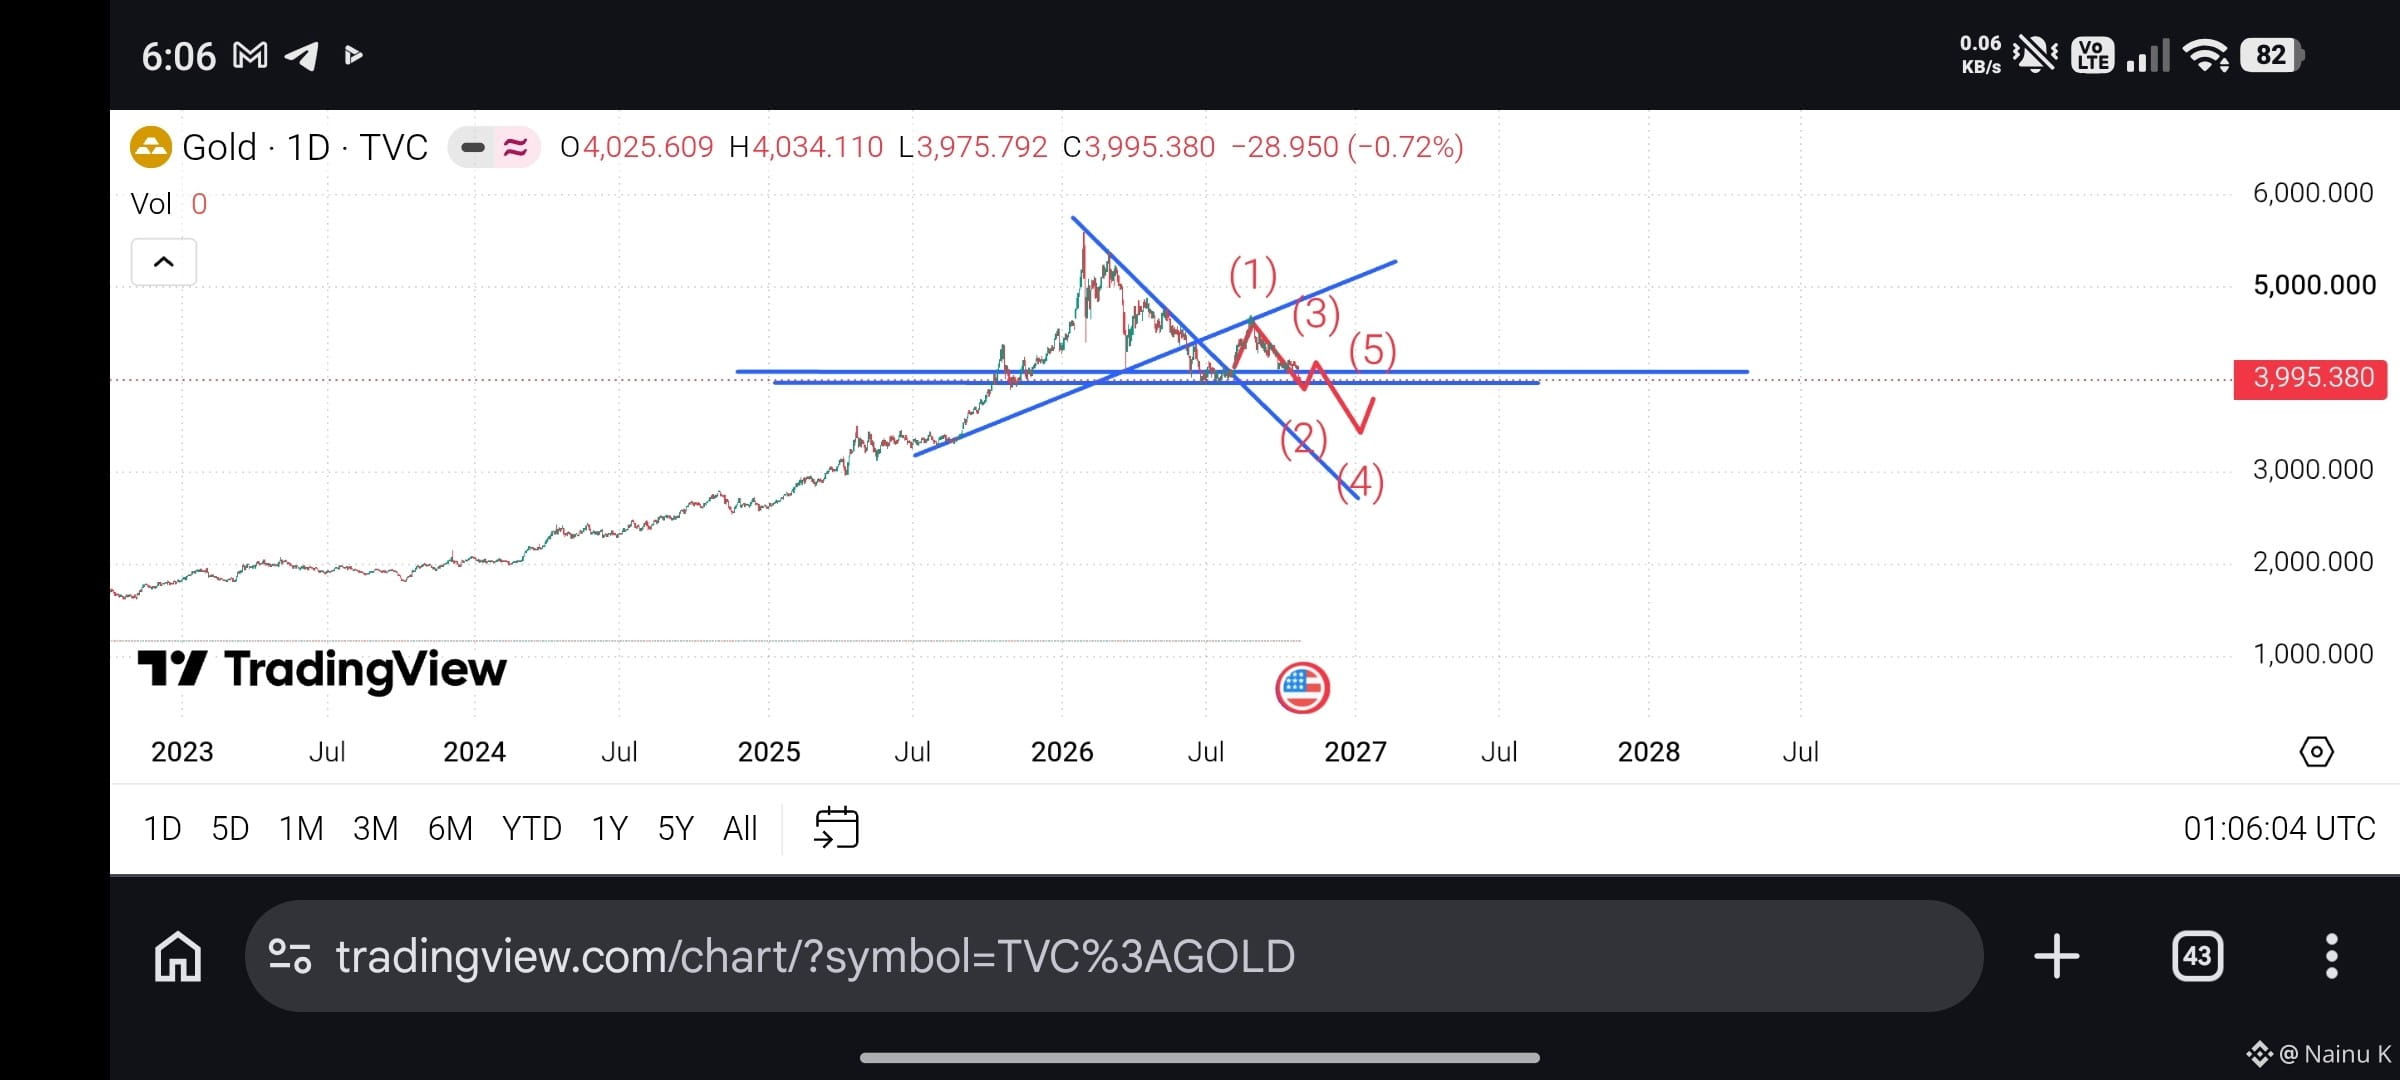
Gold (XAU) Technical Analysis – Elliott Wave & Trendline Outlook 📉📊
Aapke chart ke mutabiq yeh post Binance par share kar sakte hain:
Gold Daily Chart Update! 🪙⚡
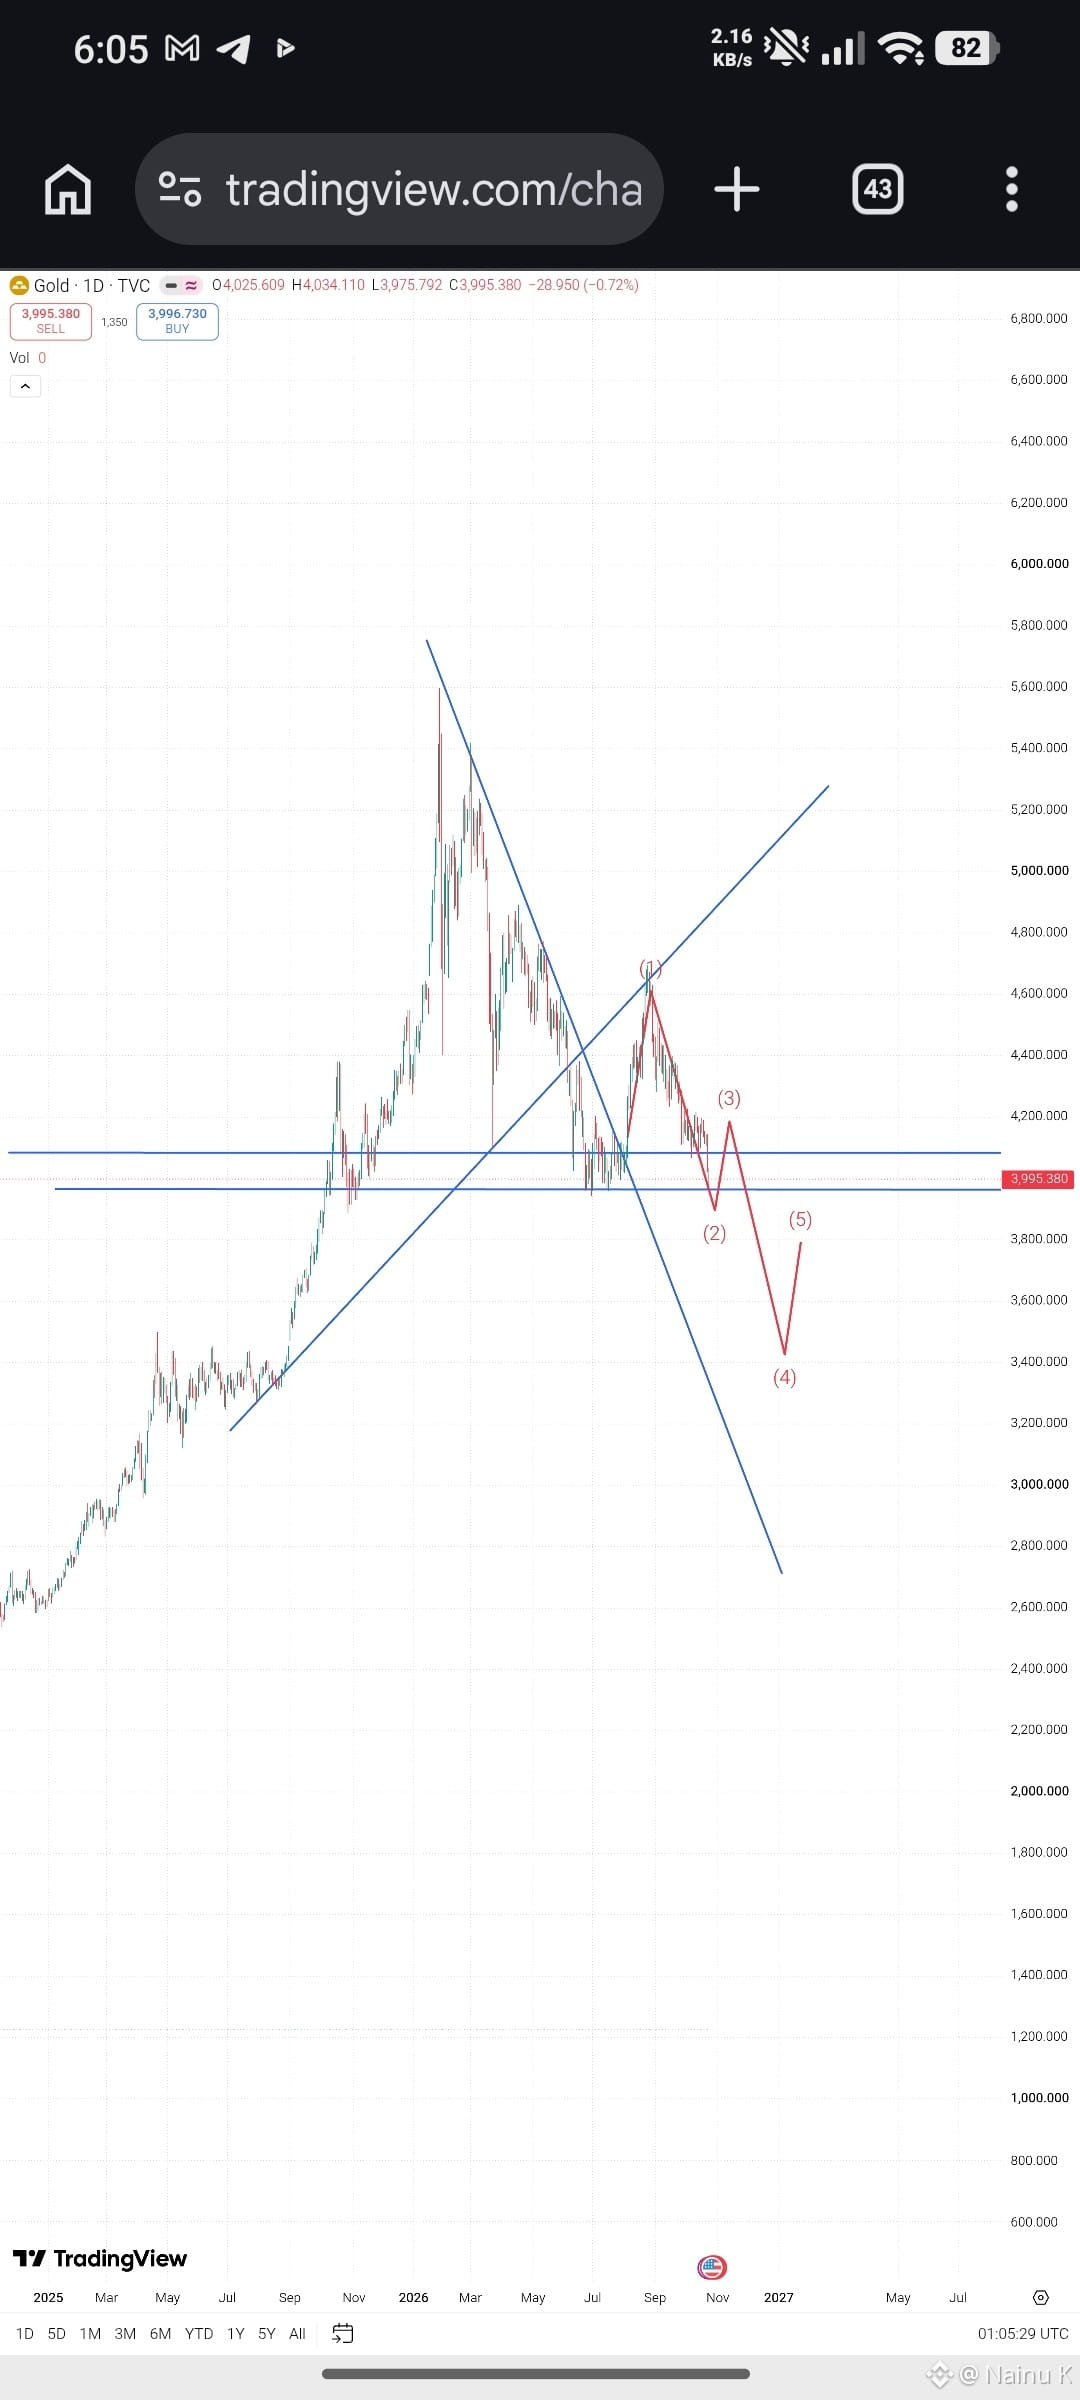
Looking at the current price action on the daily time frame, Gold has formed a significant swing structure, and I'm currently tracking a potential corrective or impulsive wave sequence using Elliott Wave theory.
Key Observations:
Wave Structure: Counting the waves (1 through 5) as marked on the chart, indicating potential downward correction or wave completion phases.
Trendlines & Support/Resistance: The intersecting trendlines show critical rejection zones, and the price is currently hovering near an important horizontal support/resistance level around the 3,995 mark.
Market Outlook: Expecting volatility within this channel. Keep a close eye on price action near these key levels for the next big move!
What are your thoughts on Gold for the coming weeks? Drop your analysis in the comments below! 👇💬 #gold #XAUUSD #elliottwaves #CryptoTradingInsights #TradingViewMagic #MarketUpdate
Gold (XAU) Technical Analysis – Elliott Wave & Trendline Outlook 📉📊
Aapke chart ke mutabiq yeh post Binance par share kar sakte hain:
Gold Daily Chart Update! 🪙⚡
Looking at the current price action on the daily time frame, Gold has formed a significant swing structure, and I'm currently tracking a potential corrective or impulsive wave sequence using Elliott Wave theory.
Key Observations:
Wave Structure: Counting the waves (1 through 5) as marked on the chart, indicating potential downward correction or wave completion phases.
Trendlines & Support/Resistance: The intersecting trendlines show critical rejection zones, and the price is currently hovering near an important horizontal support/resistance level around the 3,995 mark.
Market Outlook: Expecting volatility within this channel. Keep a close eye on price action near these key levels for the next big move!
What are your thoughts on Gold for the coming weeks? Drop your analysis in the comments below! 👇💬 #gold #XAUUSD #elliottwaves #CryptoTradingInsights #TradingViewMagic #MarketUpdate
Aapke chart ke mutabiq yeh post Binance par share kar sakte hain:
Gold Daily Chart Update! 🪙⚡
Looking at the current price action on the daily time frame, Gold has formed a significant swing structure, and I'm currently tracking a potential corrective or impulsive wave sequence using Elliott Wave theory.
Key Observations:
Wave Structure: Counting the waves (1 through 5) as marked on the chart, indicating potential downward correction or wave completion phases.
Trendlines & Support/Resistance: The intersecting trendlines show critical rejection zones, and the price is currently hovering near an important horizontal support/resistance level around the 3,995 mark.
Market Outlook: Expecting volatility within this channel. Keep a close eye on price action near these key levels for the next big move!
What are your thoughts on Gold for the coming weeks? Drop your analysis in the comments below! 👇💬 #gold #XAUUSD #elliottwaves #CryptoTradingInsights #TradingViewMagic #MarketUpdate
1
1
268

·
--
ELLIOTT WAVE MASTERY COURSE: MODULE 4 COMPLETE | DAY 26
MODULE 4 REVIEW: Fibonacci and Waves Mastered
You can now measure waves with Fibonacci precision.
DAYS COMPLETED:
Day 21: Fibonacci Basics
Day 22: Retracements
Day 23: Extensions
Day 24: Projections
Day 25: Time
Day 26: Review
26 Days Done | 104 Slides Learned | 45% Course Progress
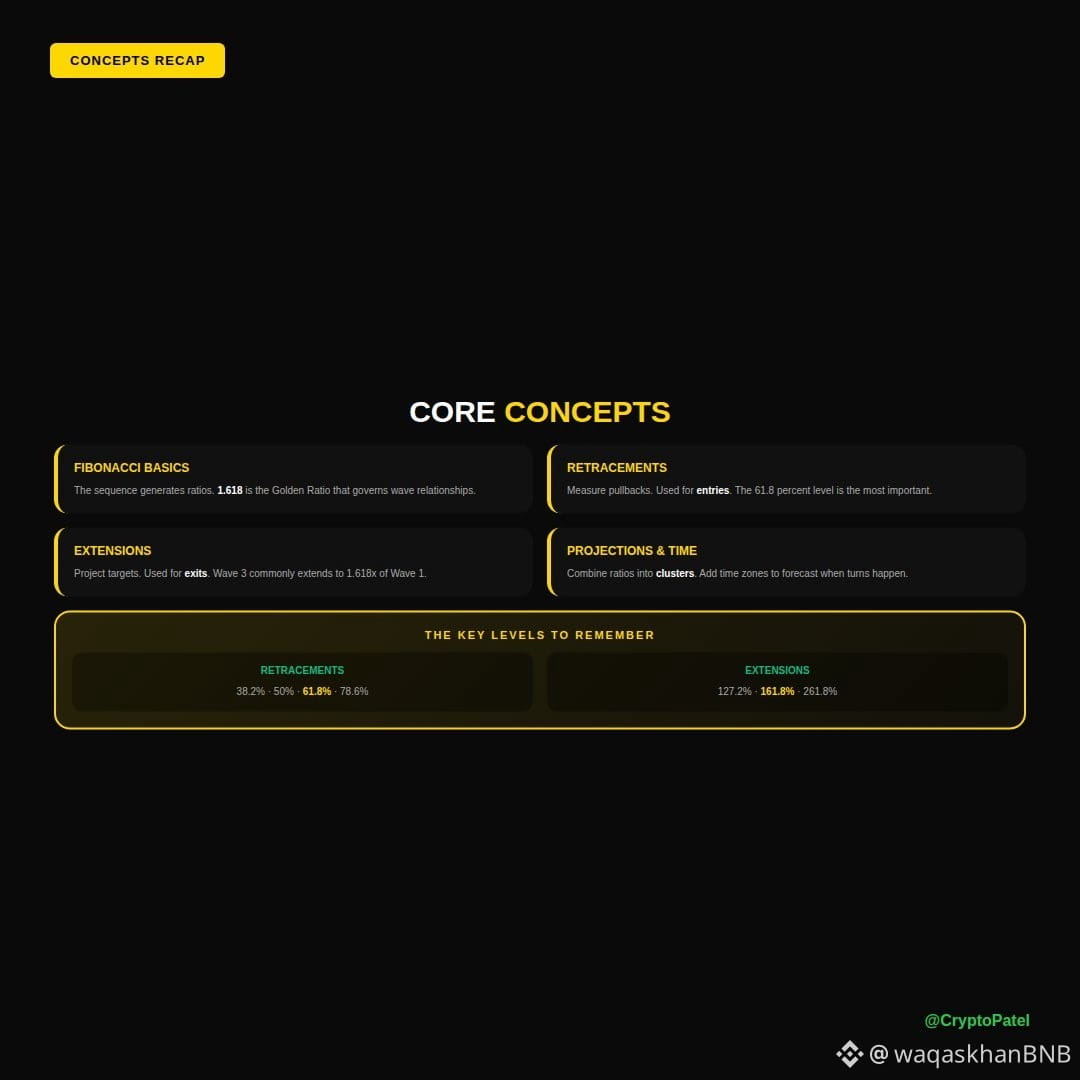
CORE CONCEPTS:
FIBONACCI BASICS: The sequence generates ratios. 1.618 is the Golden Ratio that governs wave relationships.
RETRACEMENTS: Measure pullbacks. Used for entries. The 61.8 percent level is the most important.
EXTENSIONS: Project targets. Used for exits. Wave 3 commonly extends to 1.618x of Wave 1.
PROJECTIONS & TIME: Combine ratios into clusters. Add time zones to forecast when turns happen.
THE KEY LEVELS:
🔹 Retracements: 38.2% / 50% / 61.8% / 78.6%
🔹 Extensions: 127.2% / 161.8% / 261.8%
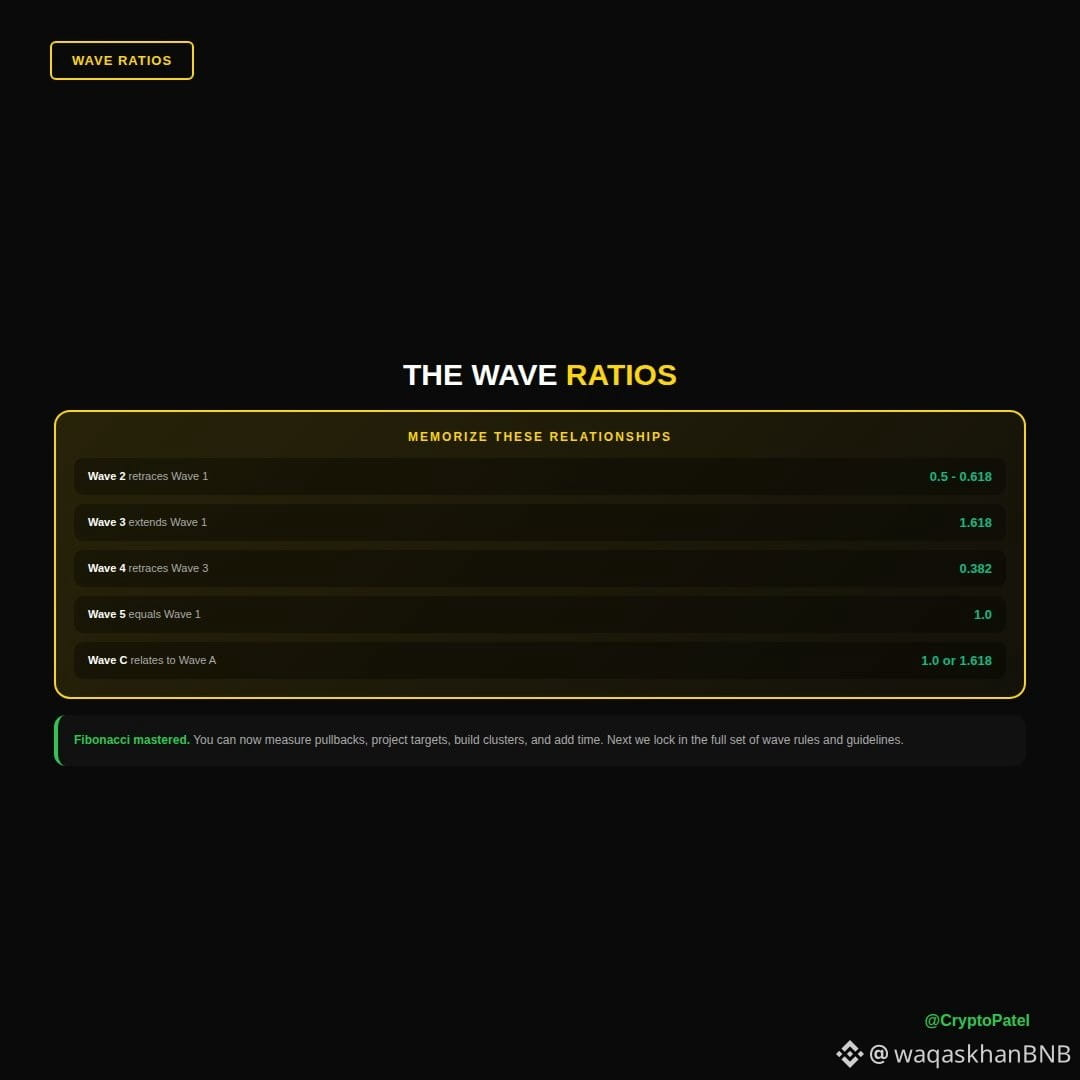
THE WAVE RATIOS (MEMORIZE):
🔹 Wave 2 retraces Wave 1: 0.5 - 0.618
🔹 Wave 3 extends Wave 1: 1.618
🔹 Wave 4 retraces Wave 3: 0.382
🔹 Wave 5 equals Wave 1: 1.0
🔹 Wave C relates to Wave A: 1.0 or 1.618
Fibonacci mastered. You can now measure pullbacks, project targets, build clusters, and add time. Next we lock in the full set of wave rules and guidelines.
COURSE PROGRESS - 4/8 MODULES COMPLETE:
🔸 Module 1: Foundations DONE
🔸 Module 2: Impulse Waves DONE
🔸 Module 3: Corrective Waves DONE
🔸 Module 4: Fibonacci & Waves DONE
🔸 Module 5: Wave Rules & Guidelines UP NEXT
🔸 Module 6: Advanced Patterns
🔸 Module 7: Trading the Waves
🔸 Module 8: Mastery & Application
UP NEXT - MODULE 5: RULES AND GUIDELINES
Day 27: The 3 Rules
Day 28: Alternation
Day 29: Channeling
Day 30+: Equality and more
Fibonacci locked in. Now we master the rules that tie it all together.
Next: Day 27 | The 3 Rules
#elliottwaves #EWT #Fibonacci
ELLIOTT WAVE MASTERY COURSE: MODULE 4 COMPLETE | DAY 26
MODULE 4 REVIEW: Fibonacci and Waves Mastered
You can now measure waves with Fibonacci precision.
DAYS COMPLETED:
Day 21: Fibonacci Basics
Day 22: Retracements
Day 23: Extensions
Day 24: Projections
Day 25: Time
Day 26: Review
26 Days Done | 104 Slides Learned | 45% Course Progress
CORE CONCEPTS:
FIBONACCI BASICS: The sequence generates ratios. 1.618 is the Golden Ratio that governs wave relationships.
RETRACEMENTS: Measure pullbacks. Used for entries. The 61.8 percent level is the most important.
EXTENSIONS: Project targets. Used for exits. Wave 3 commonly extends to 1.618x of Wave 1.
PROJECTIONS & TIME: Combine ratios into clusters. Add time zones to forecast when turns happen.
THE KEY LEVELS:
🔹 Retracements: 38.2% / 50% / 61.8% / 78.6%
🔹 Extensions: 127.2% / 161.8% / 261.8%
THE WAVE RATIOS (MEMORIZE):
🔹 Wave 2 retraces Wave 1: 0.5 - 0.618
🔹 Wave 3 extends Wave 1: 1.618
🔹 Wave 4 retraces Wave 3: 0.382
🔹 Wave 5 equals Wave 1: 1.0
🔹 Wave C relates to Wave A: 1.0 or 1.618
Fibonacci mastered. You can now measure pullbacks, project targets, build clusters, and add time. Next we lock in the full set of wave rules and guidelines.
COURSE PROGRESS - 4/8 MODULES COMPLETE:
🔸 Module 1: Foundations DONE
🔸 Module 2: Impulse Waves DONE
🔸 Module 3: Corrective Waves DONE
🔸 Module 4: Fibonacci & Waves DONE
🔸 Module 5: Wave Rules & Guidelines UP NEXT
🔸 Module 6: Advanced Patterns
🔸 Module 7: Trading the Waves
🔸 Module 8: Mastery & Application
UP NEXT - MODULE 5: RULES AND GUIDELINES
Day 27: The 3 Rules
Day 28: Alternation
Day 29: Channeling
Day 30+: Equality and more
Fibonacci locked in. Now we master the rules that tie it all together.
Next: Day 27 | The 3 Rules
#elliottwaves #EWT #Fibonacci
MODULE 4 REVIEW: Fibonacci and Waves Mastered
You can now measure waves with Fibonacci precision.
DAYS COMPLETED:
Day 21: Fibonacci Basics
Day 22: Retracements
Day 23: Extensions
Day 24: Projections
Day 25: Time
Day 26: Review
26 Days Done | 104 Slides Learned | 45% Course Progress
CORE CONCEPTS:
FIBONACCI BASICS: The sequence generates ratios. 1.618 is the Golden Ratio that governs wave relationships.
RETRACEMENTS: Measure pullbacks. Used for entries. The 61.8 percent level is the most important.
EXTENSIONS: Project targets. Used for exits. Wave 3 commonly extends to 1.618x of Wave 1.
PROJECTIONS & TIME: Combine ratios into clusters. Add time zones to forecast when turns happen.
THE KEY LEVELS:
🔹 Retracements: 38.2% / 50% / 61.8% / 78.6%
🔹 Extensions: 127.2% / 161.8% / 261.8%
THE WAVE RATIOS (MEMORIZE):
🔹 Wave 2 retraces Wave 1: 0.5 - 0.618
🔹 Wave 3 extends Wave 1: 1.618
🔹 Wave 4 retraces Wave 3: 0.382
🔹 Wave 5 equals Wave 1: 1.0
🔹 Wave C relates to Wave A: 1.0 or 1.618
Fibonacci mastered. You can now measure pullbacks, project targets, build clusters, and add time. Next we lock in the full set of wave rules and guidelines.
COURSE PROGRESS - 4/8 MODULES COMPLETE:
🔸 Module 1: Foundations DONE
🔸 Module 2: Impulse Waves DONE
🔸 Module 3: Corrective Waves DONE
🔸 Module 4: Fibonacci & Waves DONE
🔸 Module 5: Wave Rules & Guidelines UP NEXT
🔸 Module 6: Advanced Patterns
🔸 Module 7: Trading the Waves
🔸 Module 8: Mastery & Application
UP NEXT - MODULE 5: RULES AND GUIDELINES
Day 27: The 3 Rules
Day 28: Alternation
Day 29: Channeling
Day 30+: Equality and more
Fibonacci locked in. Now we master the rules that tie it all together.
Next: Day 27 | The 3 Rules
#elliottwaves #EWT #Fibonacci


1
125

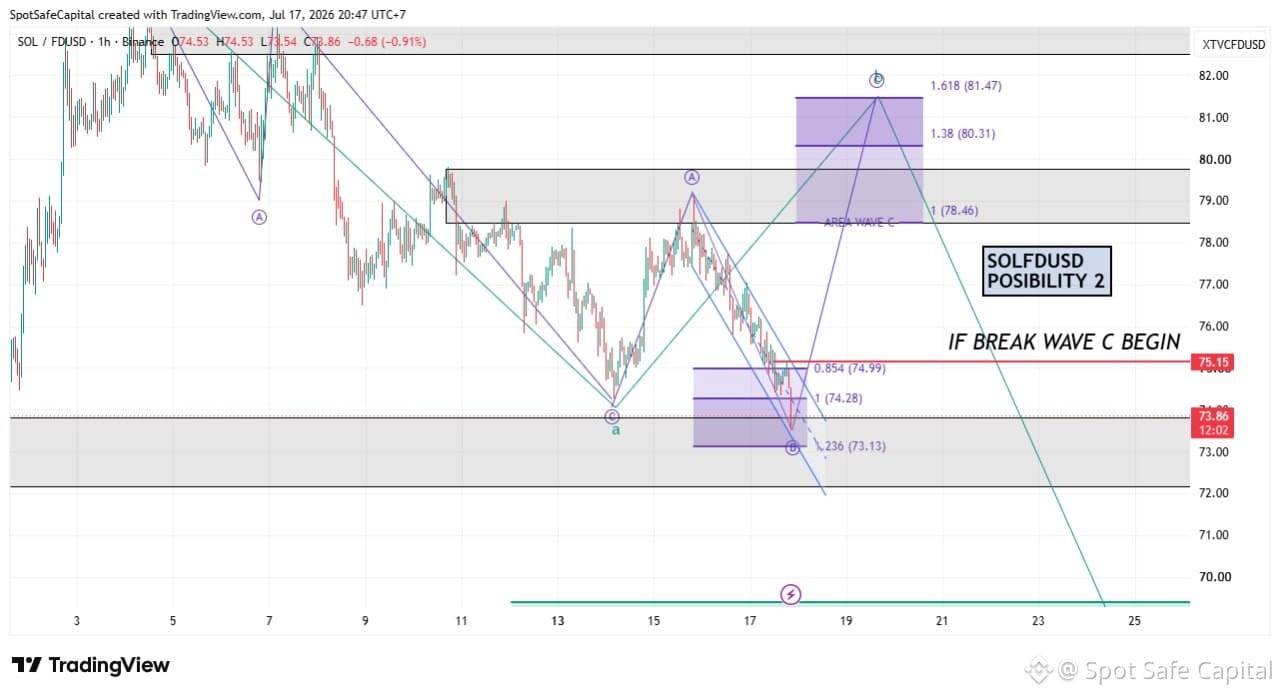
$SOL FDUSD 17/7/2026 20.54 UTC+7
Waiting for Breakout Confirmation 📊
{spot}(SOLUSDT)
From my Elliott Wave perspective, I believe the purple Wave B correction has likely been completed. At this stage, I am not entering the trade yet. Instead, I'm waiting for a confirmed breakout above the $75.15 resistance.
A successful break and close above this level would significantly increase the probability that Wave C has begun.
📈 Trade Plan
✅ Entry Trigger
Break & Close above $75.15
🎯 Take Profit Targets (Wave C Fibonacci Extension)
TP1 — Fibonacci 1.000
$78.46
TP2 — Fibonacci 1.380
$80.31
TP3 — Fibonacci 1.618
$81.47
Wave C commonly extends toward the 1.000, 1.380, or 1.618 Fibonacci Extension, making these levels my primary upside targets if the breakout is confirmed.
For now, patience is key. I prefer waiting for confirmation rather than entering before resistance is broken.
#sol #elliottwaves
$SOL FDUSD 17/7/2026 20.54 UTC+7
Waiting for Breakout Confirmation 📊
From my Elliott Wave perspective, I believe the purple Wave B correction has likely been completed. At this stage, I am not entering the trade yet. Instead, I'm waiting for a confirmed breakout above the $75.15 resistance.
A successful break and close above this level would significantly increase the probability that Wave C has begun.
📈 Trade Plan
✅ Entry Trigger
Break & Close above $75.15
🎯 Take Profit Targets (Wave C Fibonacci Extension)
TP1 — Fibonacci 1.000
$78.46
TP2 — Fibonacci 1.380
$80.31
TP3 — Fibonacci 1.618
$81.47
Wave C commonly extends toward the 1.000, 1.380, or 1.618 Fibonacci Extension, making these levels my primary upside targets if the breakout is confirmed.
For now, patience is key. I prefer waiting for confirmation rather than entering before resistance is broken.
#sol #elliottwaves
Waiting for Breakout Confirmation 📊
From my Elliott Wave perspective, I believe the purple Wave B correction has likely been completed. At this stage, I am not entering the trade yet. Instead, I'm waiting for a confirmed breakout above the $75.15 resistance.
A successful break and close above this level would significantly increase the probability that Wave C has begun.
📈 Trade Plan
✅ Entry Trigger
Break & Close above $75.15
🎯 Take Profit Targets (Wave C Fibonacci Extension)
TP1 — Fibonacci 1.000
$78.46
TP2 — Fibonacci 1.380
$80.31
TP3 — Fibonacci 1.618
$81.47
Wave C commonly extends toward the 1.000, 1.380, or 1.618 Fibonacci Extension, making these levels my primary upside targets if the breakout is confirmed.
For now, patience is key. I prefer waiting for confirmation rather than entering before resistance is broken.
#sol #elliottwaves
10
7
2.2k

·
--
PAXGUSD $PAXG Bullish Setup 📈
Gold is currently holding above a key support zone, and I’m watching for a potential bullish continuation toward 4,511+.
🎯 Target: Above 4,511
❌ Invalidation: This analysis is invalid if price drops below 4,281.
This is my personal technical analysis based on Elliott Wave structure, not financial advice.
#PAXGUSDT #GOLD_UPDATE #elliottwaves #BinanceSquareFamily
PAXGUSD $PAXG Bullish Setup 📈
Gold is currently holding above a key support zone, and I’m watching for a potential bullish continuation toward 4,511+.
🎯 Target: Above 4,511
❌ Invalidation: This analysis is invalid if price drops below 4,281.
This is my personal technical analysis based on Elliott Wave structure, not financial advice.
#PAXGUSDT #GOLD_UPDATE #elliottwaves #BinanceSquareFamily
Gold is currently holding above a key support zone, and I’m watching for a potential bullish continuation toward 4,511+.
🎯 Target: Above 4,511
❌ Invalidation: This analysis is invalid if price drops below 4,281.
This is my personal technical analysis based on Elliott Wave structure, not financial advice.
#PAXGUSDT #GOLD_UPDATE #elliottwaves #BinanceSquareFamily

158

·
--
Bullish
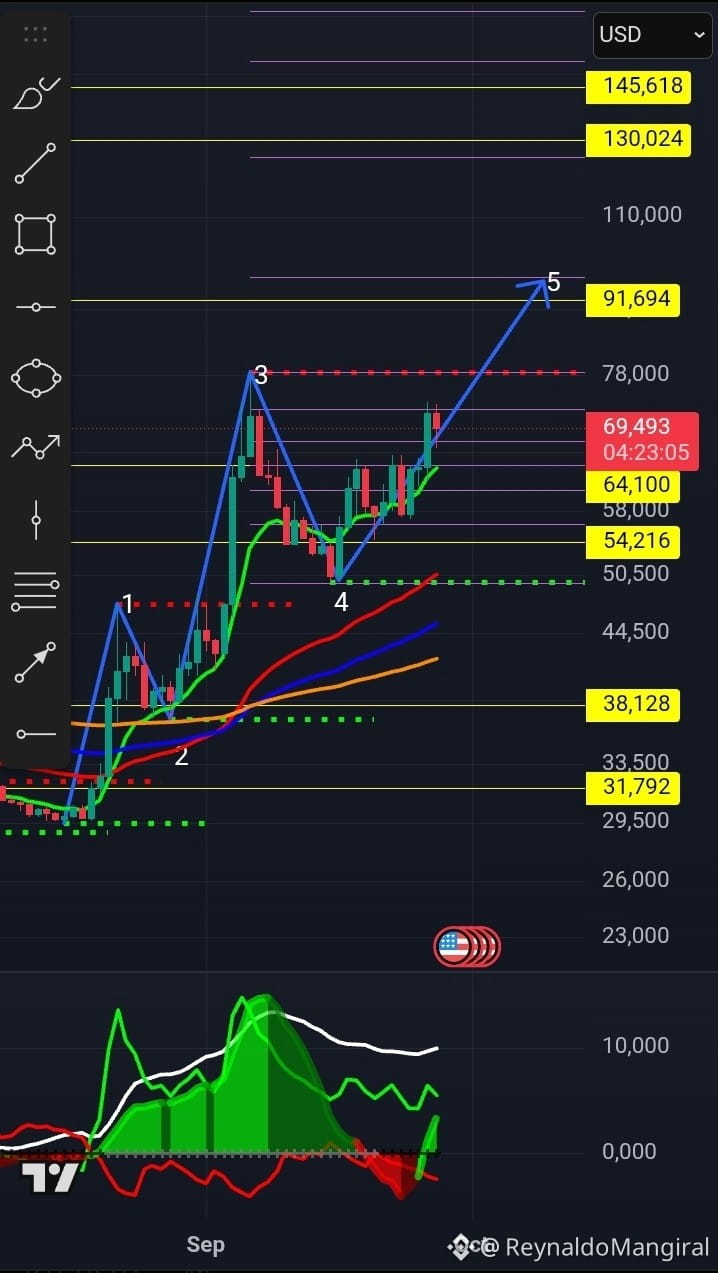
In $DASH vamos for the fifth #elliottwaves (Elliott waves) we project it to $100 dlls.
In $DASH vamos for the fifth #elliottwaves (Elliott waves) we project it to $100 dlls.
16
1
8
17.7k

·
--
Bearish
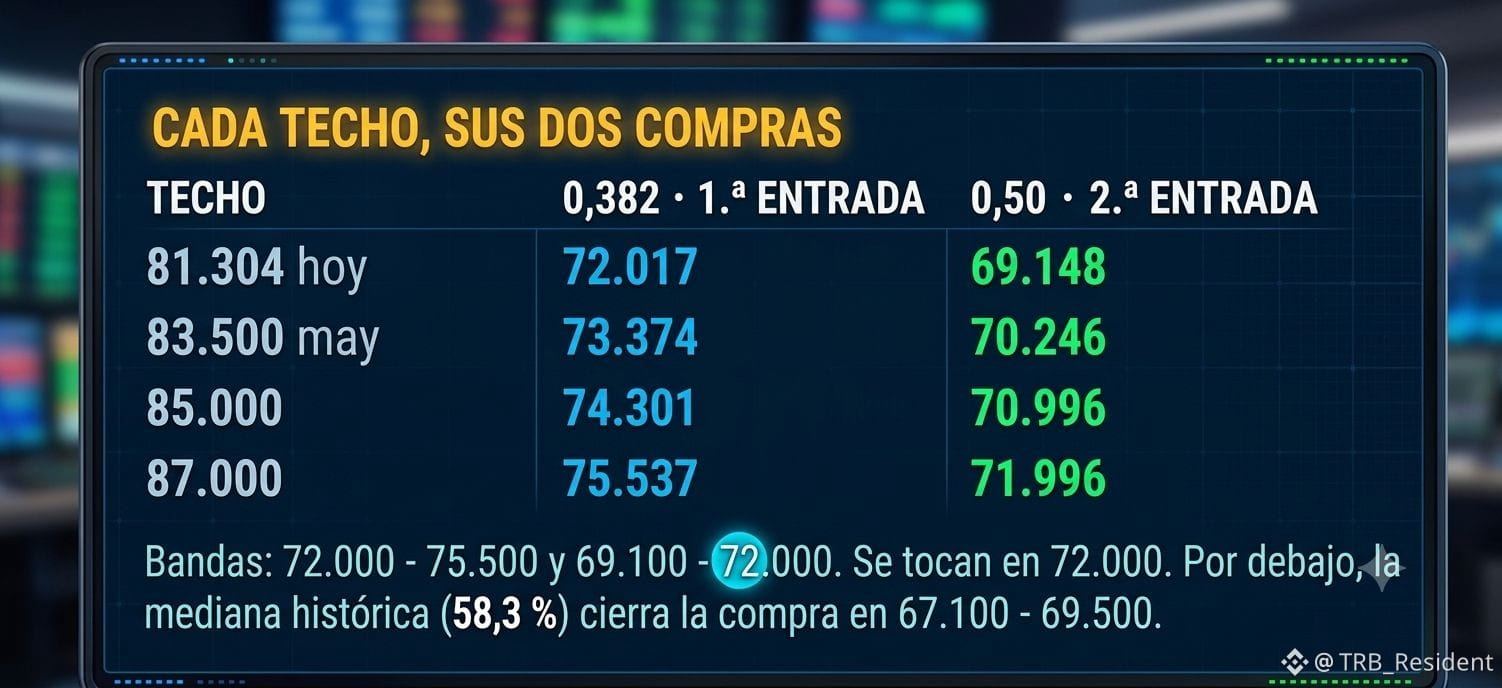
Possible scenarios for the next 11 days, if you want to buy BTC and crypto. Our idea is to master our emotions and the market will always give us opportunities ✌️😎.
#BTC #elliottwaves #Binance #venezuela
Possible scenarios for the next 11 days, if you want to buy BTC and crypto. Our idea is to master our emotions and the market will always give us opportunities ✌️😎.
#BTC #elliottwaves #Binance #venezuela
#BTC #elliottwaves #Binance #venezuela
216
·
--
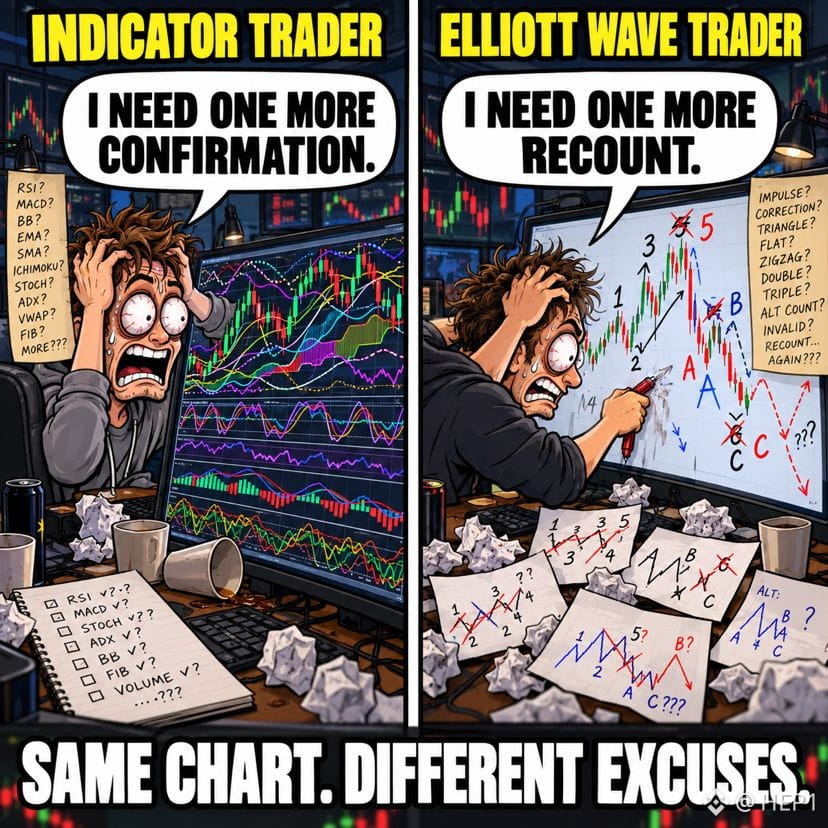
Indicators: waiting for confirmation. Elliott Wave: recounting since Monday. 😂🤣😂📊🌊 #TradingMemes #TechnicalAnalysis #ElliottWaveTheory #BinanceSquare #elliottwaves
Indicators: waiting for confirmation. Elliott Wave: recounting since Monday. 😂🤣😂📊🌊 #TradingMemes #TechnicalAnalysis #ElliottWaveTheory #BinanceSquare #elliottwaves
1
90


Article
🚀 A NEW PHASE IN THE CRYPTO MARKET BEGINSI want to share my approach to analyzing the market with this community.
My main focus will be on:
📊 Elliott waves.
📉 Market structures.
💧 Liquidity sweeps.
📈 Bitcoin and altcoin analysis.
🧠 Psychology and risk management.
It’s not about guessing where the price will go, but studying what the market is doing, identifying possible scenarios, and assessing what conditions could confirm or invalidate them.
My first focus will be $BTC.
I think this is an interesting time to study its structure on lower timeframes and understand what kind of move it could make in November.
🚀 A NEW PHASE IN THE CRYPTO MARKET BEGINS
I want to share my approach to analyzing the market with this community.
My main focus will be on:
📊 Elliott waves.
📉 Market structures.
💧 Liquidity sweeps.
📈 Bitcoin and altcoin analysis.
🧠 Psychology and risk management.
It’s not about guessing where the price will go, but studying what the market is doing, identifying possible scenarios, and assessing what conditions could confirm or invalidate them.
My first focus will be $BTC .
I think this is an interesting time to study its structure on lower timeframes and understand what kind of move it could make in November.
My main focus will be on:
📊 Elliott waves.
📉 Market structures.
💧 Liquidity sweeps.
📈 Bitcoin and altcoin analysis.
🧠 Psychology and risk management.
It’s not about guessing where the price will go, but studying what the market is doing, identifying possible scenarios, and assessing what conditions could confirm or invalidate them.
My first focus will be $BTC .
I think this is an interesting time to study its structure on lower timeframes and understand what kind of move it could make in November.
67

Okay, well, BTC tanks
Great downtrend, closed a lot of PNL already.
I'm simply moving SL to profit all the time, and yet it continues to drop.
Made 40 risks.
I hope everyone is capitalizing on that move!
Been posting setup yesterday at morning...
#elliottwaves #btc
Okay, well, BTC tanks
Great downtrend, closed a lot of PNL already.
I'm simply moving SL to profit all the time, and yet it continues to drop.
Made 40 risks.
I hope everyone is capitalizing on that move!
Been posting setup yesterday at morning...
#elliottwaves #btc
Great downtrend, closed a lot of PNL already.
I'm simply moving SL to profit all the time, and yet it continues to drop.
Made 40 risks.
I hope everyone is capitalizing on that move!
Been posting setup yesterday at morning...
#elliottwaves #btc

2
8
1.4k


Article
Bitcoin Analysis | Bulls Still Hold the Key LevelBitcoin continues to trade above the $64,000 invalidation zone, keeping the bullish market structure intact.
🔑 Key Levels
🟢 Support / Invalidation: $64,000
As long as BTC remains above this level, buyers continue to control the current structure.
🎯 Target 1: $67,000
A confirmed breakout into this resistance zone could trigger the next wave of bullish momentum.
🚀 Target 2: $70,000
If price successfully establishes above $67,000 with increasing volume, the psychological $70K level becomes a realistic technical objective.
What I'm Watching
• Price acceptance above $64,000
• Increasing buying volume
• Strong reaction around $67,000
• Market structure remaining bullish
⚠️ A sustained move below $64,000 would invalidate this bullish scenario and increase the probability of a deeper correction.
Markets reward patience and disciplined risk management—not certainty.
What is your next Bitcoin target?
Pls support & Follow! Enjoy watching.
#btc70k #BTC #MarketSentimentToday #elliottwaves #BitcoinForecast
Bitcoin Analysis | Bulls Still Hold the Key Level
Bitcoin continues to trade above the $64,000 invalidation zone, keeping the bullish market structure intact.
🔑 Key Levels
🟢 Support / Invalidation: $64,000
As long as BTC remains above this level, buyers continue to control the current structure.
🎯 Target 1: $67,000
A confirmed breakout into this resistance zone could trigger the next wave of bullish momentum.
🚀 Target 2: $70,000
If price successfully establishes above $67,000 with increasing volume, the psychological $70K level becomes a realistic technical objective.
What I'm Watching
• Price acceptance above $64,000
• Increasing buying volume
• Strong reaction around $67,000
• Market structure remaining bullish
⚠️ A sustained move below $64,000 would invalidate this bullish scenario and increase the probability of a deeper correction.
Markets reward patience and disciplined risk management—not certainty.
What is your next Bitcoin target?
Pls support & Follow! Enjoy watching.
#btc70k #BTC #MarketSentimentToday #elliottwaves #BitcoinForecast
🔑 Key Levels
🟢 Support / Invalidation: $64,000
As long as BTC remains above this level, buyers continue to control the current structure.
🎯 Target 1: $67,000
A confirmed breakout into this resistance zone could trigger the next wave of bullish momentum.
🚀 Target 2: $70,000
If price successfully establishes above $67,000 with increasing volume, the psychological $70K level becomes a realistic technical objective.
What I'm Watching
• Price acceptance above $64,000
• Increasing buying volume
• Strong reaction around $67,000
• Market structure remaining bullish
⚠️ A sustained move below $64,000 would invalidate this bullish scenario and increase the probability of a deeper correction.
Markets reward patience and disciplined risk management—not certainty.
What is your next Bitcoin target?
Pls support & Follow! Enjoy watching.
#btc70k #BTC #MarketSentimentToday #elliottwaves #BitcoinForecast
116

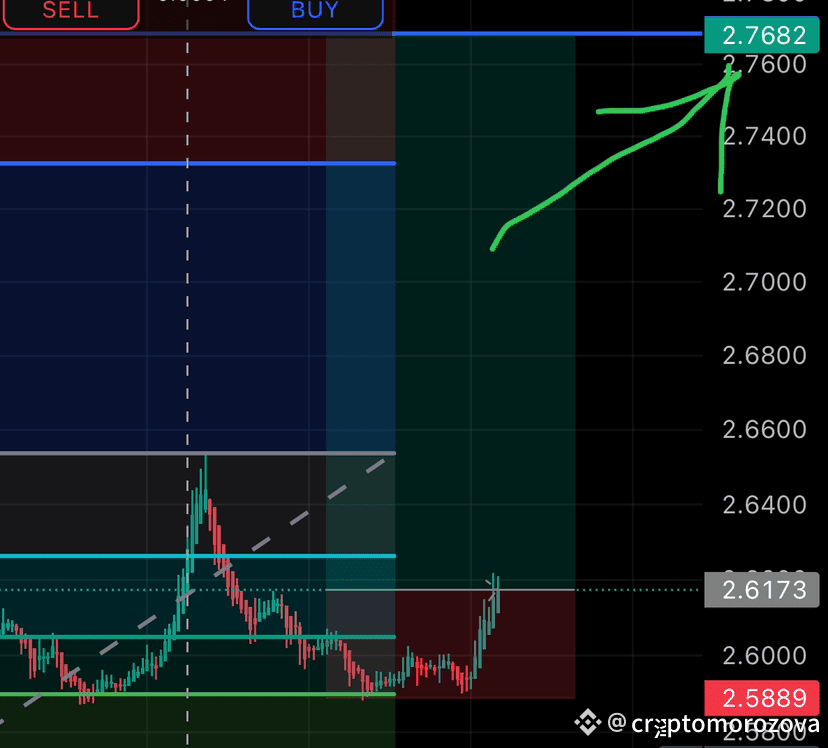
Two good longs, great Monday, nice volatility in London session. Lets see what USA brings to the table in the near hours!
$BTC
#elliottwaves #futures
Two good longs, great Monday, nice volatility in London session. Lets see what USA brings to the table in the near hours!
$BTC
#elliottwaves #futures
$BTC
#elliottwaves #futures


96
$BTC
Great setup, +16 risks
Still see a lot of bearish orderflow, so we'll probably see some more new local lows👀
Hope everyone is capitalizing on that move✈️
Waiting for a good range to look for new setups, either for long or shorts
#elliottwaves #btc
$BTC
Great setup, +16 risks
Still see a lot of bearish orderflow, so we'll probably see some more new local lows👀
Hope everyone is capitalizing on that move✈️
Waiting for a good range to look for new setups, either for long or shorts
#elliottwaves #btc
Great setup, +16 risks
Still see a lot of bearish orderflow, so we'll probably see some more new local lows👀
Hope everyone is capitalizing on that move✈️
Waiting for a good range to look for new setups, either for long or shorts
#elliottwaves #btc


8
699

·
--
Bearish
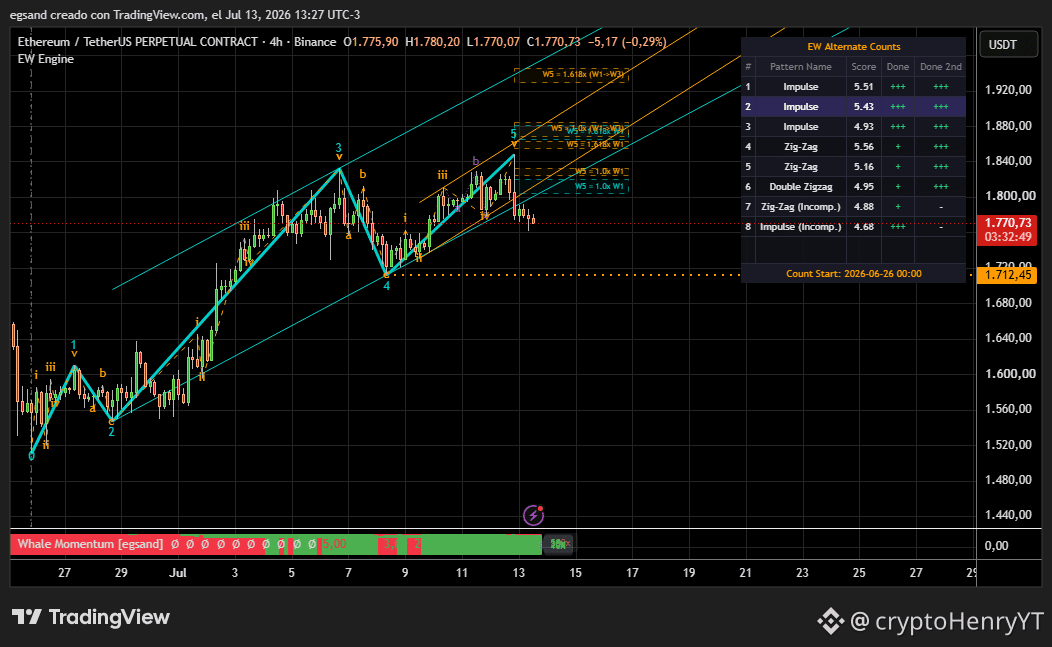
#elliottwaves #ElliottWaveTheory Actualización conteo de Ethereum 4H $ETH se comes a zig-zag? a flat? what will it be?
#elliottwaves #ElliottWaveTheory Actualización conteo de Ethereum 4H $ETH se comes a zig-zag? a flat? what will it be?
55

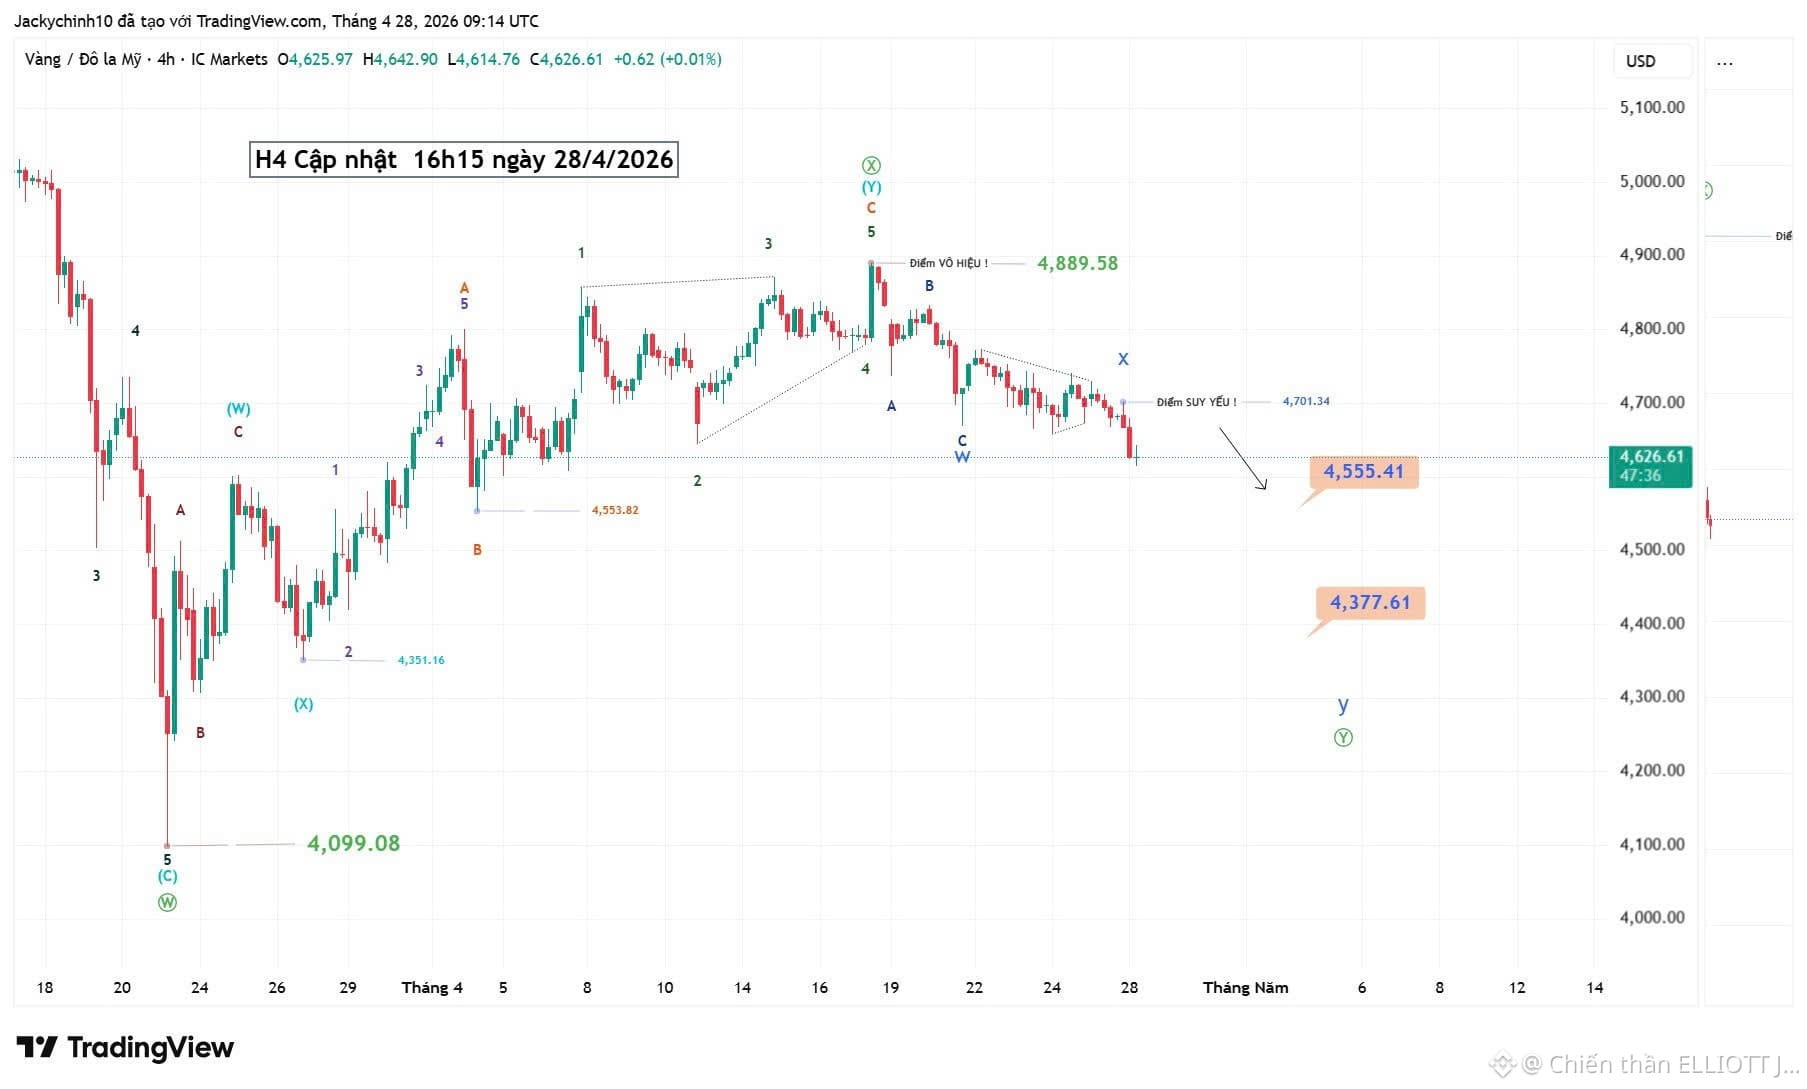
GOLD VIEW – H4 update 16:15 on 28/04/2026
To keep it short, across the cycles, gold is clearly weakening, no longer experiencing those immediate bounces like before.
After failing at the 4.88x zone (the invalidation point), the price reversed and has been trending down quite neatly. Since then, it's been a sideways drift downwards, looking like it’s moving horizontally, but in reality, it's being pushed down in small increments. Lower highs are forming, and the recovery strength is dwindling. (I’ve shared this in videos and live sessions with charts showing a sideways DOW gently trending down, recovering, and gently moving down...!
Currently, the price is hovering around the 4.62x zone – this is a very sensitive area. If it holds, we might see some more sideways action. But if it decisively breaks down, the chances are high we’ll continue the downward move.
The scenario I’m looking at: Shorting remains the primary strategy, no need for much debate.
If there’s a bounce back up to around 4.70x without a strong break → prioritize setting up for another sell.
If the price breaks below the current zone → the near target is 4.55x, and deeper is 4.37x.
Key points to note:
4.70x: weakness zone – if it bounces back here without strength, it’s a great sign to re-enter.
4.55x: near target, likely to react.
4.37x: deeper target if the downward momentum expands.
4.88x: if this zone breaks, the bearish scenario is considered invalid.
Strategy suggestions for the crew:
This is not the time to catch the bottom. The price is moving in a slow but steady “bleeding” manner. For those experienced in trading, be patient and wait for a bounce to short; don't fomo halfway through.
The market isn’t quick right now but is very “uncomfortable”; those who are impatient can easily get slapped. Patience is the biggest advantage at this moment. I’ll be updating short-term VIEWS, like M5, M15, M30, H1, or entry points for those looking to ride the waves. For anyone wanting to join, FOLLOW me! #elliottwaves #Vàng $XAU
GOLD VIEW – H4 update 16:15 on 28/04/2026
To keep it short, across the cycles, gold is clearly weakening, no longer experiencing those immediate bounces like before.
After failing at the 4.88x zone (the invalidation point), the price reversed and has been trending down quite neatly. Since then, it's been a sideways drift downwards, looking like it’s moving horizontally, but in reality, it's being pushed down in small increments. Lower highs are forming, and the recovery strength is dwindling. (I’ve shared this in videos and live sessions with charts showing a sideways DOW gently trending down, recovering, and gently moving down...!
Currently, the price is hovering around the 4.62x zone – this is a very sensitive area. If it holds, we might see some more sideways action. But if it decisively breaks down, the chances are high we’ll continue the downward move.
The scenario I’m looking at: Shorting remains the primary strategy, no need for much debate.
If there’s a bounce back up to around 4.70x without a strong break → prioritize setting up for another sell.
If the price breaks below the current zone → the near target is 4.55x, and deeper is 4.37x.
Key points to note:
4.70x: weakness zone – if it bounces back here without strength, it’s a great sign to re-enter.
4.55x: near target, likely to react.
4.37x: deeper target if the downward momentum expands.
4.88x: if this zone breaks, the bearish scenario is considered invalid.
Strategy suggestions for the crew:
This is not the time to catch the bottom. The price is moving in a slow but steady “bleeding” manner. For those experienced in trading, be patient and wait for a bounce to short; don't fomo halfway through.
The market isn’t quick right now but is very “uncomfortable”; those who are impatient can easily get slapped. Patience is the biggest advantage at this moment. I’ll be updating short-term VIEWS, like M5, M15, M30, H1, or entry points for those looking to ride the waves. For anyone wanting to join, FOLLOW me! #elliottwaves #Vàng $XAU
To keep it short, across the cycles, gold is clearly weakening, no longer experiencing those immediate bounces like before.
After failing at the 4.88x zone (the invalidation point), the price reversed and has been trending down quite neatly. Since then, it's been a sideways drift downwards, looking like it’s moving horizontally, but in reality, it's being pushed down in small increments. Lower highs are forming, and the recovery strength is dwindling. (I’ve shared this in videos and live sessions with charts showing a sideways DOW gently trending down, recovering, and gently moving down...!
Currently, the price is hovering around the 4.62x zone – this is a very sensitive area. If it holds, we might see some more sideways action. But if it decisively breaks down, the chances are high we’ll continue the downward move.
The scenario I’m looking at: Shorting remains the primary strategy, no need for much debate.
If there’s a bounce back up to around 4.70x without a strong break → prioritize setting up for another sell.
If the price breaks below the current zone → the near target is 4.55x, and deeper is 4.37x.
Key points to note:
4.70x: weakness zone – if it bounces back here without strength, it’s a great sign to re-enter.
4.55x: near target, likely to react.
4.37x: deeper target if the downward momentum expands.
4.88x: if this zone breaks, the bearish scenario is considered invalid.
Strategy suggestions for the crew:
This is not the time to catch the bottom. The price is moving in a slow but steady “bleeding” manner. For those experienced in trading, be patient and wait for a bounce to short; don't fomo halfway through.
The market isn’t quick right now but is very “uncomfortable”; those who are impatient can easily get slapped. Patience is the biggest advantage at this moment. I’ll be updating short-term VIEWS, like M5, M15, M30, H1, or entry points for those looking to ride the waves. For anyone wanting to join, FOLLOW me! #elliottwaves #Vàng $XAU
2
445


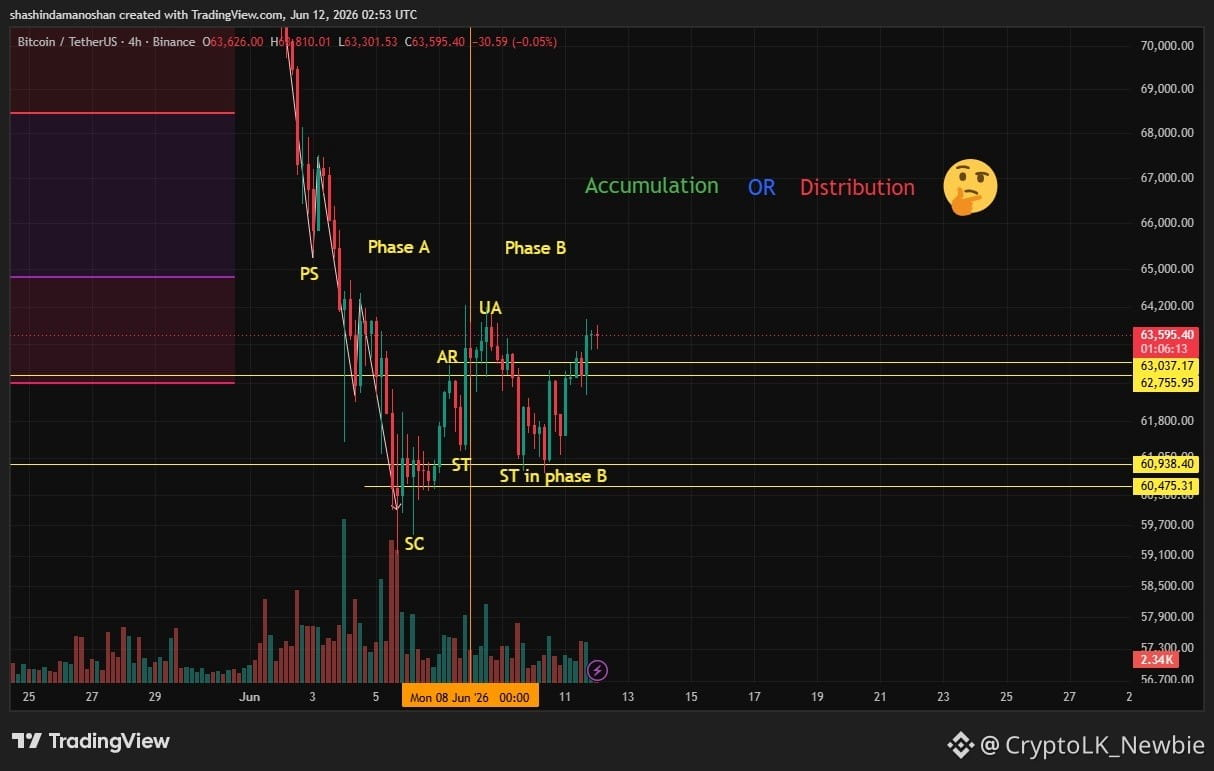
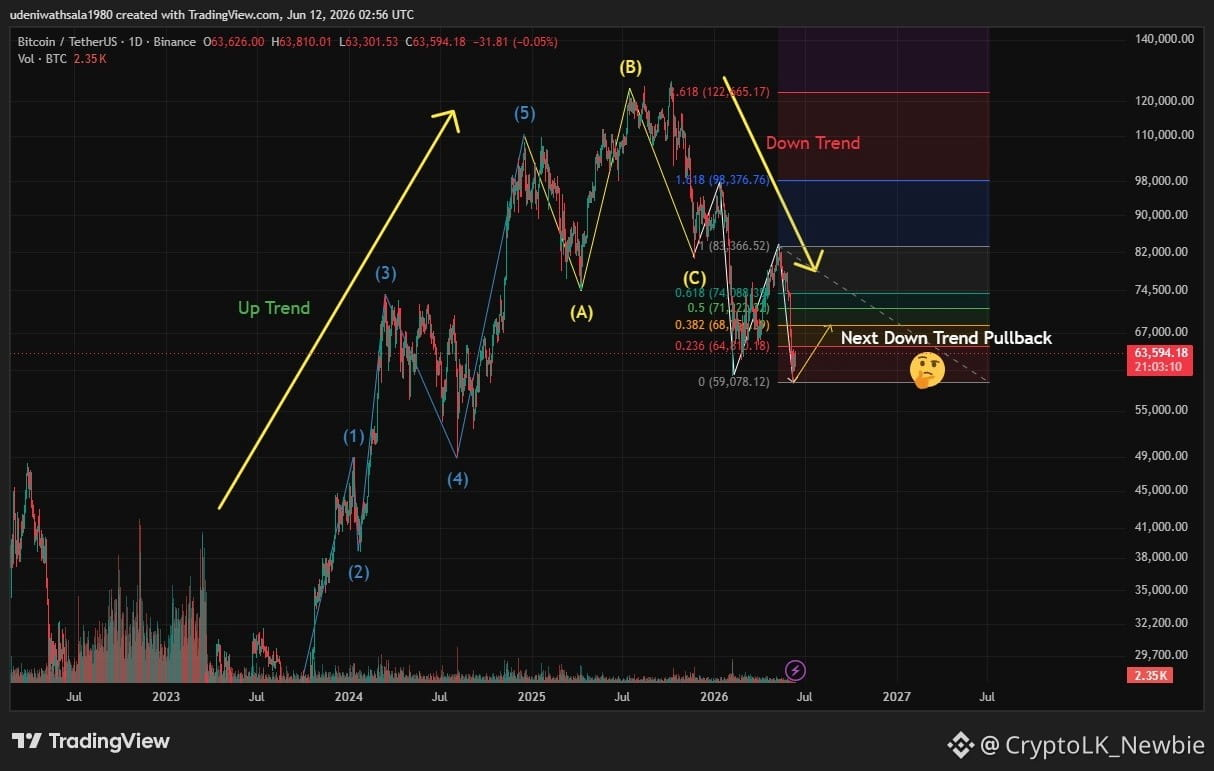
BONUS TA Day: BTC Daily vs 4H 📊
Just practicing
Daily Chart - Elliott Wave:
5 waves up and ABC correction completed, now the next pattern is forming
Key support: $59k - $68k zone
If $59k breaks → Next Down Trend Pullback
4H Chart - Wyckoff Method:
Currently in Phase B: Accumulation OR Distribution? 🤔
$60.5k = ST support | $63.3k = UA resistance
Breakout will decide the direction
Conflict: Daily says down, 4H says consolidation
Which timeframe wins this battle?
NFA - Just learning & documenting my journey
Did I connect these right OG's? Teach me 👇
#BTC #TechnicalAnalysiss #LearningInPublic #elliottwaves #wyckoff
$BTC $ETH $BNB
BONUS TA Day: BTC Daily vs 4H 📊
Just practicing
Daily Chart - Elliott Wave:
5 waves up and ABC correction completed, now the next pattern is forming
Key support: $59k - $68k zone
If $59k breaks → Next Down Trend Pullback
4H Chart - Wyckoff Method:
Currently in Phase B: Accumulation OR Distribution? 🤔
$60.5k = ST support | $63.3k = UA resistance
Breakout will decide the direction
Conflict: Daily says down, 4H says consolidation
Which timeframe wins this battle?
NFA - Just learning & documenting my journey
Did I connect these right OG's? Teach me 👇
#BTC #TechnicalAnalysiss #LearningInPublic #elliottwaves #wyckoff
$BTC $ETH $BNB
Just practicing
Daily Chart - Elliott Wave:
5 waves up and ABC correction completed, now the next pattern is forming
Key support: $59k - $68k zone
If $59k breaks → Next Down Trend Pullback
4H Chart - Wyckoff Method:
Currently in Phase B: Accumulation OR Distribution? 🤔
$60.5k = ST support | $63.3k = UA resistance
Breakout will decide the direction
Conflict: Daily says down, 4H says consolidation
Which timeframe wins this battle?
NFA - Just learning & documenting my journey
Did I connect these right OG's? Teach me 👇
#BTC #TechnicalAnalysiss #LearningInPublic #elliottwaves #wyckoff
$BTC $ETH $BNB
2
135

·
--
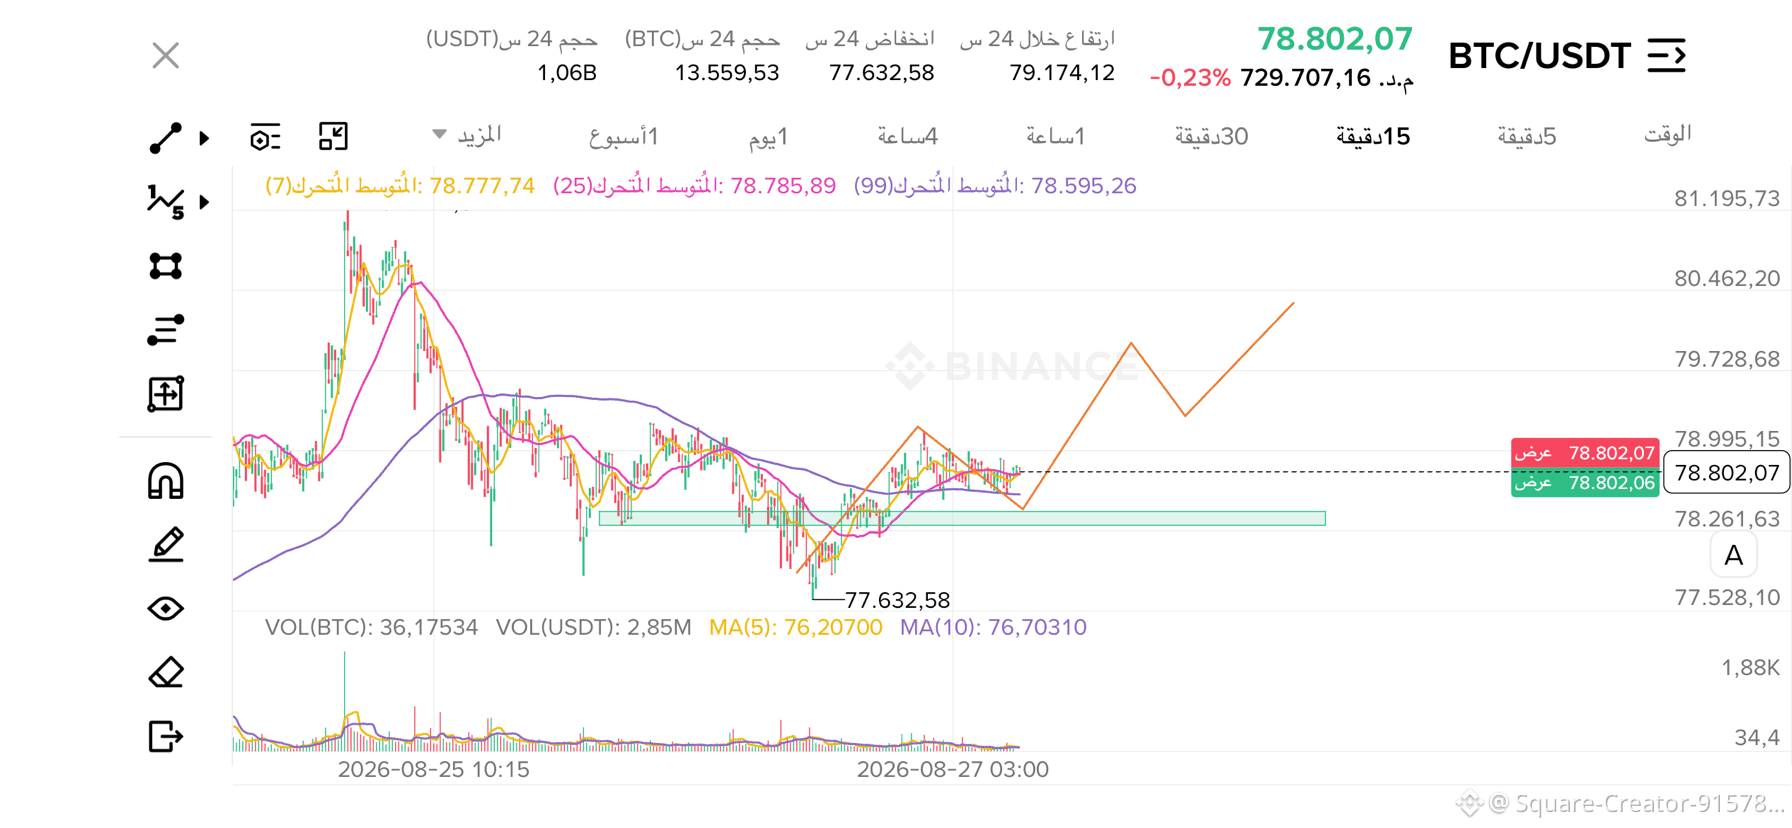
We will soon witness a historic rise in Bitcoin $BTC
#elliottwaves
We will soon witness a historic rise in Bitcoin $BTC
#elliottwaves
#elliottwaves
108
BTC will most likely take local lows here...
Entered great short, based on Bearish Cvd Divergence on Aggr and bearish EW count
Not everyday you can count a solid triangle on BTC...
What do you think, will BTC take local lows?
#btc #elliottwaves
BTC will most likely take local lows here...
Entered great short, based on Bearish Cvd Divergence on Aggr and bearish EW count
Not everyday you can count a solid triangle on BTC...
What do you think, will BTC take local lows?
#btc #elliottwaves
Entered great short, based on Bearish Cvd Divergence on Aggr and bearish EW count
Not everyday you can count a solid triangle on BTC...
What do you think, will BTC take local lows?
#btc #elliottwaves


9
474
Log in to explore more content
Join global crypto users on Binance Square
⚡️ Get latest and useful information about crypto.
💬 Trusted by the world’s largest crypto exchange.
👍 Discover real insights from verified creators.
Email / Phone number
Trending Topics
1
#BinanceReopensWithdrawalsForMoreAssets
16,850 views
520 Discussing
2
#AppleReportsMixedResults
11,478 views
400 Discussing
3
#BinanceHourlyDepositsExceedWithdrawals
1,233 views
96 Discussing
4
#PalantirSlides3PercentOn$2BRevenue
0 views
1 Discussing
5
#USMidtermElections
703,083 views
3,813 Discussing
6
#USOctoberNFP-AreRateCutsStillPossible
102,777 views
887 Discussing
7
#Verify1to1BinanceReserves
92,474 views
652 Discussing
8
#SBIFirstHalfCryptoRevenueFalls30.1%
362 views
14 Discussing
9
#NEARVoteApprovesCutInMaxAnnualIssuanceTo1.6%
2,465 views
30 Discussing
10
#BinanceRestores28FiatWithdrawals
241,471 views
1,323 Discussing