

#candlestickreading
candlestickreading
1,464 views
3 Discussing
Hot
Latest

·
--
📌 Day 11: Candlestick
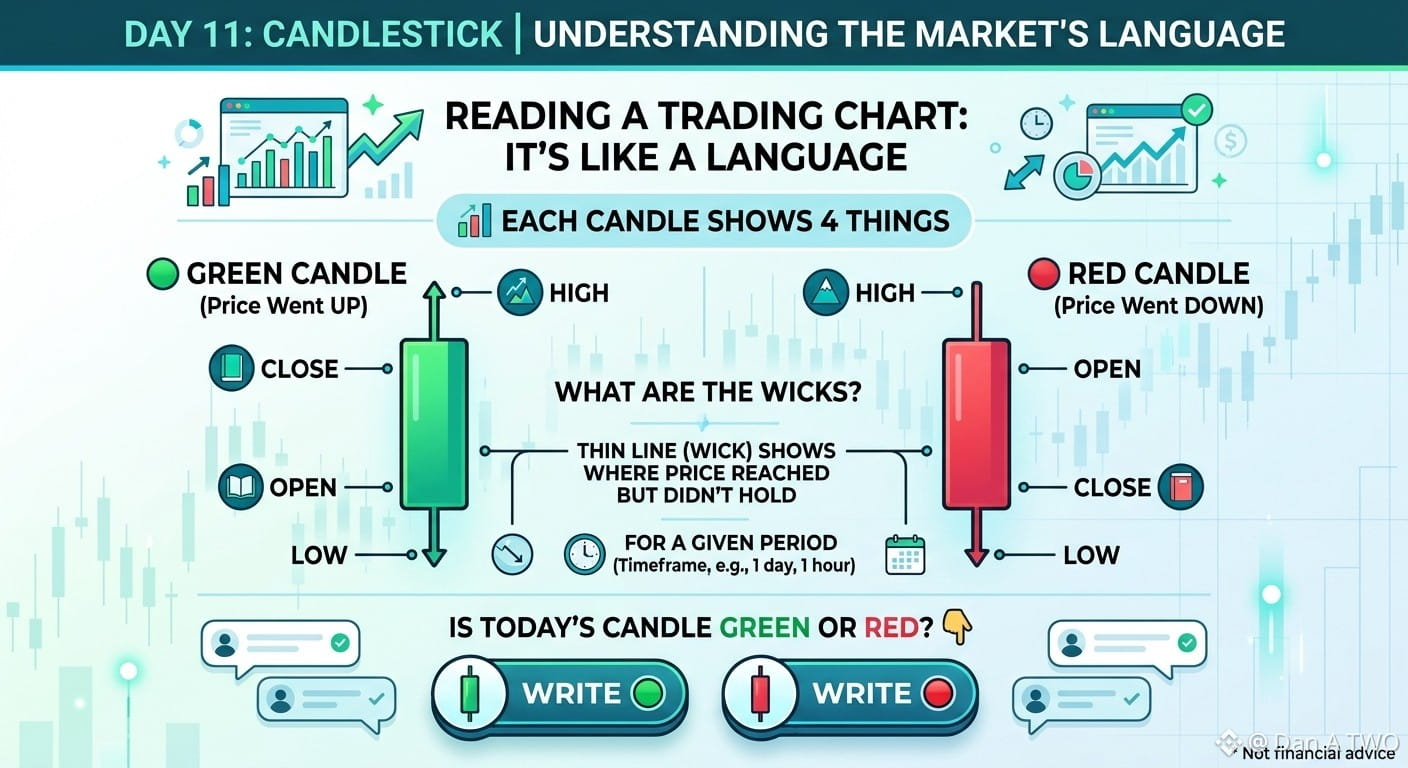
A trading chart is like a language. If you can read it, you understand what the market is saying. 📊
Each candle shows 4 things: the open, the close, the high, and the low for a given period.
🟢 Green: the price went up
🔴 Red: the price went down
The thin line (wick) shows where the price reached but didn't hold.
Is today's candle green or red? Write 🟢 or 🔴 👇
#CandlestickReading #Trading #DanATWO $IDOL $INIT $WEN #BinanceAcademy
Not financial advice.
356
Log in to explore more content
Join global crypto users on Binance Square
⚡️ Get latest and useful information about crypto.
💬 Trusted by the world’s largest crypto exchange.
👍 Discover real insights from verified creators.
Email / Phone number
Trending Topics
1
#FedWatch
16.3M views
39,233 Discussing
2
#EarningsSeason
6.4M views
31,949 Discussing
3
#USMidtermElections
27,451 views
544 Discussing
4
#BitcoinDropsBelow$80K
19,197 views
86 Discussing
5
#比特币跌破8万美元
170,060 views
99 Discussing
6
#BoEOpensConsultationOnTokenizedCollateralForClearing
266 views
18 Discussing
7
#BrazilCryptoExchangesMustApplyForLicensesByFriday
20,483 views
451 Discussing
8
#ICEPartnersWithTradeXYZToBringPerpetualContractsToUS
662 views
14 Discussing
9
#SolidusLabsReportsSuspected$170MSpoofingOnHyperliquidOilContracts
1,434 views
24 Discussing
10
#StanDruckenmillerBecomesInvestorInTradeXYZ
16,320 views
411 Discussing