
#render
render
3.3M views
10,692 Discussing
Hot
Latest

·
--
Bullish
Verified
RENDER Is Selling the Resource AI Can’t Get Enough Of
AI has a growing problem.
It needs enormous amounts of GPU power.
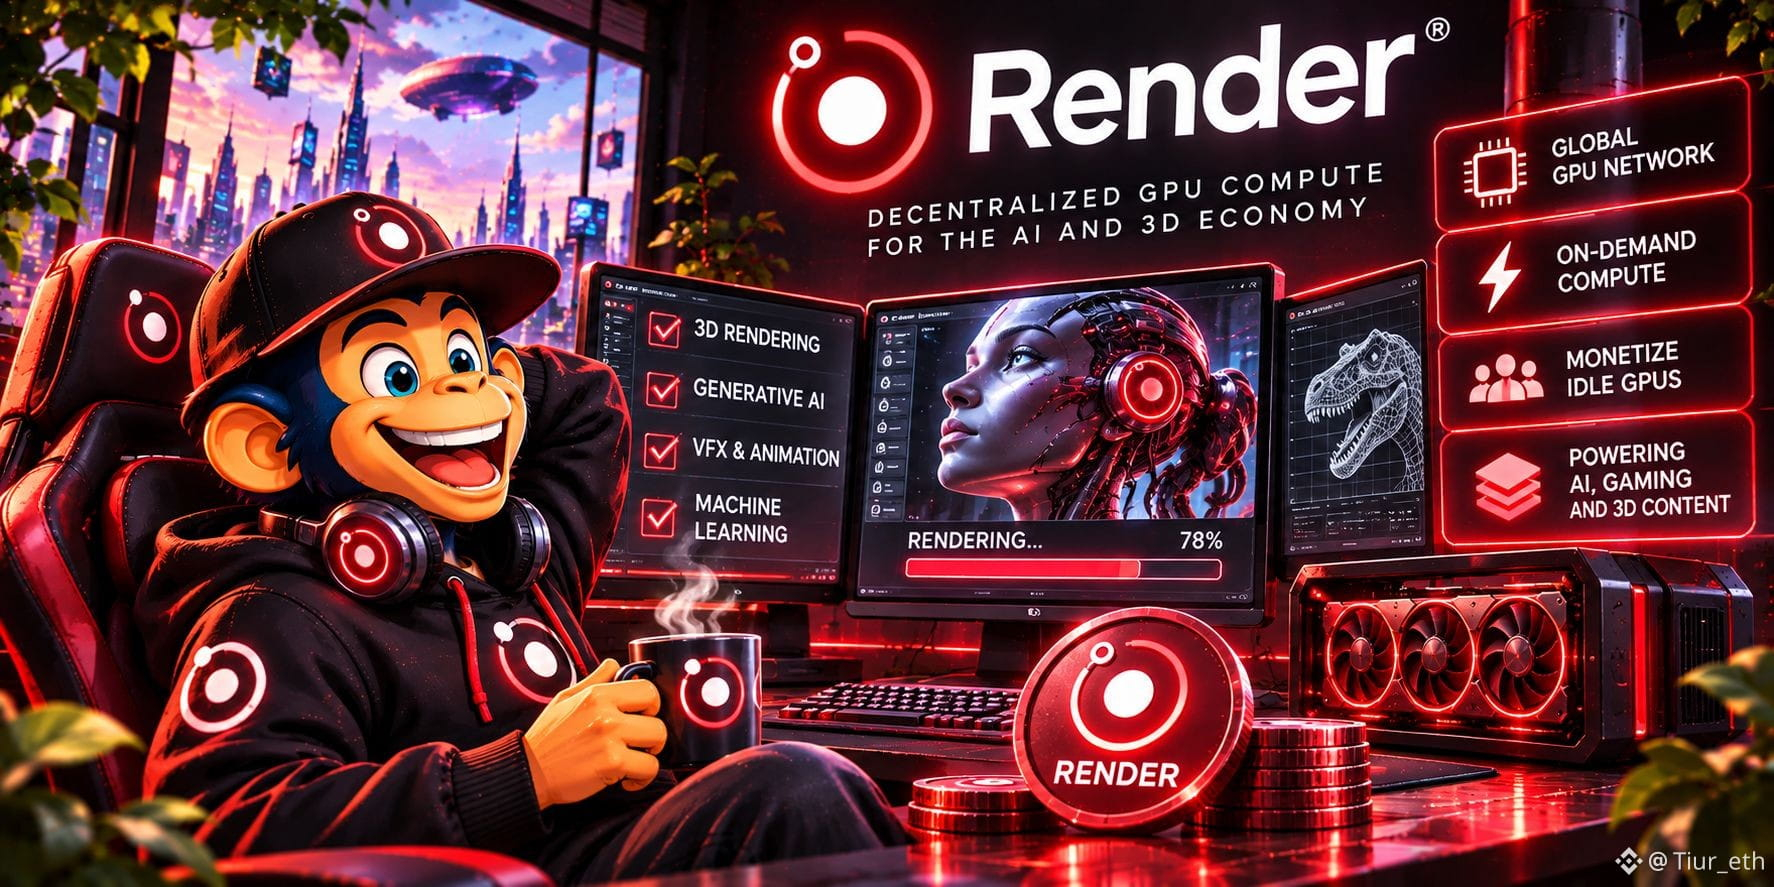
Render turns unused GPUs around the world into a decentralized compute network for 3D rendering, generative #AI and machine learning.
Creators get on-demand computing power.
GPU owners monetize idle hardware.
$RENDER connects both sides of that market.
And the timing is interesting.
AI, gaming, spatial computing and digital content are all becoming more GPU-intensive.
Instead of betting on another AI app, #RENDER sits closer to the infrastructure all of them need.
If demand for compute keeps growing, GPU power could become one of the most valuable resources in the digital economy.
RENDER Is Selling the Resource AI Can’t Get Enough Of
AI has a growing problem.
It needs enormous amounts of GPU power.
Render turns unused GPUs around the world into a decentralized compute network for 3D rendering, generative #AI and machine learning.
Creators get on-demand computing power.
GPU owners monetize idle hardware.
$RENDER connects both sides of that market.
And the timing is interesting.
AI, gaming, spatial computing and digital content are all becoming more GPU-intensive.
Instead of betting on another AI app, #RENDER sits closer to the infrastructure all of them need.
If demand for compute keeps growing, GPU power could become one of the most valuable resources in the digital economy.
AI has a growing problem.
It needs enormous amounts of GPU power.
Render turns unused GPUs around the world into a decentralized compute network for 3D rendering, generative #AI and machine learning.
Creators get on-demand computing power.
GPU owners monetize idle hardware.
$RENDER connects both sides of that market.
And the timing is interesting.
AI, gaming, spatial computing and digital content are all becoming more GPU-intensive.
Instead of betting on another AI app, #RENDER sits closer to the infrastructure all of them need.
If demand for compute keeps growing, GPU power could become one of the most valuable resources in the digital economy.
7
1.1k

·
--
Bullish
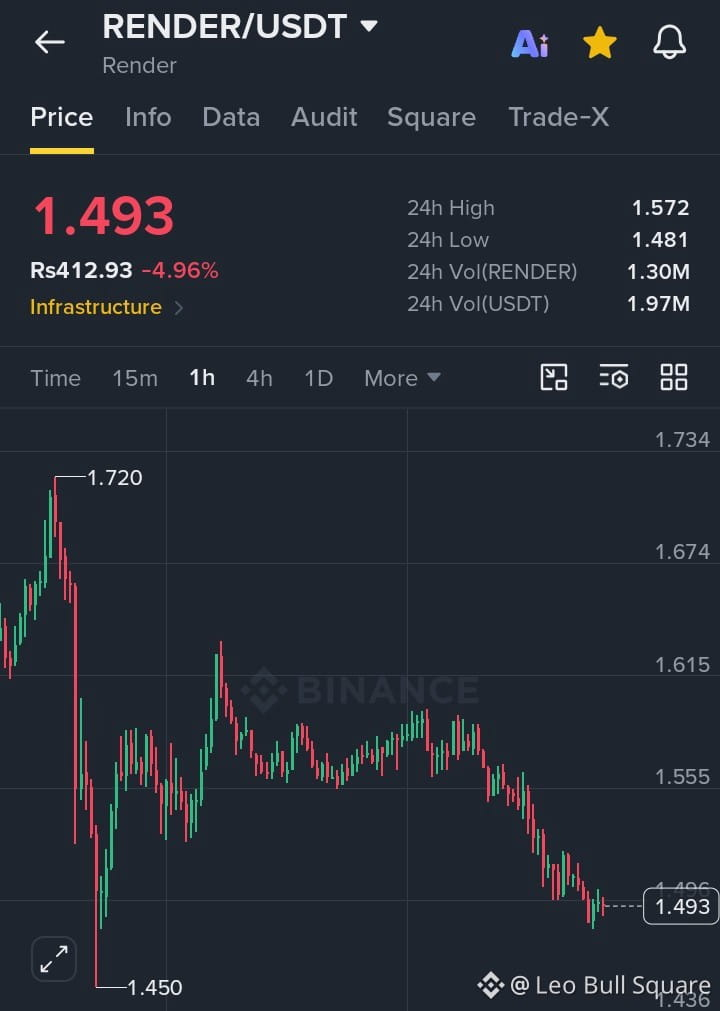
🚨 $RENDER /USDT – BEARISH BOS! LIQUIDITY SWEEP OR REVERSAL AHEAD? 📉 $RENDER is trading near $1.493 (-4.96%) on the 1H chart, showing persistent bearish pressure after breaking below the $1.555 support zone. The formation of lower highs and lower lows confirms a bearish market structure, while price approaches the critical $1.481 liquidity zone. A potential sell-side liquidity sweep could trigger a short-term rebound, but bullish confirmation is essential. LONG Setup (Confirmation Required): Entry $1.490–$1.505 | TP1: $1.525 | TP2: $1.555 | TP3: $1.580 | SL: $1.465. A bullish CHoCH followed by a confirmed BOS above $1.525 would strengthen the reversal scenario, while a breakdown below $1.481 could expose $1.450 support. Watch for a liquidity sweep, strong buying volume, and a confirmed bullish reclaim before entry. Follow for more SMC-based crypto trade setups! 📊 #RENDER #CryptoTrading #BinanceSquare
#render
{spot}(RENDERUSDT)
🚨 $RENDER /USDT – BEARISH BOS! LIQUIDITY SWEEP OR REVERSAL AHEAD? 📉 $RENDER is trading near $1.493 (-4.96%) on the 1H chart, showing persistent bearish pressure after breaking below the $1.555 support zone. The formation of lower highs and lower lows confirms a bearish market structure, while price approaches the critical $1.481 liquidity zone. A potential sell-side liquidity sweep could trigger a short-term rebound, but bullish confirmation is essential. LONG Setup (Confirmation Required): Entry $1.490–$1.505 | TP1: $1.525 | TP2: $1.555 | TP3: $1.580 | SL: $1.465. A bullish CHoCH followed by a confirmed BOS above $1.525 would strengthen the reversal scenario, while a breakdown below $1.481 could expose $1.450 support. Watch for a liquidity sweep, strong buying volume, and a confirmed bullish reclaim before entry. Follow for more SMC-based crypto trade setups! 📊 #RENDER #CryptoTrading #BinanceSquare
#render
#render
1
72

·
--
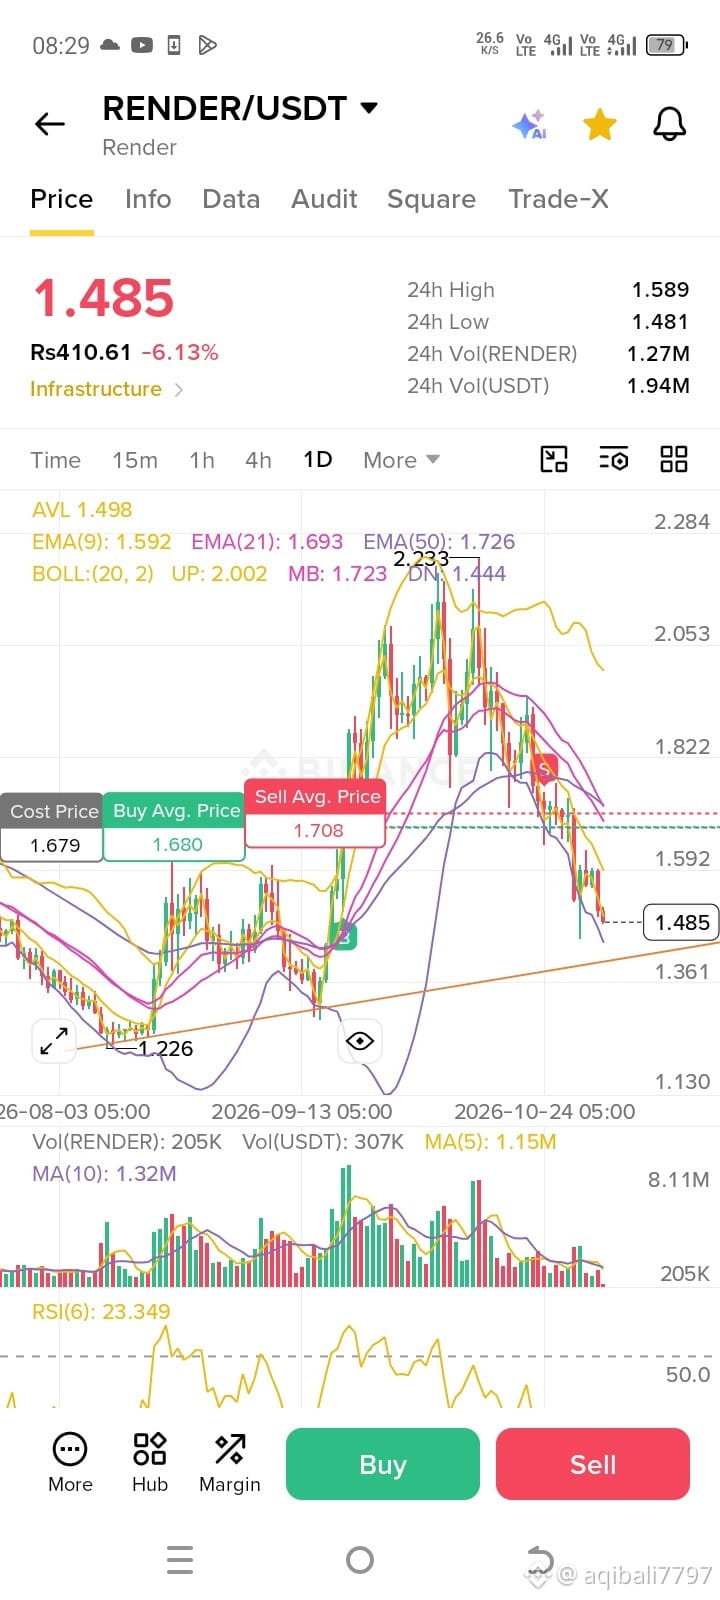
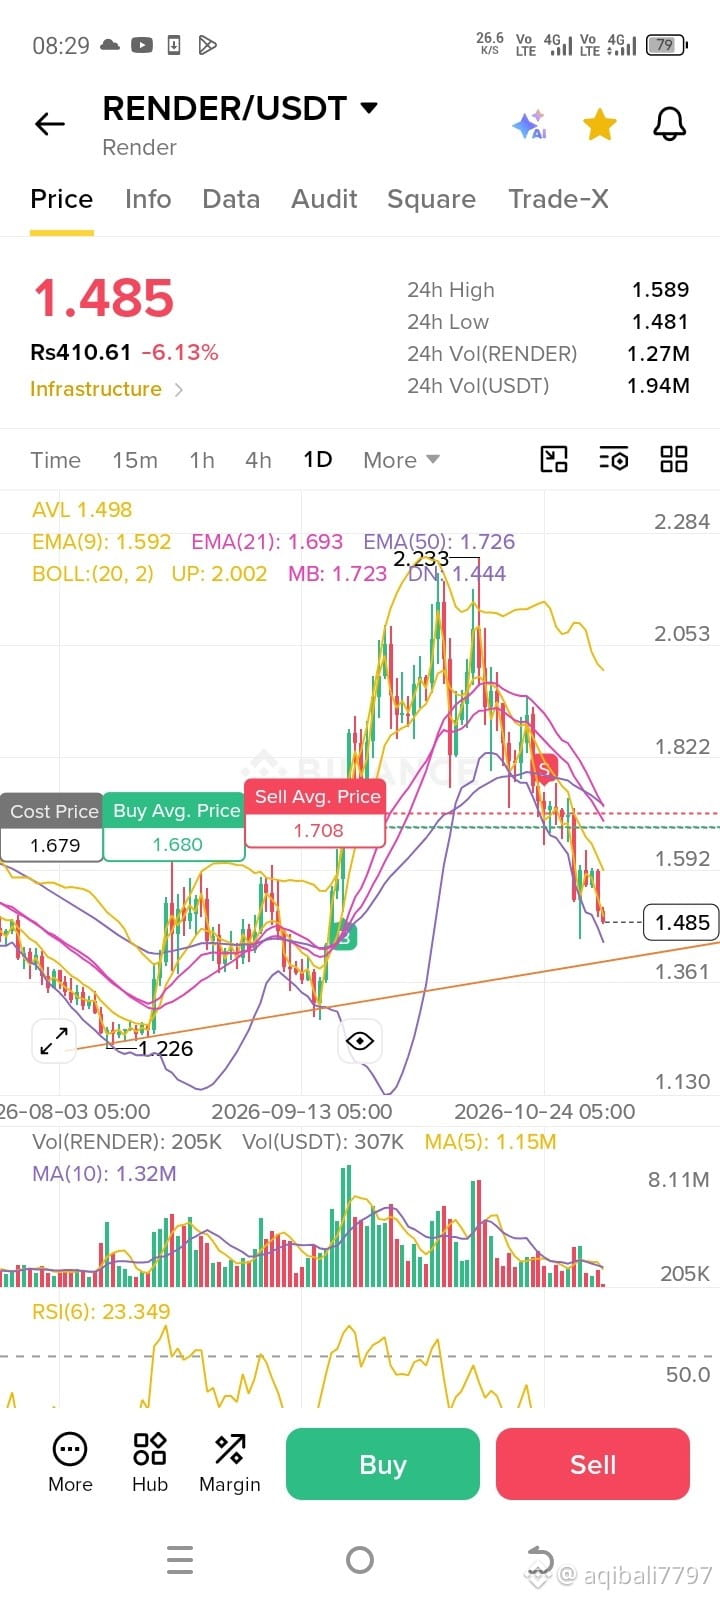
$RENDER is showing up on the trending board again, and it's a heavier red day than I expected — down about 5.7% near $1.49 on roughly $26M in volume, sitting right near today's low around $1.48. $BTC is softer too, down around 2.3% near $76,762, but $RENDER is clearly giving back more than the majors. I'm watching whether it holds above $1.48 — lose that and the trending crowd probably moves on fast; hold it and a bounce attempt wouldn't surprise me. #Render
$RENDER is showing up on the trending board again, and it's a heavier red day than I expected — down about 5.7% near $1.49 on roughly $26M in volume, sitting right near today's low around $1.48. $BTC is softer too, down around 2.3% near $76,762, but $RENDER is clearly giving back more than the majors. I'm watching whether it holds above $1.48 — lose that and the trending crowd probably moves on fast; hold it and a bounce attempt wouldn't surprise me. #Render


·
--
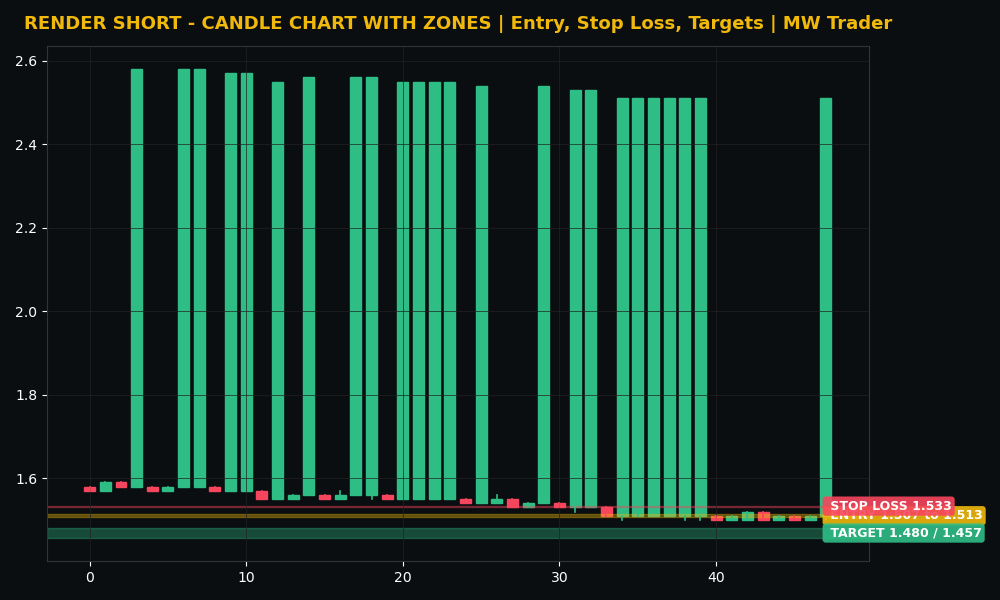
$RENDER #RENDER 📉
Direction: SHORT
Entry zone: 1.507 to 1.513
Stop loss: 1.533
Target 1: 1.480
Target 2: 1.457
Render is trading near 1.51 dollars, down 4.35 percent in 24 hours, inside a range of 1.50 to 1.59. My reading is that price is sitting exactly on its range low after a weak session, because the recent closes were flat at the floor, 1.51, then 1.50, then 1.51, then 1.51, which tells me sellers are holding the low and buyers have not shown a reason to step in yet. 📉 A short from the current zone, with a stop above 1.533, targets 1.480 first and then 1.457 if selling continues. A recovery above 1.533 kills the idea without debate.
Futures trading is risky. Trade small, use a stop loss, and do your own research. This is my reading, not a guaranteed signal.
Does Render fall to 1.480 first, or recover above 1.533? 🤔
Follow for more trades.
#Render #Crypto #FuturesTrading #TradingSignals
$RENDER #RENDER 📉
Direction: SHORT
Entry zone: 1.507 to 1.513
Stop loss: 1.533
Target 1: 1.480
Target 2: 1.457
Render is trading near 1.51 dollars, down 4.35 percent in 24 hours, inside a range of 1.50 to 1.59. My reading is that price is sitting exactly on its range low after a weak session, because the recent closes were flat at the floor, 1.51, then 1.50, then 1.51, then 1.51, which tells me sellers are holding the low and buyers have not shown a reason to step in yet. 📉 A short from the current zone, with a stop above 1.533, targets 1.480 first and then 1.457 if selling continues. A recovery above 1.533 kills the idea without debate.
Futures trading is risky. Trade small, use a stop loss, and do your own research. This is my reading, not a guaranteed signal.
Does Render fall to 1.480 first, or recover above 1.533? 🤔
Follow for more trades.
#Render #Crypto #FuturesTrading #TradingSignals
Direction: SHORT
Entry zone: 1.507 to 1.513
Stop loss: 1.533
Target 1: 1.480
Target 2: 1.457
Render is trading near 1.51 dollars, down 4.35 percent in 24 hours, inside a range of 1.50 to 1.59. My reading is that price is sitting exactly on its range low after a weak session, because the recent closes were flat at the floor, 1.51, then 1.50, then 1.51, then 1.51, which tells me sellers are holding the low and buyers have not shown a reason to step in yet. 📉 A short from the current zone, with a stop above 1.533, targets 1.480 first and then 1.457 if selling continues. A recovery above 1.533 kills the idea without debate.
Futures trading is risky. Trade small, use a stop loss, and do your own research. This is my reading, not a guaranteed signal.
Does Render fall to 1.480 first, or recover above 1.533? 🤔
Follow for more trades.
#Render #Crypto #FuturesTrading #TradingSignals
9

·
--
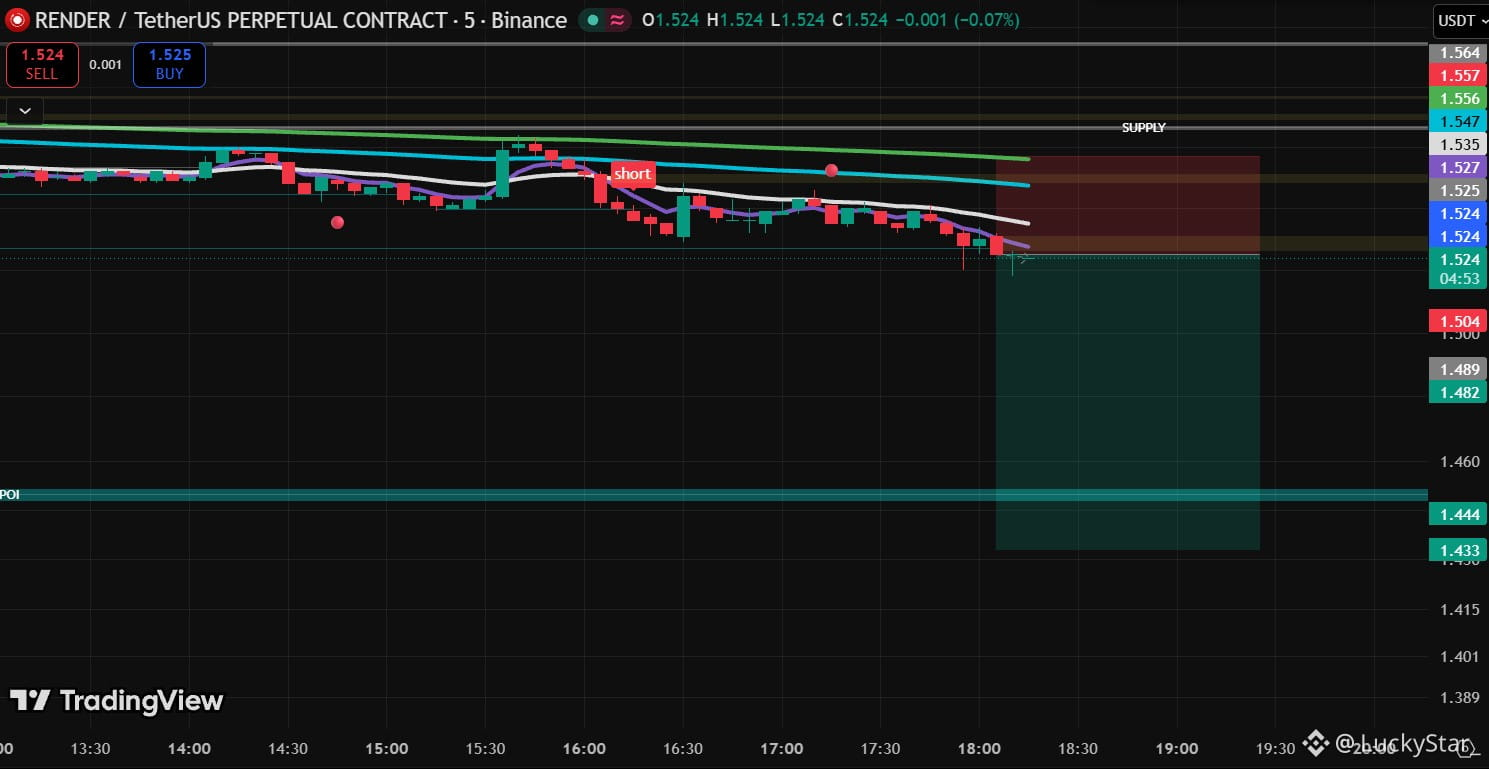
$RENDER
{future}(RENDERUSDT)
decline follows the break of the support level.
STAY TUNED!
Monitor risks closely and take profits in stages.
#render #RenderNetwork #ShortMaestro
$RENDER
decline follows the break of the support level.
STAY TUNED!
Monitor risks closely and take profits in stages.
#render #RenderNetwork #ShortMaestro
decline follows the break of the support level.
STAY TUNED!
Monitor risks closely and take profits in stages.
#render #RenderNetwork #ShortMaestro
23

·
--
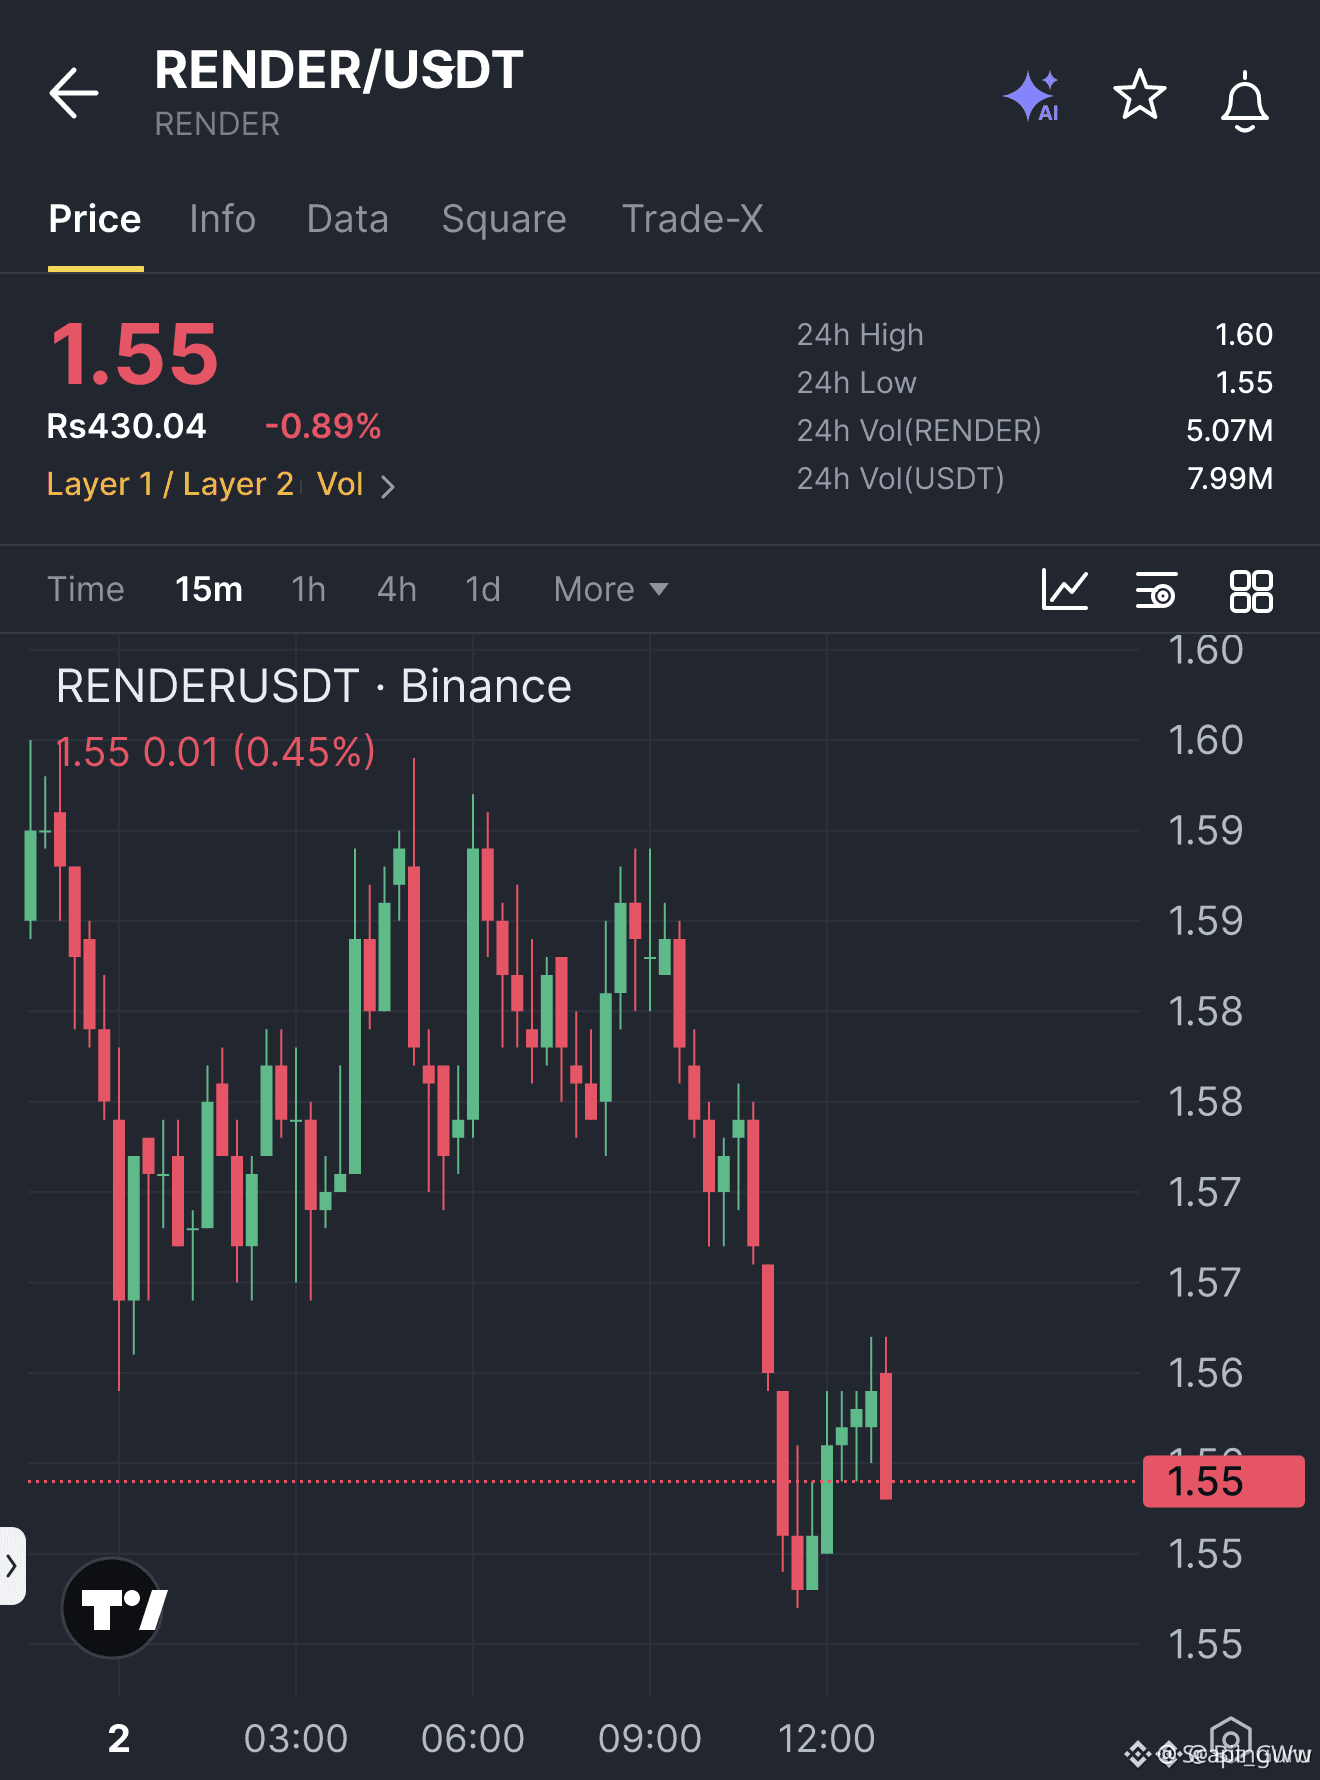
🚨 $RENDER SHORT ON THE EDGE OF LIQUIDITY SWEEP! 💥
Entry: 1.554 ⚡
Target: 1.540 🚀
Target: 1.531 🎯
Target: 1.518 💥
Stop Loss: 1.563 ⚠️
Sellers finally pierced the previous candle’s low after a stubborn climb, flipping the order flow into a clean pull‑back zone. 📊 The break confirms smart‑money liquidity sweep, and the short entry sits right at 1.554.
Volume spikes and a tightening range signal that bears are loading up, ready to drive price toward the next demand block. 🦈 Keep an eye on the 1.540‑1.518 corridor for staged exits. 💬 What’s your next move on this short wave? 👇
⚠️ Not financial advice. Always manage your risk. 🛡️
🏷️ #RENDER #ShortSetup #LiquiditySweep #Crypto
🦈 🚀
🚨 $RENDER SHORT ON THE EDGE OF LIQUIDITY SWEEP! 💥
Entry: 1.554 ⚡
Target: 1.540 🚀
Target: 1.531 🎯
Target: 1.518 💥
Stop Loss: 1.563 ⚠️
Sellers finally pierced the previous candle’s low after a stubborn climb, flipping the order flow into a clean pull‑back zone. 📊 The break confirms smart‑money liquidity sweep, and the short entry sits right at 1.554.
Volume spikes and a tightening range signal that bears are loading up, ready to drive price toward the next demand block. 🦈 Keep an eye on the 1.540‑1.518 corridor for staged exits. 💬 What’s your next move on this short wave? 👇
⚠️ Not financial advice. Always manage your risk. 🛡️
🏷️ #RENDER #ShortSetup #LiquiditySweep #Crypto
🦈 🚀
Entry: 1.554 ⚡
Target: 1.540 🚀
Target: 1.531 🎯
Target: 1.518 💥
Stop Loss: 1.563 ⚠️
Sellers finally pierced the previous candle’s low after a stubborn climb, flipping the order flow into a clean pull‑back zone. 📊 The break confirms smart‑money liquidity sweep, and the short entry sits right at 1.554.
Volume spikes and a tightening range signal that bears are loading up, ready to drive price toward the next demand block. 🦈 Keep an eye on the 1.540‑1.518 corridor for staged exits. 💬 What’s your next move on this short wave? 👇
⚠️ Not financial advice. Always manage your risk. 🛡️
🏷️ #RENDER #ShortSetup #LiquiditySweep #Crypto
🦈 🚀
10

·
--
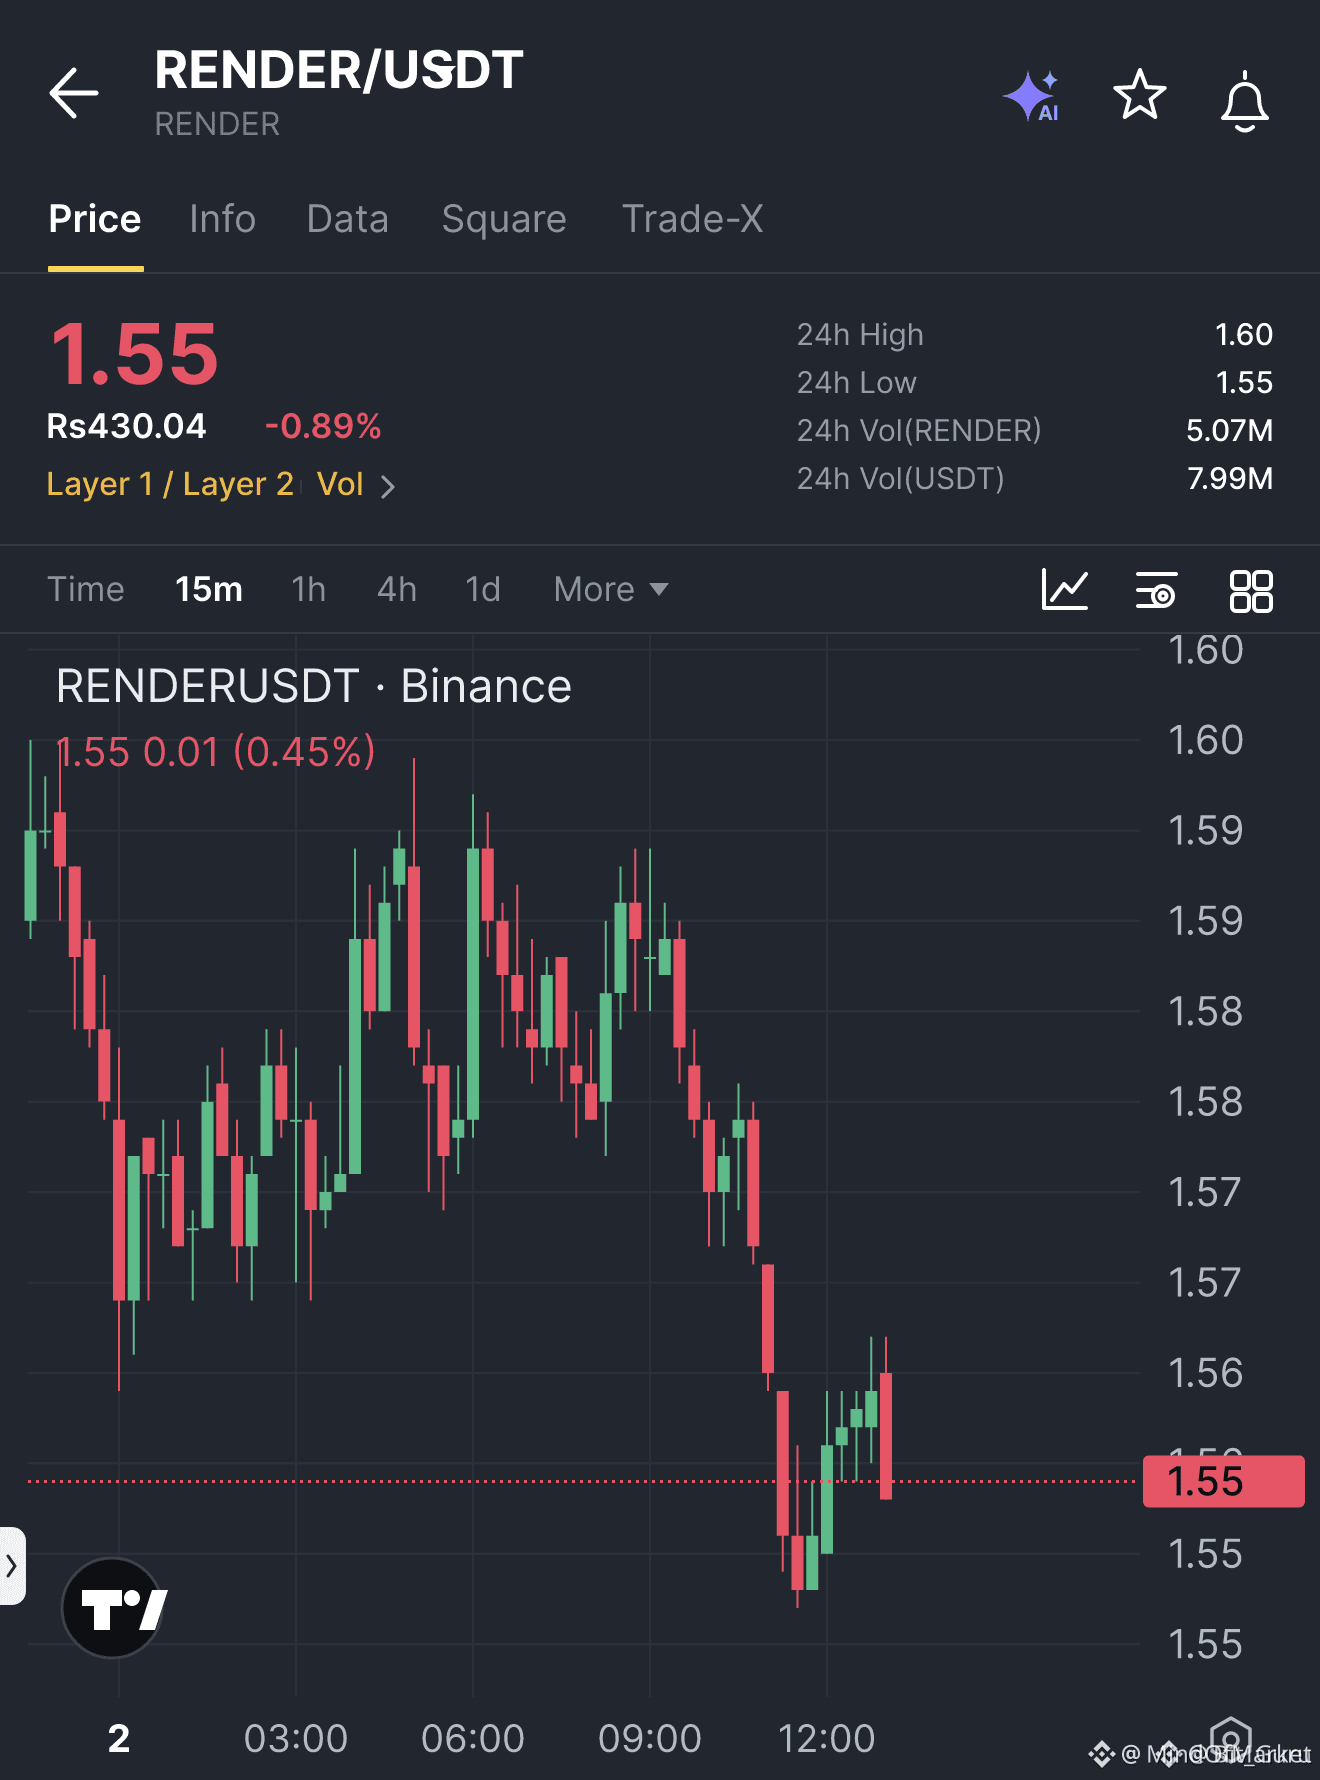
🚨 $RENDER SHORT BREACH TRIGGERS LIQUIDITY SWEEP! 💥
Entry: 1.554 ⚡
Target: 1.540 / 1.531 / 1.518 🚀
Stop Loss: 1.563 ⚠️
📊 Sellers ripped the prior candle low after a steady climb, flipping the order block into a clean pull‑back trigger. 🌊 The price now sits above the broken low, exposing residual buying liquidity that smart money is hunting down. 📌 Each profit tier aligns with historic demand zones, offering a structured R‑R ladder for disciplined scalpers. 💡 The setup is live—execution now can capture the next liquidity vacuum.
💬 Are you ready to ride this short cascade or waiting for a deeper pullback? 👇
⚠️ Not financial advice. Always manage your risk. 🛡️
🏷️ #RENDER #ShortSetup #LiquiditySweep #Crypto
🦈 🔥
🚨 $RENDER SHORT BREACH TRIGGERS LIQUIDITY SWEEP! 💥
Entry: 1.554 ⚡
Target: 1.540 / 1.531 / 1.518 🚀
Stop Loss: 1.563 ⚠️
📊 Sellers ripped the prior candle low after a steady climb, flipping the order block into a clean pull‑back trigger. 🌊 The price now sits above the broken low, exposing residual buying liquidity that smart money is hunting down. 📌 Each profit tier aligns with historic demand zones, offering a structured R‑R ladder for disciplined scalpers. 💡 The setup is live—execution now can capture the next liquidity vacuum.
💬 Are you ready to ride this short cascade or waiting for a deeper pullback? 👇
⚠️ Not financial advice. Always manage your risk. 🛡️
🏷️ #RENDER #ShortSetup #LiquiditySweep #Crypto
🦈 🔥
Entry: 1.554 ⚡
Target: 1.540 / 1.531 / 1.518 🚀
Stop Loss: 1.563 ⚠️
📊 Sellers ripped the prior candle low after a steady climb, flipping the order block into a clean pull‑back trigger. 🌊 The price now sits above the broken low, exposing residual buying liquidity that smart money is hunting down. 📌 Each profit tier aligns with historic demand zones, offering a structured R‑R ladder for disciplined scalpers. 💡 The setup is live—execution now can capture the next liquidity vacuum.
💬 Are you ready to ride this short cascade or waiting for a deeper pullback? 👇
⚠️ Not financial advice. Always manage your risk. 🛡️
🏷️ #RENDER #ShortSetup #LiquiditySweep #Crypto
🦈 🔥
17
·
--
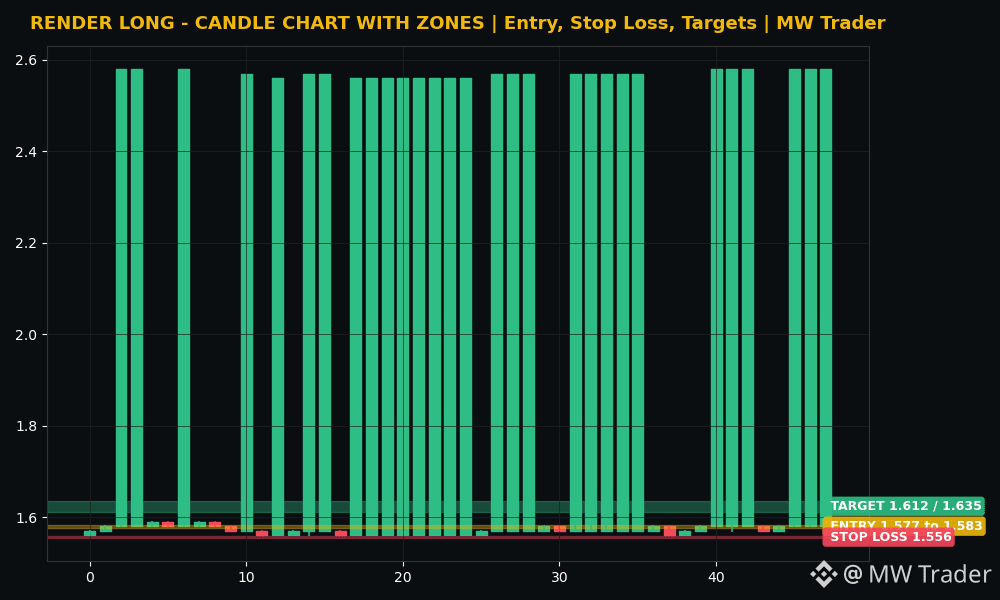
$RENDER #RENDER 🚀
Direction: LONG 🚀
Entry zone: 1.577 to 1.583
Stop loss: 1.556
Target 1: 1.612
Target 2: 1.635
Render is trading near 1.58 dollars, up 1.23 percent in 24 hours, inside a very tight range of 1.56 to 1.59. My reading is that a tight range like this usually ends with a sharp move, and the recent closes show no selling pressure at all. 📈 The last four closes were all 1.58, flat and firm, which is compression, not weakness. A long from the current zone, with a stop below 1.556, targets 1.612 first and then 1.635 if the range high breaks. A fall back under 1.556 kills the idea without debate.
Futures trading is risky. Trade small, use a stop loss, and do your own research. This is my reading, not a guaranteed signal.
Does Render break 1.59 resistance first, or fall back to 1.556? 🤔
Follow for more trades.
#Render #Crypto #FuturesTrading #TradingSignals
$RENDER #RENDER 🚀
Direction: LONG 🚀
Entry zone: 1.577 to 1.583
Stop loss: 1.556
Target 1: 1.612
Target 2: 1.635
Render is trading near 1.58 dollars, up 1.23 percent in 24 hours, inside a very tight range of 1.56 to 1.59. My reading is that a tight range like this usually ends with a sharp move, and the recent closes show no selling pressure at all. 📈 The last four closes were all 1.58, flat and firm, which is compression, not weakness. A long from the current zone, with a stop below 1.556, targets 1.612 first and then 1.635 if the range high breaks. A fall back under 1.556 kills the idea without debate.
Futures trading is risky. Trade small, use a stop loss, and do your own research. This is my reading, not a guaranteed signal.
Does Render break 1.59 resistance first, or fall back to 1.556? 🤔
Follow for more trades.
#Render #Crypto #FuturesTrading #TradingSignals
Direction: LONG 🚀
Entry zone: 1.577 to 1.583
Stop loss: 1.556
Target 1: 1.612
Target 2: 1.635
Render is trading near 1.58 dollars, up 1.23 percent in 24 hours, inside a very tight range of 1.56 to 1.59. My reading is that a tight range like this usually ends with a sharp move, and the recent closes show no selling pressure at all. 📈 The last four closes were all 1.58, flat and firm, which is compression, not weakness. A long from the current zone, with a stop below 1.556, targets 1.612 first and then 1.635 if the range high breaks. A fall back under 1.556 kills the idea without debate.
Futures trading is risky. Trade small, use a stop loss, and do your own research. This is my reading, not a guaranteed signal.
Does Render break 1.59 resistance first, or fall back to 1.556? 🤔
Follow for more trades.
#Render #Crypto #FuturesTrading #TradingSignals
10

·
--
$RENDER keeps stalling right under $1.5900
Only 0.3 percent away from that 24 hour high
An hourly close above opens up room fast
A rejection sends us back toward $1.5550 support
Open $RENDER and set an alert at that level
Break or reject? 👀
#RENDER #PriceAction
$RENDER keeps stalling right under $1.5900
Only 0.3 percent away from that 24 hour high
An hourly close above opens up room fast
A rejection sends us back toward $1.5550 support
Open $RENDER and set an alert at that level
Break or reject? 👀
#RENDER #PriceAction
Only 0.3 percent away from that 24 hour high
An hourly close above opens up room fast
A rejection sends us back toward $1.5550 support
Open $RENDER and set an alert at that level
Break or reject? 👀
#RENDER #PriceAction
9

·
--
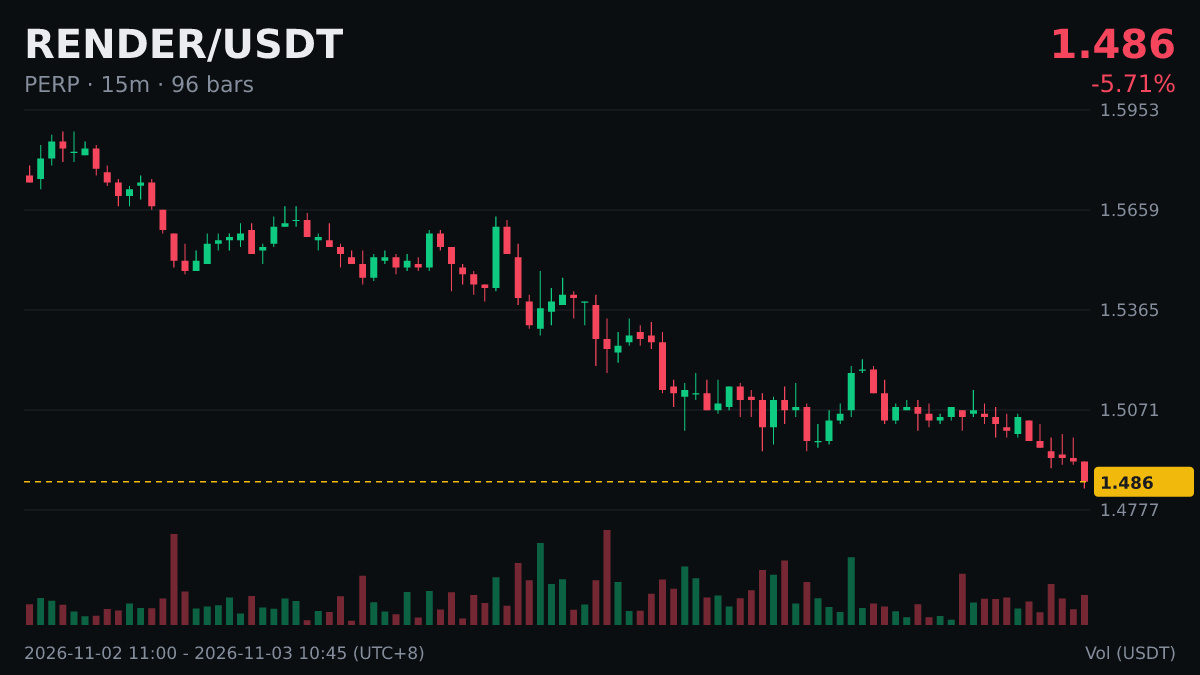
Just noting that $RENDER hit a new 24-hour low at 1.487. The previous low was 1.495.
Whenever it hits a new low, people on the feed start calling the bottom, but in a weak market, new lows are often followed by even lower lows. I usually wait for the price to climb back above the previous low before considering a move—I don’t try to guess the bottom.
Feel free to share your thoughts in the comments.
#RENDER
Just noting that $RENDER hit a new 24-hour low at 1.487. The previous low was 1.495.
Whenever it hits a new low, people on the feed start calling the bottom, but in a weak market, new lows are often followed by even lower lows. I usually wait for the price to climb back above the previous low before considering a move—I don’t try to guess the bottom.
Feel free to share your thoughts in the comments.
#RENDER
Whenever it hits a new low, people on the feed start calling the bottom, but in a weak market, new lows are often followed by even lower lows. I usually wait for the price to climb back above the previous low before considering a move—I don’t try to guess the bottom.
Feel free to share your thoughts in the comments.
#RENDER
6

·
--
Bearish
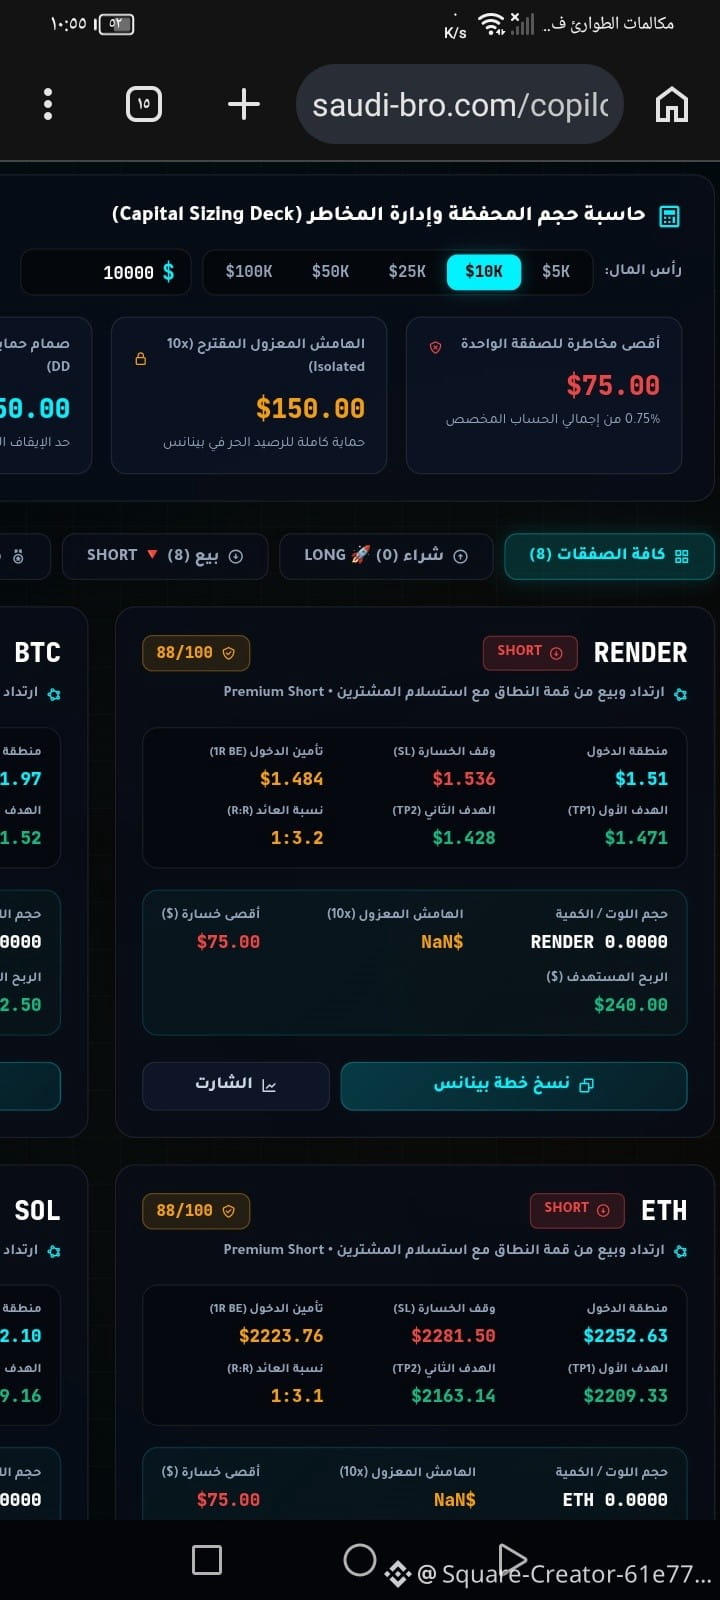
$RENDER Short
The entry price and all details are shown in the picture.
For more information, join my private chat room.
#render #BinanceSquare
{future}(RENDERUSDT)
$RENDER Short
The entry price and all details are shown in the picture.
For more information, join my private chat room.
#render #BinanceSquare
The entry price and all details are shown in the picture.
For more information, join my private chat room.
#render #BinanceSquare
1
642

·
--
🤖 AI AND COMPUTE TOKENS IN FOCUS! $RENDER , $AKT , and $TAO offer different approaches to decentralized computing and AI-related networks. This sector can attract strong attention, but valuations can move quickly. Research actual demand, token supply, and liquidity before buying.
#Render #AkashNetwork #Bittensor #AIcrypto #CryptoTrends
🤖 AI AND COMPUTE TOKENS IN FOCUS! $RENDER , $AKT , and $TAO offer different approaches to decentralized computing and AI-related networks. This sector can attract strong attention, but valuations can move quickly. Research actual demand, token supply, and liquidity before buying.
#Render #AkashNetwork #Bittensor #AIcrypto #CryptoTrends
#Render #AkashNetwork #Bittensor #AIcrypto #CryptoTrends
1
23

·
--
🚨 $RENDER: MAKE-OR-BREAK PRICE ZONE — ARE WHALES ACCUMULATING OR DUMPING? 💥
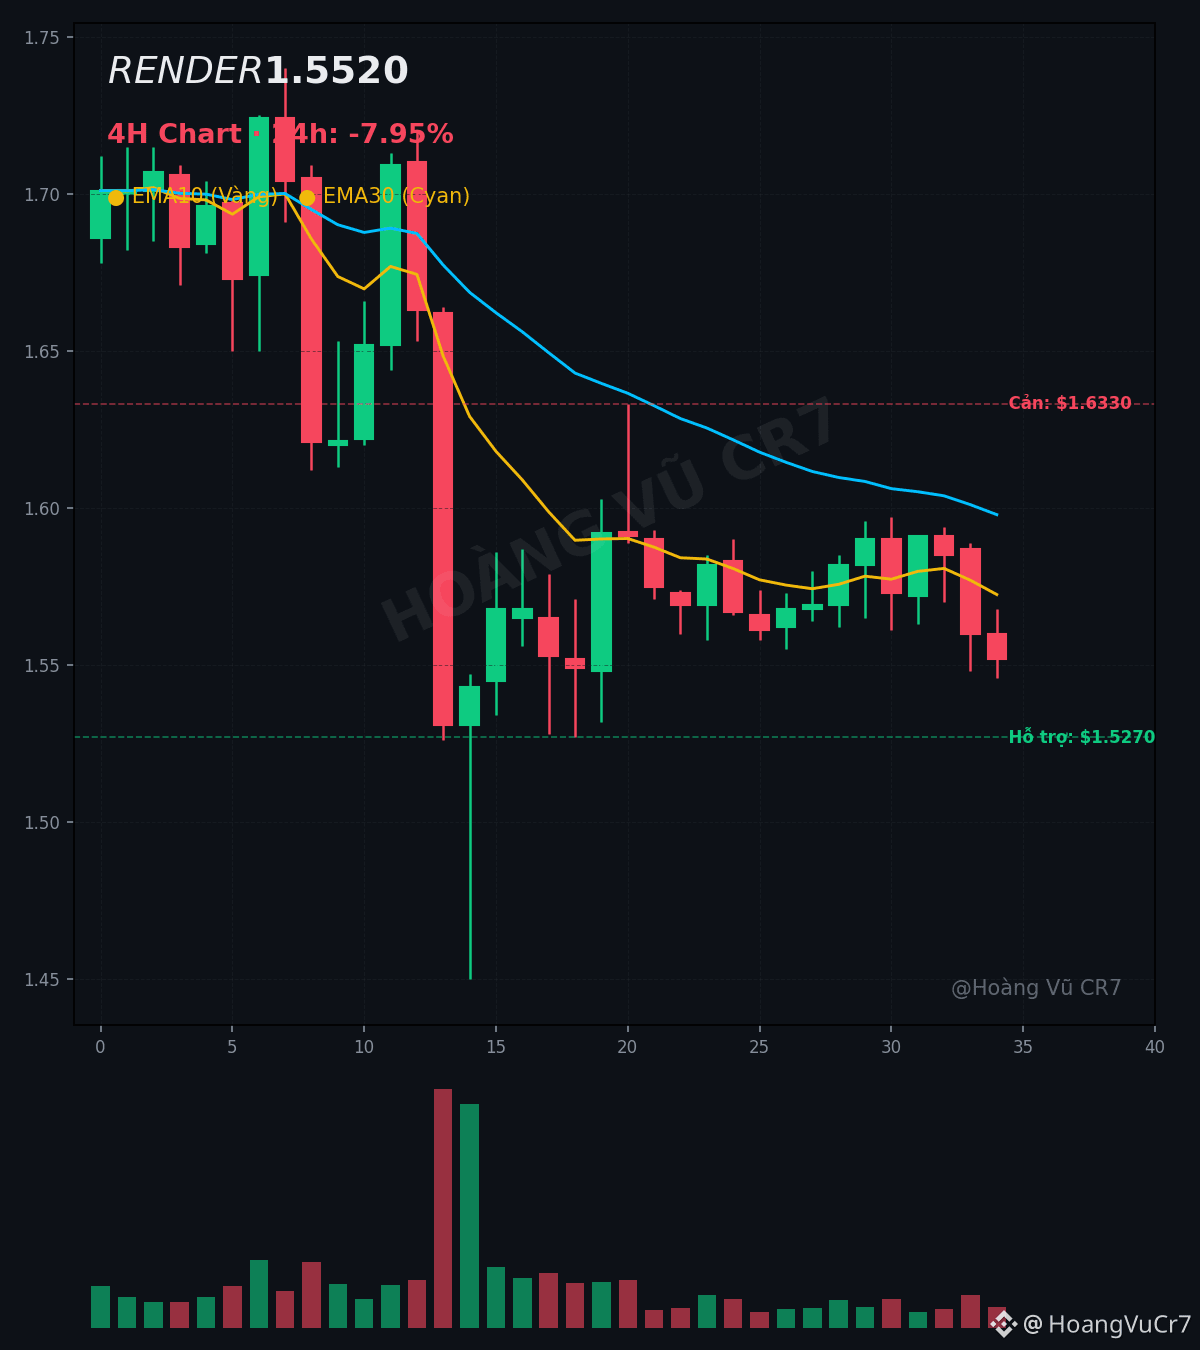
$RENDER is trading around $1.5520, down -7.95% over the past 24 hours, with a clearly bearish H4 trend as candles remain below EMA10 and EMA30. The bears are in control, but selling pressure has eased near the solid support zone at $1.5270, while key resistance sits at $1.6330. Buyers and sellers are locked in a fierce battle here.
Practical trading strategy: Prioritize the Long scenario if the price holds firm at the $1.5270 support zone or decisively breaks through the $1.6330 resistance. Conversely, trigger the Short scenario if selling pressure completely breaks through the $1.5270 support level. Manage your capital carefully!
If you had 1000 USDT right now, would you buy $RENDER or wait?
#BinanceSquare #RENDER #Crypto
(Personal opinion, not investment advice — DYOR)
🚨 $RENDER : MAKE-OR-BREAK PRICE ZONE — ARE WHALES ACCUMULATING OR DUMPING? 💥
$RENDER is trading around $1.5520, down -7.95% over the past 24 hours, with a clearly bearish H4 trend as candles remain below EMA10 and EMA30. The bears are in control, but selling pressure has eased near the solid support zone at $1.5270, while key resistance sits at $1.6330. Buyers and sellers are locked in a fierce battle here.
Practical trading strategy: Prioritize the Long scenario if the price holds firm at the $1.5270 support zone or decisively breaks through the $1.6330 resistance. Conversely, trigger the Short scenario if selling pressure completely breaks through the $1.5270 support level. Manage your capital carefully!
If you had 1000 USDT right now, would you buy $RENDER or wait?
#BinanceSquare #RENDER #Crypto
(Personal opinion, not investment advice — DYOR)
$RENDER is trading around $1.5520, down -7.95% over the past 24 hours, with a clearly bearish H4 trend as candles remain below EMA10 and EMA30. The bears are in control, but selling pressure has eased near the solid support zone at $1.5270, while key resistance sits at $1.6330. Buyers and sellers are locked in a fierce battle here.
Practical trading strategy: Prioritize the Long scenario if the price holds firm at the $1.5270 support zone or decisively breaks through the $1.6330 resistance. Conversely, trigger the Short scenario if selling pressure completely breaks through the $1.5270 support level. Manage your capital carefully!
If you had 1000 USDT right now, would you buy $RENDER or wait?
#BinanceSquare #RENDER #Crypto
(Personal opinion, not investment advice — DYOR)
97

·
--
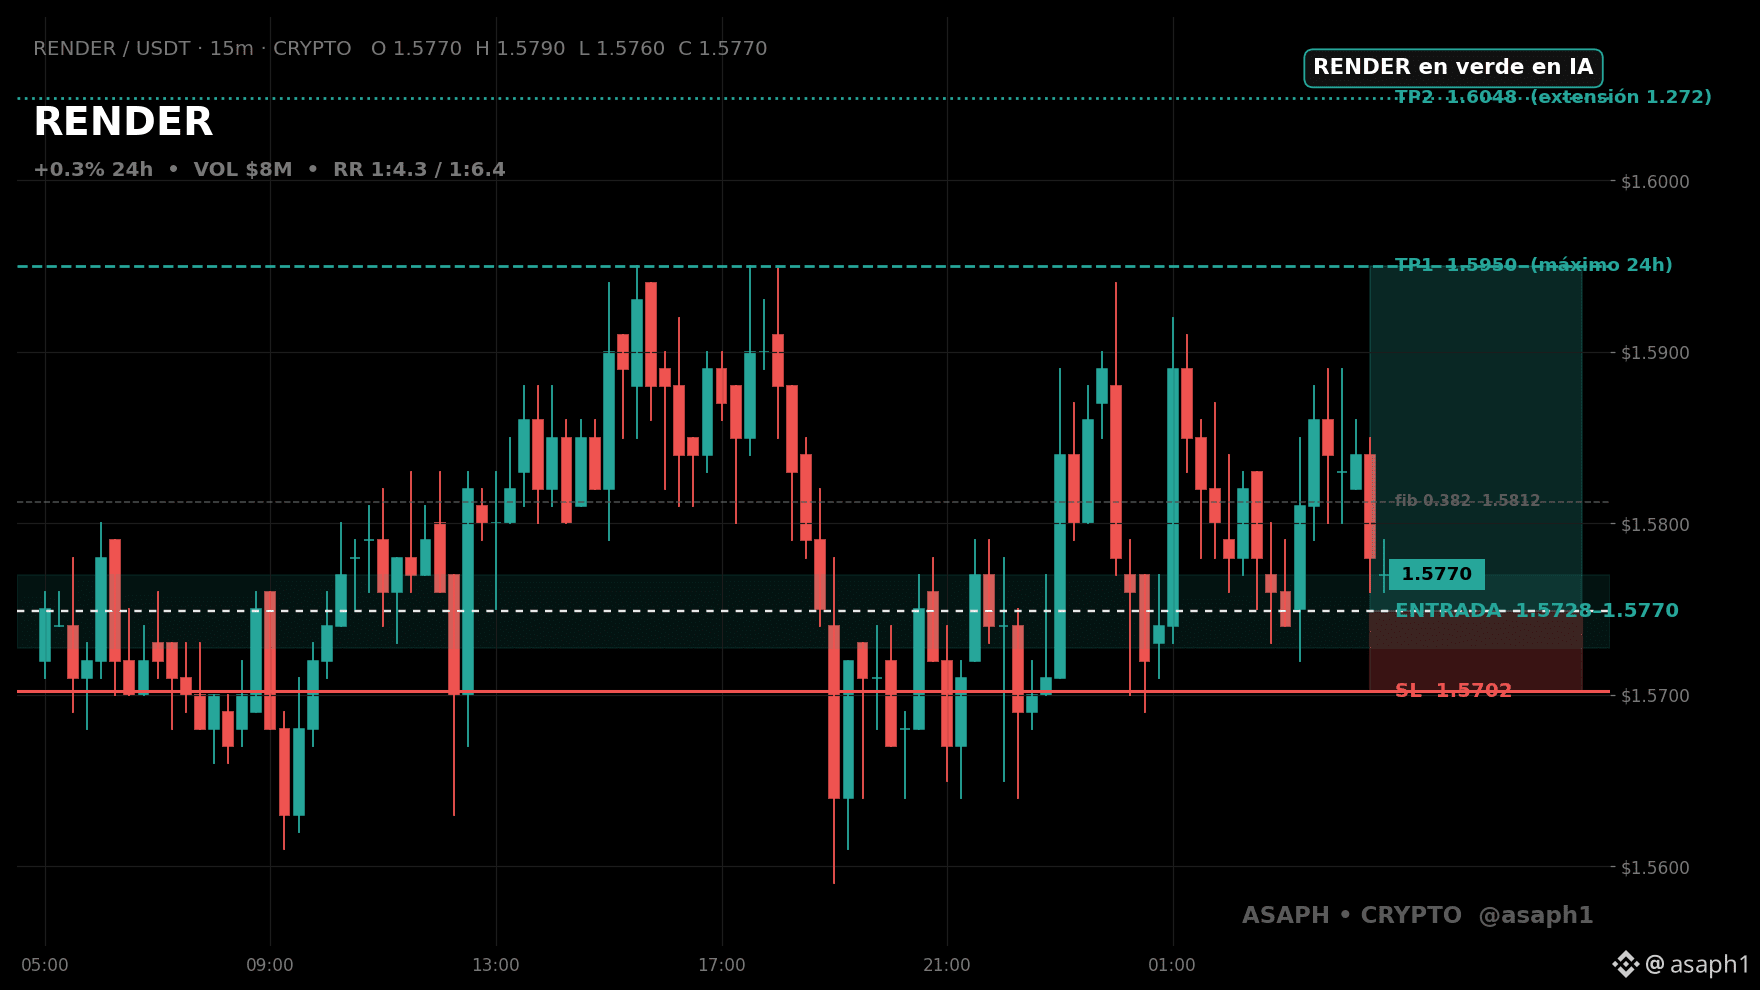
🎨 $RENDER AI BETRAYAL: RENDER HOLDS IN THE GREEN WHILE TAO AND FET FALL
The AI category is down 1.61% in the night snapshot, and the sector’s heavyweights are turning red. To me, when the entire sector falls and just one token stays in the green, that’s worth watching: RENDER isn’t following the drop—it’s defying it.
Look at the detail nobody is noticing:
→ AI is down 1.61% in the 9:19 p.m. ET snapshot, the worst-performing category of the night, while CeFi leads with +1.34% and BTC holds near $78,000.
→ RENDER +0.3% with $7.7M, while TAO -1.4% and FET -0.9% fall among the AI tokens: RENDER is the only one in the green.
→ Entry $1.5728–$1.577, SL $1.5702, TP1 $1.595 (+1.3%) → TP2 $1.6048 (+1.9%).
Will RENDER reach $1.6048, or will AI drag it into the red? 👇
$RENDER $TAO $FET
#Render #IA #Trading
🎨 $RENDER AI BETRAYAL: RENDER HOLDS IN THE GREEN WHILE TAO AND FET FALL
The AI category is down 1.61% in the night snapshot, and the sector’s heavyweights are turning red. To me, when the entire sector falls and just one token stays in the green, that’s worth watching: RENDER isn’t following the drop—it’s defying it.
Look at the detail nobody is noticing:
→ AI is down 1.61% in the 9:19 p.m. ET snapshot, the worst-performing category of the night, while CeFi leads with +1.34% and BTC holds near $78,000.
→ RENDER +0.3% with $7.7M, while TAO -1.4% and FET -0.9% fall among the AI tokens: RENDER is the only one in the green.
→ Entry $1.5728–$1.577, SL $1.5702, TP1 $1.595 (+1.3%) → TP2 $1.6048 (+1.9%).
Will RENDER reach $1.6048, or will AI drag it into the red? 👇
$RENDER $TAO $FET
#Render #IA #Trading
The AI category is down 1.61% in the night snapshot, and the sector’s heavyweights are turning red. To me, when the entire sector falls and just one token stays in the green, that’s worth watching: RENDER isn’t following the drop—it’s defying it.
Look at the detail nobody is noticing:
→ AI is down 1.61% in the 9:19 p.m. ET snapshot, the worst-performing category of the night, while CeFi leads with +1.34% and BTC holds near $78,000.
→ RENDER +0.3% with $7.7M, while TAO -1.4% and FET -0.9% fall among the AI tokens: RENDER is the only one in the green.
→ Entry $1.5728–$1.577, SL $1.5702, TP1 $1.595 (+1.3%) → TP2 $1.6048 (+1.9%).
Will RENDER reach $1.6048, or will AI drag it into the red? 👇
$RENDER $TAO $FET
#Render #IA #Trading
36
·
--
$RENDER 24h volume is 0.4x its weekly average and most people misread that completely
price is down 2.3 percent today at 1.5670 sitting near the bottom of the 1.5550 to 1.6090 range
when volume drops to 0.4x average during a pullback it usually means sellers lack conviction
compare that to a high volume drop where actual distribution happens and panic takes over
you check this ratio yourself by comparing today volume to the seven day volume moving average on your chart
low volume drifting down just means nobody cares yet
Do not take my word for it, tap $RENDER and look at the candles
what is your favorite filter to avoid fake breakouts
#RENDER #TradingTips
$RENDER 24h volume is 0.4x its weekly average and most people misread that completely
price is down 2.3 percent today at 1.5670 sitting near the bottom of the 1.5550 to 1.6090 range
when volume drops to 0.4x average during a pullback it usually means sellers lack conviction
compare that to a high volume drop where actual distribution happens and panic takes over
you check this ratio yourself by comparing today volume to the seven day volume moving average on your chart
low volume drifting down just means nobody cares yet
Do not take my word for it, tap $RENDER and look at the candles
what is your favorite filter to avoid fake breakouts
#RENDER #TradingTips
price is down 2.3 percent today at 1.5670 sitting near the bottom of the 1.5550 to 1.6090 range
when volume drops to 0.4x average during a pullback it usually means sellers lack conviction
compare that to a high volume drop where actual distribution happens and panic takes over
you check this ratio yourself by comparing today volume to the seven day volume moving average on your chart
low volume drifting down just means nobody cares yet
Do not take my word for it, tap $RENDER and look at the candles
what is your favorite filter to avoid fake breakouts
#RENDER #TradingTips
14

·
--
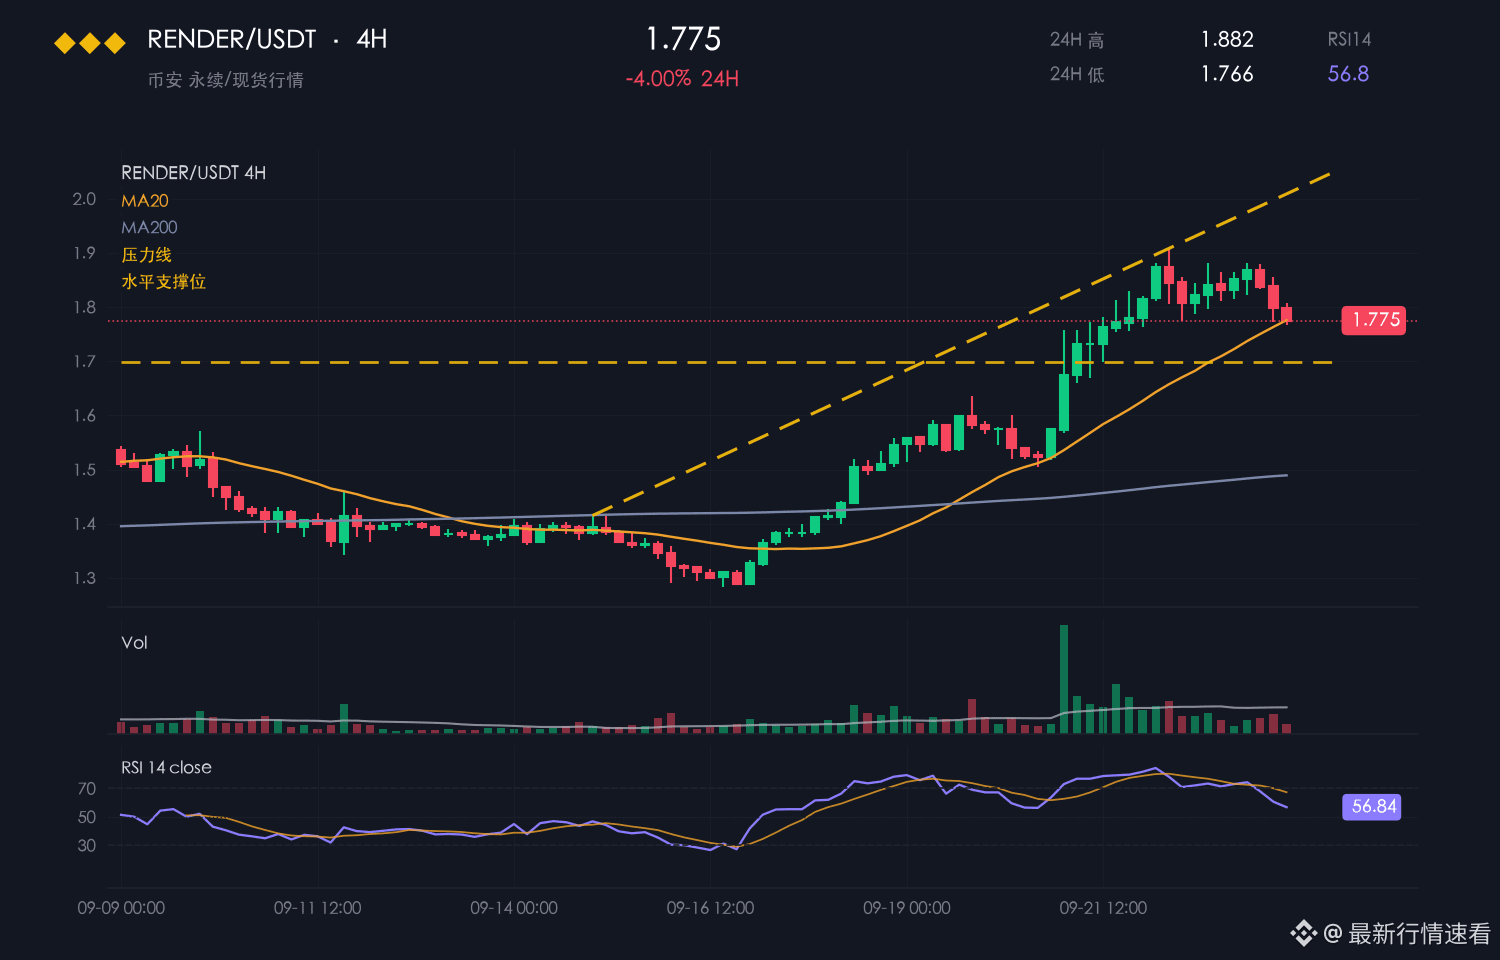
RENDER is currently at 1.701, up 0.18% over 24 hours, while still down 10.99% over 7 days. The intraday range was 1.650–1.740, with an amplitude of 5.5%.
【Market】
If you're looking to buy the dip after this rally, take note first.
RENDER completed this round of turnover between 1.650 and 1.740; the 0.18% gain is just the result.
RENDER posted a modest gain over 24 hours, with its center of gravity edging higher within the 1.650–1.740 range.
The 1.650 level has been tested several times without breaking, and buyers have stepped in decisively on pullbacks.
Over the same period, BTC was up 0.31% in 24 hours. RENDER's 0.18% gain failed to outperform the broader market, making this a market-following rise.
【Macro】 U.S. stocks rose overnight, with the Nasdaq up 0.82% and the S&P 500 up 0.70% (at the 2026-10-27 close). BTC ETFs saw net outflows of about $45.2 billion this month. U.S. CPI came in above expectations at 3.7% year over year, and the probability of a rate hike at the 2026-10-27/28 policy meeting is around 47%.
The short-term bias is bullish.
【Bullish case】
If 1.650 holds, there's still something to watch in the short term; if 1.740 is taken back in the opposite direction, the outlook will need to be reassessed.
The 10.99% weekly drawdown has yet to be recovered, so the 0.18% rebound over 24 hours is not yet enough to signal a trend reversal.
The choice is yours. No need to rush—just watch.
Keep in mind that if the broader market turns lower, RENDER's higher-priced holders could start selling at any time.
$RENDER #RENDER
RENDER is currently at 1.701, up 0.18% over 24 hours, while still down 10.99% over 7 days. The intraday range was 1.650–1.740, with an amplitude of 5.5%.
【Market】
If you're looking to buy the dip after this rally, take note first.
RENDER completed this round of turnover between 1.650 and 1.740; the 0.18% gain is just the result.
RENDER posted a modest gain over 24 hours, with its center of gravity edging higher within the 1.650–1.740 range.
The 1.650 level has been tested several times without breaking, and buyers have stepped in decisively on pullbacks.
Over the same period, BTC was up 0.31% in 24 hours. RENDER's 0.18% gain failed to outperform the broader market, making this a market-following rise.
【Macro】 U.S. stocks rose overnight, with the Nasdaq up 0.82% and the S&P 500 up 0.70% (at the 2026-10-27 close). BTC ETFs saw net outflows of about $45.2 billion this month. U.S. CPI came in above expectations at 3.7% year over year, and the probability of a rate hike at the 2026-10-27/28 policy meeting is around 47%.
The short-term bias is bullish.
【Bullish case】
If 1.650 holds, there's still something to watch in the short term; if 1.740 is taken back in the opposite direction, the outlook will need to be reassessed.
The 10.99% weekly drawdown has yet to be recovered, so the 0.18% rebound over 24 hours is not yet enough to signal a trend reversal.
The choice is yours. No need to rush—just watch.
Keep in mind that if the broader market turns lower, RENDER's higher-priced holders could start selling at any time.
$RENDER #RENDER
【Market】
If you're looking to buy the dip after this rally, take note first.
RENDER completed this round of turnover between 1.650 and 1.740; the 0.18% gain is just the result.
RENDER posted a modest gain over 24 hours, with its center of gravity edging higher within the 1.650–1.740 range.
The 1.650 level has been tested several times without breaking, and buyers have stepped in decisively on pullbacks.
Over the same period, BTC was up 0.31% in 24 hours. RENDER's 0.18% gain failed to outperform the broader market, making this a market-following rise.
【Macro】 U.S. stocks rose overnight, with the Nasdaq up 0.82% and the S&P 500 up 0.70% (at the 2026-10-27 close). BTC ETFs saw net outflows of about $45.2 billion this month. U.S. CPI came in above expectations at 3.7% year over year, and the probability of a rate hike at the 2026-10-27/28 policy meeting is around 47%.
The short-term bias is bullish.
【Bullish case】
If 1.650 holds, there's still something to watch in the short term; if 1.740 is taken back in the opposite direction, the outlook will need to be reassessed.
The 10.99% weekly drawdown has yet to be recovered, so the 0.18% rebound over 24 hours is not yet enough to signal a trend reversal.
The choice is yours. No need to rush—just watch.
Keep in mind that if the broader market turns lower, RENDER's higher-priced holders could start selling at any time.
$RENDER #RENDER
32
·
--
Your $RENDER stop at two percent is just a donation to the order book
A stop belongs below the level that proves your idea dead
Right now $RENDER sits at 1.5670 and the normal hourly swing eats 0.8 percent of price on any given chop
If you put your exit closer than that the market noise takes you out before the move even starts
The last 24h swing low sits right at 1.5320 and that makes far more sense for protection than some random round number
Let the chart breathe or get chopped to pieces
Where do you usually put your stops when trading
#RENDER #TradingTips
Your $RENDER stop at two percent is just a donation to the order book
A stop belongs below the level that proves your idea dead
Right now $RENDER sits at 1.5670 and the normal hourly swing eats 0.8 percent of price on any given chop
If you put your exit closer than that the market noise takes you out before the move even starts
The last 24h swing low sits right at 1.5320 and that makes far more sense for protection than some random round number
Let the chart breathe or get chopped to pieces
Where do you usually put your stops when trading
#RENDER #TradingTips
A stop belongs below the level that proves your idea dead
Right now $RENDER sits at 1.5670 and the normal hourly swing eats 0.8 percent of price on any given chop
If you put your exit closer than that the market noise takes you out before the move even starts
The last 24h swing low sits right at 1.5320 and that makes far more sense for protection than some random round number
Let the chart breathe or get chopped to pieces
Where do you usually put your stops when trading
#RENDER #TradingTips
12

·
--
$RENDER This hour, let's first look at the actual data at hand.
Binance spot, 11/01 21:15–22:15 (Beijing time): up 0.13% over the hour, with a trading volume of 39,200 USDT, 0.75 times that of the previous hour. The closing price for the period was 1.585 USDT.
These figures describe this spot trading pair on Binance. They cannot directly represent trading volume across the entire market, nor can they alone explain the reasons for the change.
Trading volume during this period was lower than in the previous hour. Let's look at the actual amount first, then compare it with the next complete set of data. We shouldn't judge trading activity based on price movements alone. What other verifiable data should we watch next? Let's first be specific about what to look for.
#RENDER #Market Watch
$RENDER This hour, let's first look at the actual data at hand.
Binance spot, 11/01 21:15–22:15 (Beijing time): up 0.13% over the hour, with a trading volume of 39,200 USDT, 0.75 times that of the previous hour. The closing price for the period was 1.585 USDT.
These figures describe this spot trading pair on Binance. They cannot directly represent trading volume across the entire market, nor can they alone explain the reasons for the change.
Trading volume during this period was lower than in the previous hour. Let's look at the actual amount first, then compare it with the next complete set of data. We shouldn't judge trading activity based on price movements alone. What other verifiable data should we watch next? Let's first be specific about what to look for.
#RENDER #Market Watch
Binance spot, 11/01 21:15–22:15 (Beijing time): up 0.13% over the hour, with a trading volume of 39,200 USDT, 0.75 times that of the previous hour. The closing price for the period was 1.585 USDT.
These figures describe this spot trading pair on Binance. They cannot directly represent trading volume across the entire market, nor can they alone explain the reasons for the change.
Trading volume during this period was lower than in the previous hour. Let's look at the actual amount first, then compare it with the next complete set of data. We shouldn't judge trading activity based on price movements alone. What other verifiable data should we watch next? Let's first be specific about what to look for.
#RENDER #Market Watch
2

·
--
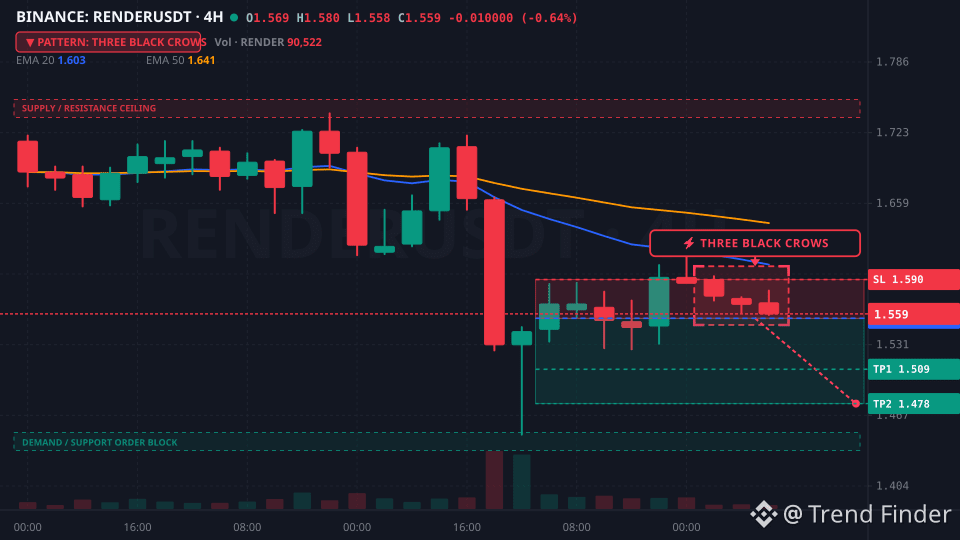
Heavy spot absorption on $RENDER has failed as a 4H Three Black Crows print triggers a 55-point short breakout. Institutional flow is leaning into the $BTC weakness to sweep liquidity from trapped longs below EMA20 1.567. Momentum is firm with RSI at 44.
#BinanceSquare #CryptoTrading #RENDER
Heavy spot absorption on $RENDER has failed as a 4H Three Black Crows print triggers a 55-point short breakout. Institutional flow is leaning into the $BTC weakness to sweep liquidity from trapped longs below EMA20 1.567. Momentum is firm with RSI at 44.
#BinanceSquare #CryptoTrading #RENDER
#BinanceSquare #CryptoTrading #RENDER
1
8
Log in to explore more content
Join global crypto users on Binance Square
⚡️ Get latest and useful information about crypto.
💬 Trusted by the world’s largest crypto exchange.
👍 Discover real insights from verified creators.
Email / Phone number
Trending Topics
1
#PalantirSlides3PercentOn$2BRevenue
0 views
0 Discussing
2
#BinanceReopensWithdrawalsForMoreAssets
12,783 views
438 Discussing
3
#AppleReportsMixedResults
8,919 views
353 Discussing
4
#BinanceHourlyDepositsExceedWithdrawals
430 views
52 Discussing
5
#USMidtermElections
693,870 views
3,765 Discussing
6
#USOctoberNFP-AreRateCutsStillPossible
96,591 views
862 Discussing
7
#Verify1to1BinanceReserves
86,996 views
635 Discussing
8
#SBIFirstHalfCryptoRevenueFalls30.1%
0 views
5 Discussing
9
#NEARVoteApprovesCutInMaxAnnualIssuanceTo1.6%
1,093 views
29 Discussing
10
#BinanceRestores28FiatWithdrawals
233,675 views
1,302 Discussing