$ETH Technical Analysis: Crucial Candle Patterns & Key Zones to Watch!
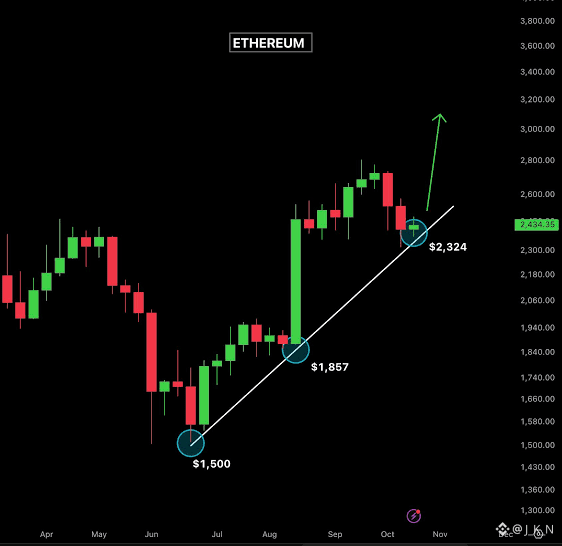
Ethereum's price structure is catching massive attention as the daily chart reveals intense battlefield positioning between buyers and sellers. Following a clean retest of macro trend support lines, the asset is pressuring immediate structural barriers.
Here is a breakdown of the active technical signals:
🧩 The Candlestick Breakdown
• Rejection Candles: A recent daily shooting star pattern at local highs signals heavy selling pressure near overhead resistance.
• Demand Validation: Long lower-wick candles (hammer-like structures) are forming near support, indicating aggressive buyer absorption in lower demand blocks.
📉 Key Structural Levels
• Overhead Resistance: The immediate zone remains heavily guarded. A decisive close above this level clears the path toward a major macro range extension.
• Critical Support Block: If a broader market pullback occurs, buyers are heavily waiting around the key moving average floors. Losing this zone opens up a liquidity sweep downward.
⚡ Momentum & Indicators
• Moving Averages (EMA): Price action is actively fighting the short-term 9 and 21 Exponential Moving Averages (EMAs). A sustained breakout above them flips momentum purely bullish.
• Volume Profile: On-chain accumulation volume expands on down-days, showing institutional backing beneath the surface volatility.
💡 The Verdict: Wait for the daily candle to close above the current EMA compression before executing any breakout trades. Patience is key while liquidity gets squeezed.
💬 Are you bullish or bearish on $ETH at these levels? Drop your charts below! 👇
#Ethereum #Ethereum #technicalanalyst #cryptotrade #candlestick_patterns
Ethereum's price structure is catching massive attention as the daily chart reveals intense battlefield positioning between buyers and sellers. Following a clean retest of macro trend support lines, the asset is pressuring immediate structural barriers.
Here is a breakdown of the active technical signals:
🧩 The Candlestick Breakdown
• Rejection Candles: A recent daily shooting star pattern at local highs signals heavy selling pressure near overhead resistance.
• Demand Validation: Long lower-wick candles (hammer-like structures) are forming near support, indicating aggressive buyer absorption in lower demand blocks.
📉 Key Structural Levels
• Overhead Resistance: The immediate zone remains heavily guarded. A decisive close above this level clears the path toward a major macro range extension.
• Critical Support Block: If a broader market pullback occurs, buyers are heavily waiting around the key moving average floors. Losing this zone opens up a liquidity sweep downward.
⚡ Momentum & Indicators
• Moving Averages (EMA): Price action is actively fighting the short-term 9 and 21 Exponential Moving Averages (EMAs). A sustained breakout above them flips momentum purely bullish.
• Volume Profile: On-chain accumulation volume expands on down-days, showing institutional backing beneath the surface volatility.
💡 The Verdict: Wait for the daily candle to close above the current EMA compression before executing any breakout trades. Patience is key while liquidity gets squeezed.
💬 Are you bullish or bearish on $ETH at these levels? Drop your charts below! 👇
#Ethereum #Ethereum #technicalanalyst #cryptotrade #candlestick_patterns