

#btcanalysis
btcanalysis
2.2M views
5,075 Discussing
Hot
Latest

·
--
See translation
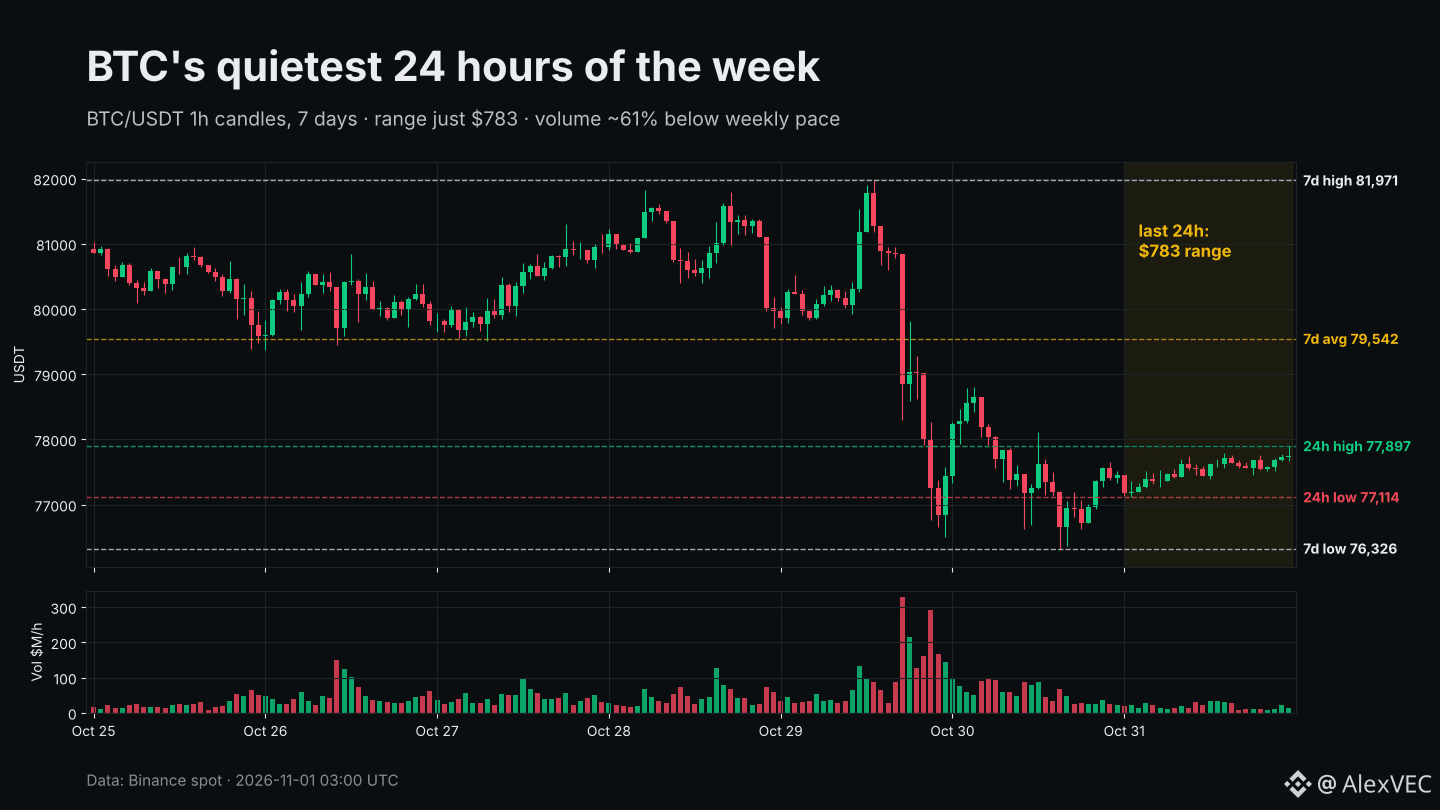
$BTC just had its quietest 24 hours of the week: a $783 range, start to finish.
For context, Thursday's candle swung $5,471 when price fell from 81,971 to the 76,500 area. Since then it's been nothing but small candles between 77,114 and 77,897.
What the data says:
• Price 77,742, +0.37% on the day
• 7-day change: -3.9%
• 24h spot volume ~$454M vs a ~$1.16B daily average this week, so roughly 61% lighter
• Still below the 7-day average of ~79,540
My read: this looks more like a pause after the drop than a reversal. Bulls want to see a close above 77,900 and then a reclaim of 79,500. Bears are watching the 7-day low at 76,326; losing it on real volume would open the door to a fresh leg down.
Ranges this tight on thin weekend volume rarely last. When the expansion comes, which side do you think breaks first?
Not financial advice.
#Bitcoin #BTCAnalysis #CryptoMarket
66

·
--
See translation
🚨 WILL BITCOIN DROP BACK TO $67K? 👀
$BTC
{future}(BTCUSDT)
The big question on every trader’s mind right now!
Could BTC see another major correction toward $67,000, or will the bulls step in and push the price higher?
📉 Bears are watching for a breakdown.
📈 Bulls are hoping for a strong recovery.
The next move could surprise everyone. Stay alert, manage your risk, and don't let emotions control your trades.
What's your prediction?
🔴 $67K incoming?
🟢 Or straight back to new highs?
#Bitcoin #CryptoMarket #BTCanalysis
🚨 WILL BITCOIN DROP BACK TO $67K? 👀
$BTC
The big question on every trader’s mind right now!
Could BTC see another major correction toward $67,000, or will the bulls step in and push the price higher?
📉 Bears are watching for a breakdown.
📈 Bulls are hoping for a strong recovery.
The next move could surprise everyone. Stay alert, manage your risk, and don't let emotions control your trades.
What's your prediction?
🔴 $67K incoming?
🟢 Or straight back to new highs?
#Bitcoin #CryptoMarket #BTCanalysis
43

·
--
See translation
🚨 BITCOIN SHORT SQUEEZE ALERT! BTC BUYERS ARE FIGHTING BACK! 🟢
Bitcoin has delivered another painful blow to bearish traders!
💥 Liquidation Details:
Asset: $BTC
Liquidated Position: Short
Liquidation Value: $143,000
Price Level: $77,127.20
📊 Market Interpretation: A $143K short liquidation event suggests that bearish traders are getting caught on the wrong side of the move. As short positions get forced out, additional buying pressure could support further upside momentum.
🎯 My Next Move Outlook: BTC may attempt to extend its recovery if buyers maintain control above the $77K region. Watch for a push toward $77,500–$78,000, while rejection could trigger another move toward $76,500.
⚡ Trader's Strategy: Watch volume, price structure, and liquidity zones before entering. A short squeeze can accelerate quickly, but it doesn't guarantee a sustained bullish reversal.
The bears just paid the price. Will Bitcoin squeeze them even harder? 👀
#Bitcoin #BTC #CryptoTrading #ShortSqueeze #Liquidations #BinanceSquare #BTCAnalysis
#CZSaysCompensationIsinPlaceUsersAreProtected #CZSaysCompensationIsinPlaceUsersAreProtected #USDCCirculationFallsAbout800MInSevenDays #ASICHasReceivedNoPredictionMarketApplications
{spot}(BTCUSDT)
🚨 BITCOIN SHORT SQUEEZE ALERT! BTC BUYERS ARE FIGHTING BACK! 🟢
Bitcoin has delivered another painful blow to bearish traders!
💥 Liquidation Details:
Asset: $BTC
Liquidated Position: Short
Liquidation Value: $143,000
Price Level: $77,127.20
📊 Market Interpretation: A $143K short liquidation event suggests that bearish traders are getting caught on the wrong side of the move. As short positions get forced out, additional buying pressure could support further upside momentum.
🎯 My Next Move Outlook: BTC may attempt to extend its recovery if buyers maintain control above the $77K region. Watch for a push toward $77,500–$78,000, while rejection could trigger another move toward $76,500.
⚡ Trader's Strategy: Watch volume, price structure, and liquidity zones before entering. A short squeeze can accelerate quickly, but it doesn't guarantee a sustained bullish reversal.
The bears just paid the price. Will Bitcoin squeeze them even harder? 👀
#Bitcoin #BTC #CryptoTrading #ShortSqueeze #Liquidations #BinanceSquare #BTCAnalysis
#CZSaysCompensationIsinPlaceUsersAreProtected #CZSaysCompensationIsinPlaceUsersAreProtected #USDCCirculationFallsAbout800MInSevenDays #ASICHasReceivedNoPredictionMarketApplications
7

·
--
See translation
Asia Pulse: $BTC Coils for Breakout 🚀
Price action: $BTC is trading at $68,720 on Binance Spot, up 1.9% over the past 24 hours. 24‑hour volume hovers around $12.4 B, reflecting steady liquidity but no decisive surge yet.
Key levels: Immediate support anchors near $66,500, while the ceiling of the current consolidation sits at $70,300. The mid‑range pivot sits roughly at $68,400, acting as a magnet for intraday swings.
Outlook: The chart shows a classic coil pattern with price nudging the $70,300 resistance. A volume spike above the pivot could trigger a breakout to the upside, testing $72,000 and beyond. Conversely, failure to break cleanly may pull the pair back into the $66,500‑$68,400 band for a short‑term retrench. Traders should watch for volume‑driven momentum before committing.
#CryptoBreakout #BTCAnalysis #BinanceSquare

See translation
📊 Bitcoin (BTC) Market Update — October 30, 2026
Bitcoin is facing selling pressure today.
🔴 BTC is trading around $77,600, down approximately 5.2% over the past 7 days.
What I'm watching:
• Whether BTC can hold the $76,600 support area.
• Whether buyers can push the price back above $79,100.
• Trading volume and overall market sentiment.
My view: The market looks cautious right now. I prefer waiting for confirmation rather than entering a trade emotionally.
⚠️ Crypto is highly volatile. Always manage your risk.
What do you think? Will BTC recover or continue falling?
$BTC #Bitcoin #CryptoMarket #BinanceSquare #BTCAnalysis
83
·
--
See translation
$BTC swept liquidity at 76,347 and bounced hard: real reversal or just a technical relief?
BTC dropped fast from the 81,800 area to a low of 76,347.9, tapping the daily EMA200 (76,401) and the September demand zone before bouncing to around 78,000. The long lower wick shows buyers stepping in right at support.
Key levels:
Support: 76,400 – 75,500. Losing this zone breaks the bullish structure. Resistance: 78,257 (daily EMA89), then 80,100 – 80,600 (1H EMA89/200). Major resistance: 82,400 and the previous high at 87,448.
Outlook: The 1H and 4H charts are still below their EMA89/200, so this bounce is only a technical reaction, not a confirmed reversal. Bullish case: a daily close above 78,257 with a successful retest. Bearish case: a daily close below 76,400 could send price back to sweep 75,500.
Don’t chase the bounce. Wait for a retest of support, set a clear stop loss, and manage risk tightly, as volatility is high.
Not financial advice. DYOR.
#BTC #Bitcoin #BTCAnalysis $BTC
{future}(BTCUSDT)
$BTC swept liquidity at 76,347 and bounced hard: real reversal or just a technical relief?
BTC dropped fast from the 81,800 area to a low of 76,347.9, tapping the daily EMA200 (76,401) and the September demand zone before bouncing to around 78,000. The long lower wick shows buyers stepping in right at support.
Key levels:
Support: 76,400 – 75,500. Losing this zone breaks the bullish structure. Resistance: 78,257 (daily EMA89), then 80,100 – 80,600 (1H EMA89/200). Major resistance: 82,400 and the previous high at 87,448.
Outlook: The 1H and 4H charts are still below their EMA89/200, so this bounce is only a technical reaction, not a confirmed reversal. Bullish case: a daily close above 78,257 with a successful retest. Bearish case: a daily close below 76,400 could send price back to sweep 75,500.
Don’t chase the bounce. Wait for a retest of support, set a clear stop loss, and manage risk tightly, as volatility is high.
Not financial advice. DYOR.
#BTC #Bitcoin #BTCAnalysis $BTC
171

See translation
{spot}(BTCUSDT)
$BTC ANALYSIS TODAY - 30 Oct
Direction: BULLISH 🟢
Timeframe: 4H
Support: $66,500
Resistance: $68,200
Scenario 1: If BTC holds above $67k -> Target $68.2k -> $69k
Scenario 2: If breaks $66.5k -> Short to $65.8k
My Plan: LONG above $67k with tight SL at $66.4k
This is not financial advice, just my analysis.
What is your direction? LONG or SHORT?
#BTCAnalysis #CryptoSignals #BinanceSquare
109

·
--
See translation
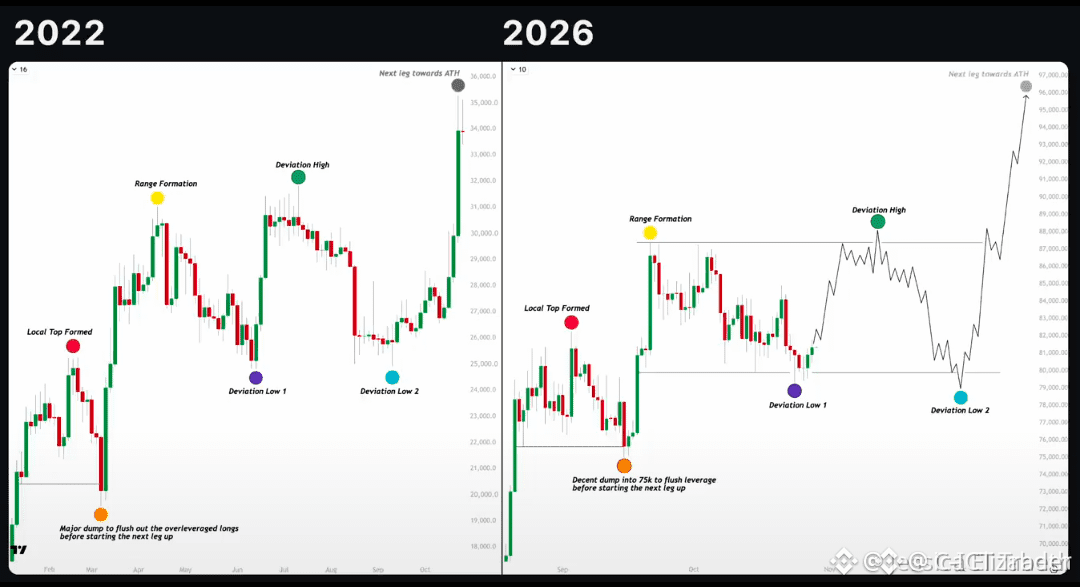
🚨 $BTC REVISITS 2022 FRACTAL – LIQUIDITY HUNT LOOMS! 📈
📊 The chart has carved a fresh local top, then dipped to a clean deviation low at $79,329 – a classic smart‑money absorption zone. A Fed‑hold echo sparked a 16% rally last cycle, and the same liquidity vacuum could fuel a relief surge toward $88,000. ⚡
🔍 Watch the $79,329 order block: a decisive break above flips the bias bullish, while a swift rejection would recycle liquidity down to the $77‑78K corridor, re‑igniting the sell‑side sweep. 💬 Which side will the institutions defend first? 👇
⚠️ Not financial advice. Always manage your risk. 🛡️
🏷️ #BTC #LiquiditySweep #FractalPattern #BTCAnalysis
🔥 💎
6

See translation
🚀 BTC at the Edge: $80,350 – Sellers in Control
Bitcoin is sitting at $80,350, battling strong selling pressure and struggling to hold above the $80k psychological barrier. Derivative data shows a heavily leveraged long side (Funding Rate +0.0053%, L/S 1.84, Open Interest ≈ 97,860 BTC), raising the risk of a rapid Long Squeeze. Liquidity clusters sit below the market—most notably $79,000‑$79,500 and $78,000‑$78,500, with a dense wall around $76,500‑$77,000 near the 21‑week EMA—making these zones attractive targets for forced liquidation.
On the flip side, institutional signals are bullish: ETFs poured in $137 M today and a net outflow of 3.3 k BTC from exchanges hints at long‑term accumulation. Yet spot momentum remains muted (RSI 42.1, Fear & Greed 44), and the risk‑reward ratio for new longs is currently unfavorable. Probabilistic outlooks lean down (60% chance of a 1‑hour dip, 55% on 4‑hour, 50% over 24 h), while a 7‑day horizon still offers a modest upside if price can rebound above $80.5k.
**Verdict:** Expect a neutral‑to‑bearish short‑term swing, likely pulling toward the $79k‑$78k liquidity zones before any meaningful recovery. Keep risk tight and consider waiting for a better entry point.
Will you stay on the sidelines or hunt the lower‑liquidity pockets for a potential bounce?
#Bitcoin #CryptoTrading #LongSqueeze #BTCAnalysis
72

See translation
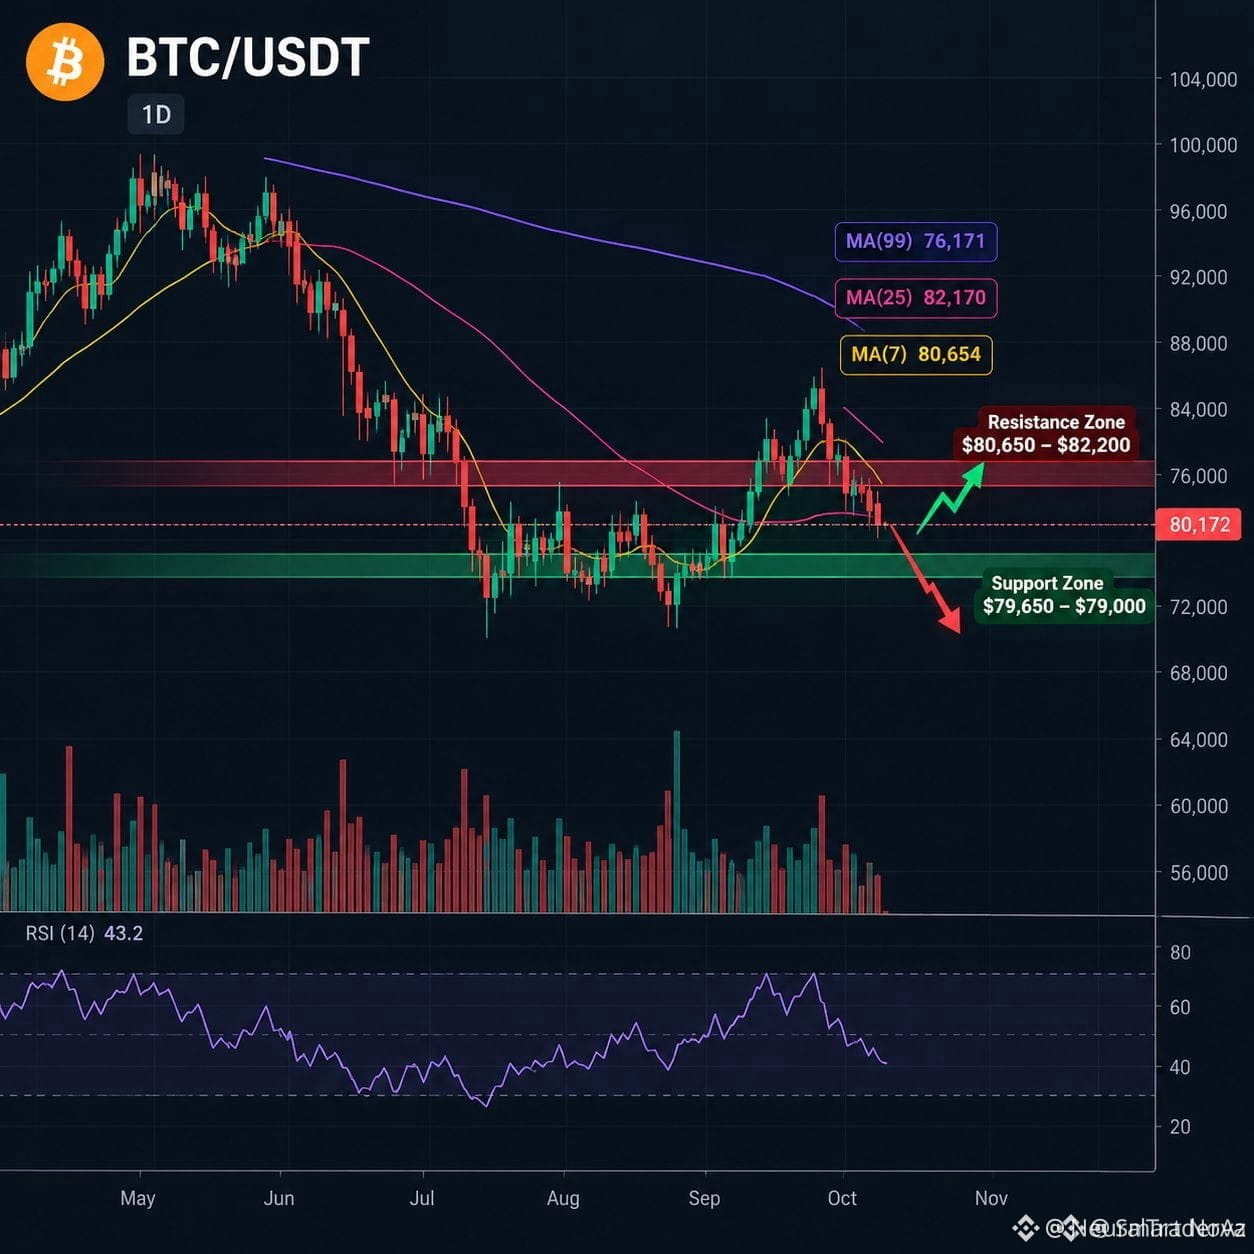
🚨 $BTC TEETERING AT $80K – LIQUIDITY HUNT IN PLAY! 📉
Entry: 80,172 ⚡
Target: 80,650 🚀
Stop Loss: 79,650 ⚠️
The market is grinding around the $80,172 mark, hugging the $79,650‑$79,000 support cluster. Sellers have been aggressive, carving the 4‑hour profile and exposing a fresh liquidity pool. 📊
If smart money re‑asserts demand, the next order block sits near $80,650‑$82,200, offering a clean retest corridor. Conversely, a breach below $79,650 could accelerate the downside toward $78,600, flushing out remaining longs. 🦈
💬 Do you see the next liquidity sweep favoring bulls or bears?
⚠️ Not financial advice. Always manage your risk. 🛡️
🏷️ #BTC #LiquidityHunt #Crypto #BTCAnalysis
🚀 🔥
6

·
--
See translation
🚨 BITCOIN ALERT 🚨 — BREAKOUT OR BREAKDOWN? ₿🔥
Bitcoin is moving near a critical decision zone! 📊
⚡ What should BTC traders watch now?
🟢 Bullish scenario: If BTC breaks above resistance and holds there, buyers may gain momentum.
🔴 Bearish scenario: If BTC loses support, sellers may take control.
🎯 Before You Trade: ✅ Open the $BTC chart on Binance. ✅ Check the 15-minute and 1-hour trends. ✅ Set your entry, Stop-Loss & Take-Profit before entering. ✅ Never enter a trade just because of FOMO.
💬 YOUR TURN! 👇
Are you watching BTC for a BREAKOUT 📈 or a BREAKDOWN 📉?
Comment your view and explain why!
👉 Open the $BTC chart, analyze the market, and make your own informed decision.
⚠️ Crypto is risky. This is educational content, not financial advice. No profit is guaranteed.
$BTC $ETH #Bitcoin #CryptoTrading #BinanceSquare #BTCAnalysis
{spot}(BTCUSDT)
🚨 BITCOIN ALERT 🚨 — BREAKOUT OR BREAKDOWN? ₿🔥
Bitcoin is moving near a critical decision zone! 📊
⚡ What should BTC traders watch now?
🟢 Bullish scenario: If BTC breaks above resistance and holds there, buyers may gain momentum.
🔴 Bearish scenario: If BTC loses support, sellers may take control.
🎯 Before You Trade: ✅ Open the $BTC chart on Binance. ✅ Check the 15-minute and 1-hour trends. ✅ Set your entry, Stop-Loss & Take-Profit before entering. ✅ Never enter a trade just because of FOMO.
💬 YOUR TURN! 👇
Are you watching BTC for a BREAKOUT 📈 or a BREAKDOWN 📉?
Comment your view and explain why!
👉 Open the $BTC chart, analyze the market, and make your own informed decision.
⚠️ Crypto is risky. This is educational content, not financial advice. No profit is guaranteed.
$BTC $ETH #Bitcoin #CryptoTrading #BinanceSquare #BTCAnalysis
100

·
--
See translation
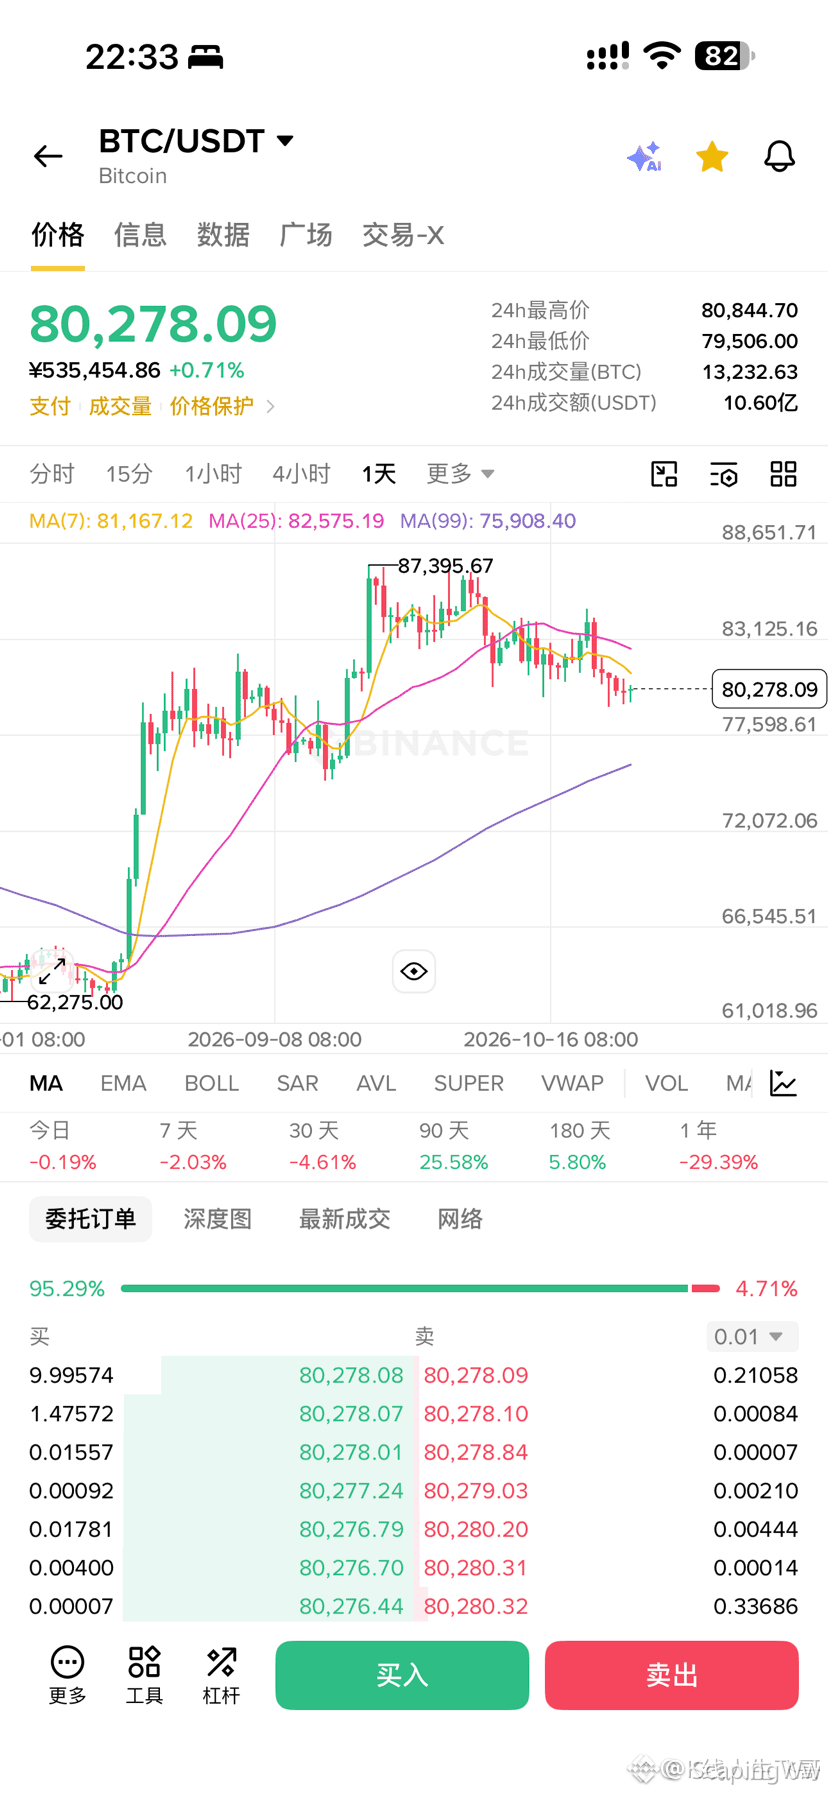
🚀 $BTC PREPARES FOR A DOUBLE‑PLAY REBOUND OR DEEP TEST! ⚡
The chart’s red streak is flirting with a 76k trough, but the real story is the upside bounce that could retest the 83.5k zone and even plug the 85.5k gap. 📊 Volume on the 4‑hour is whispering liquidity waiting on the other side.
I’m leaning into the healthier script – a short‑term pop that forces smart‑money to refill the missing 85k block before the next down‑move. ⚡ That’s where the next wave of buying pressure can lock in, turning today’s pull‑back into a launchpad. 💬 Are you positioning for the 83.5k retest or waiting for the 76k dip to melt?
⚠️ Not financial advice. Always manage your risk. 🛡️
🏷️ #BTC #Rebound #BTCAnalysis #Crypto
🚀 💎
9

See translation
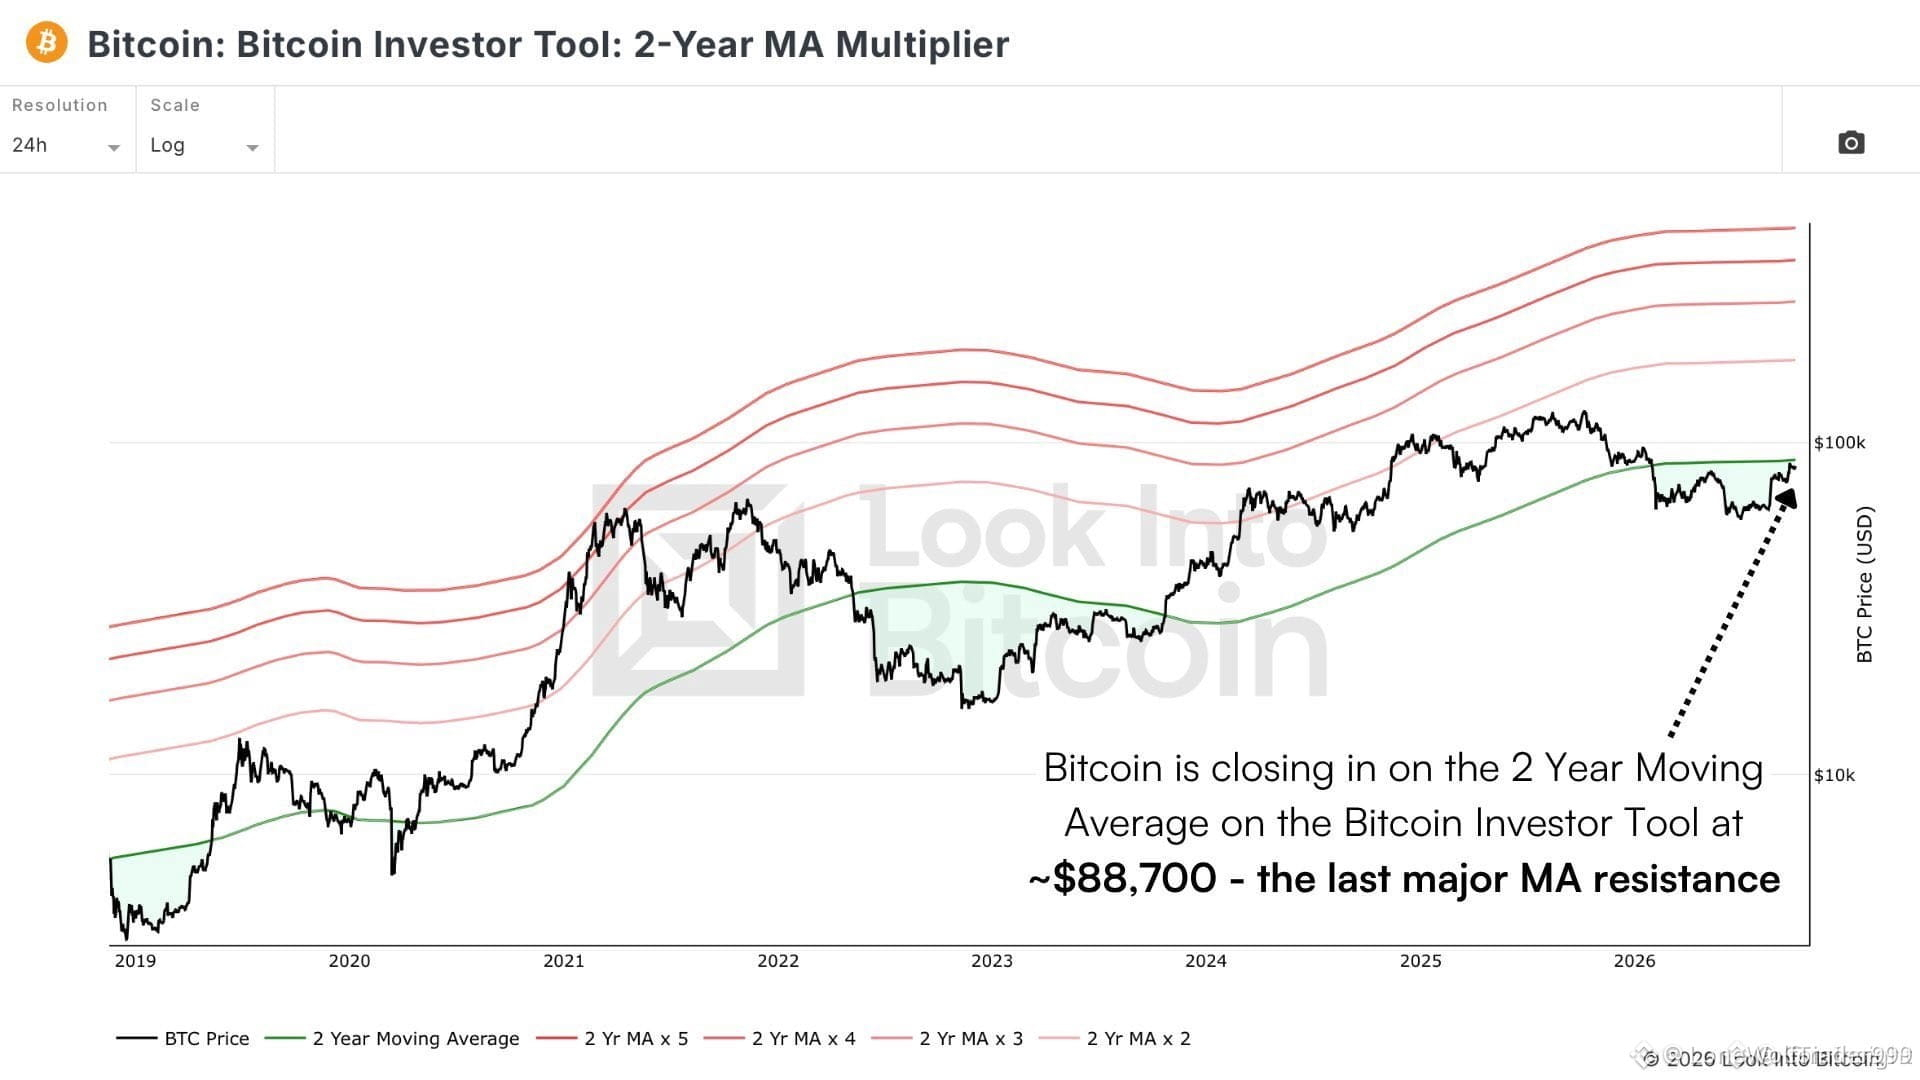
🚨 $BTC TESTS 2-YEAR MOVING AVERAGE – IS REBOUND ON THE HORIZON? 📈
📊 The 730‑day SMA sits around $88,700, a historic choke point where past bull‑run accumulations brewed in 2018 and 2022. 🌊 BTC lingering below this line signals a potential “quiet before the storm” phase, not a dead‑end.
🦈 Smart money often uses prolonged sub‑MA dips to stack positions before a liquidity sweep ignites a breakout. Keep an eye on volume spikes and order‑book pressure as clues to the next move. 📈
💬 Do you see this as a prime accumulation window or a warning of deeper downside? 👇
⚠️ Not financial advice. Always manage your risk. 🛡️
🏷️ #BTC #LongSetup #BTCAnalysis #Crypto
🔥 💎


See translation
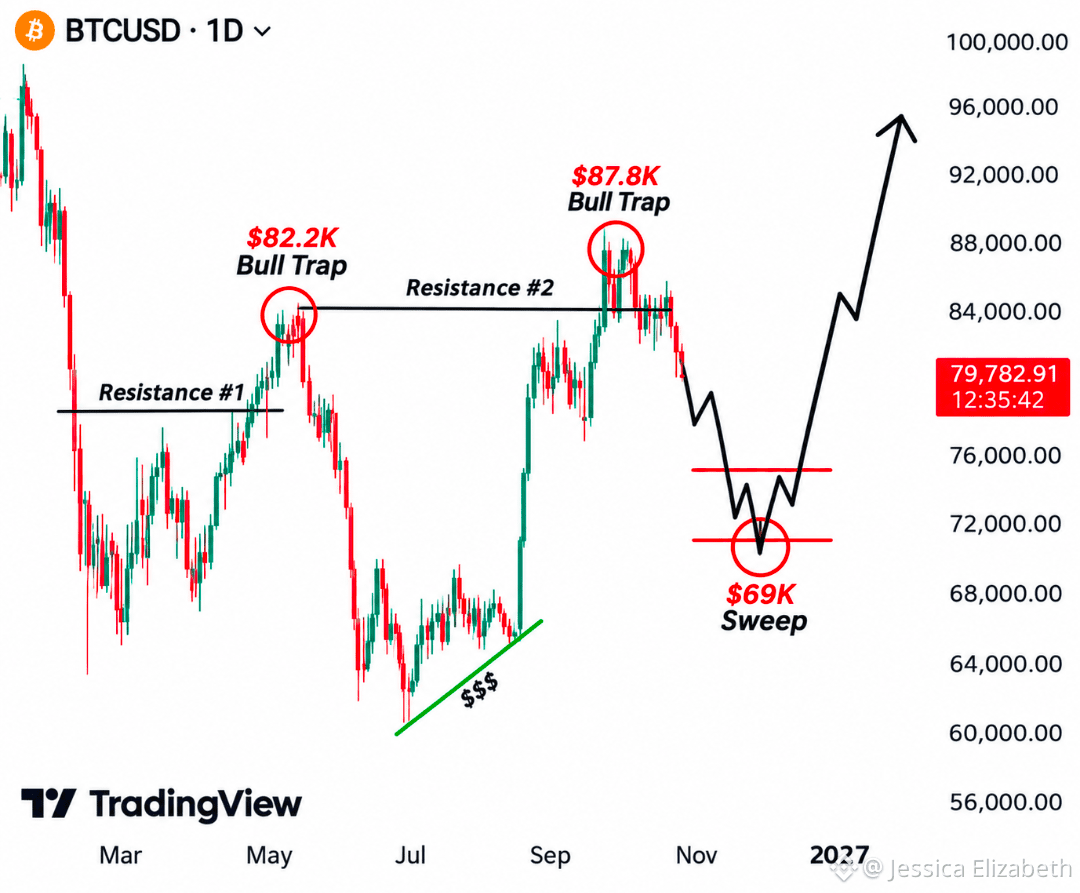
𝐒𝐓𝐎𝐏..... 𝐒𝐓𝐎𝐏..... 𝐒𝐓𝐎𝐏 🚨
$BTC ⚠️ ONE LAST SHAKEOUT BEFORE THE NEXT BIG MOVE?
I warned about this pullback last week. Now Bitcoin is approaching the levels I'm watching closely.
📉 My BTC roadmap:
$79K → $75K → $69K → 🚀 Recovery & Potential Bull Run
I'm watching for one final liquidity sweep before the next major move higher.
But here's the key: the $69K sweep is a scenario, not a guarantee. Reclaiming key resistance levels will be crucial to confirming a bullish reversal.
📌 Save this chart and watch how price reacts at each level.
Will BTC sweep $69K before rallying, or have the bulls already found the bottom? 👇
#BTC #Bitcoin #CryptoMarket #BTCAnalysis #BitcoinPrice #CryptoSignals #BinanceSquare
RapidXPro:
Buen análisis, Jessica 👏 Coincido en que 69–72K es la zona clave. Yo lo veo con más cautela: tras el bull trap en 87.8K el precio sigue sin recuperar estructura, así que primero esperaría el barrido y luego una confirmación diaria antes de pensar en 96K. Para mí, un cierre diario sobre 87.8K invalida mi lectura bajista. ¿Tú qué esperas ver para validar el rebote? 📊
1
6
4.4k

·
--
Bullish
See translation
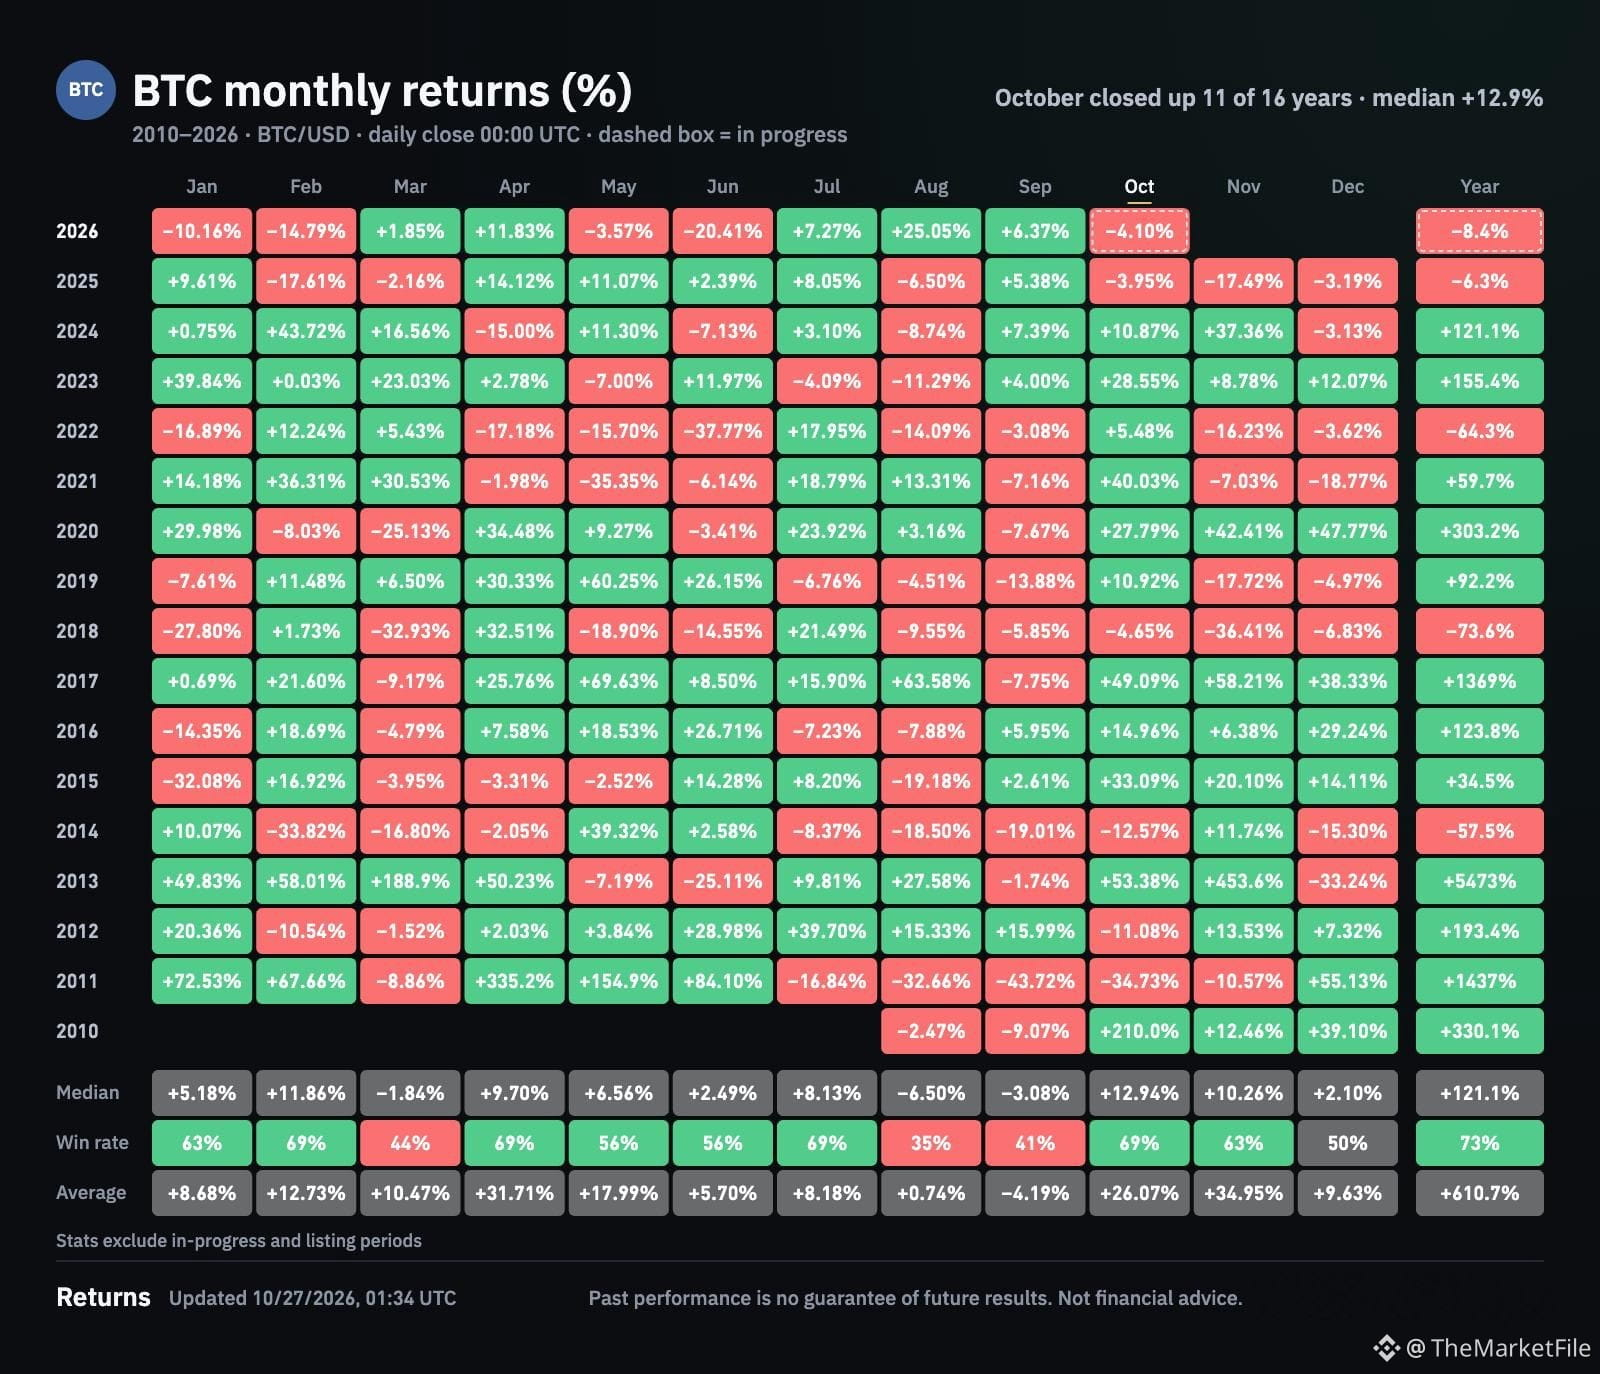
🚨 Bitcoin is heading for a red October.
Our thesis: the bear-market bottom is behind us.
Are sellers exhausted—or are bulls ignoring a weak chart?
THE MARKET FILE — RED MONTH, BULLISH THESIS
October 27, 2026
BTC is down roughly 4.1% this month. October hasn’t closed yet.
Four arguments support the bullish case. Each has limits. 👇
📊 1️⃣ LONG-TERM STRUCTURE
BTC reclaimed its 50-week moving average after 44 weeks below it, then posted five weekly closes above it through October 18.
Four comparable historical cases support the thesis—but remain a small sample.
🏦 2️⃣ POSITIONING RESET
Asset managers’ net long exposure in CME BTC futures fell 57% from the all-time-high week.
U.S. spot ETFs added about 87,000 BTC from the June low through the report’s cutoff.
Demand persisted as speculative positions unwound. That doesn’t prove selling is over.
👥 3️⃣ POSSIBLE CAPITULATION
Roughly 30,000 fewer addresses held BTC balances since October 16.
A potential contrarian bottom signal—but addresses aren’t individual investors. Transfers and consolidation also affect the count.
💵 4️⃣ MACRO SUPPORT
High U.S. debt and persistent deficits strengthen the long-term case for a scarce asset.
This thesis plays out over years, not days.
⚠️ HISTORY ISN’T A PROMISE
October was positive in 10 of 13 years from 2013–2025. Yet October 2025 lost 3.95%.
Seasonality won’t save a weak trade.
👀 THE MARKET FILE’S TEST
• Hold $80K and reclaim ~$82.5K: stronger bottom case.
• Sustained break below $79K: weaker case.
These are conditions, not guaranteed floors or targets.
📖 MY READ:
A bullish thesis needs to explain what would prove it wrong.
💬 Accumulation—or a bullish story to justify falling prices?
Name ONE signal that would change your mind.
$BTC
{future}(BTCUSDT)
#bitcoin #BTCanalysis #CryptoMarket #BitcoinSlipsBelow$80KAgain
🚨 Bitcoin is heading for a red October.
Our thesis: the bear-market bottom is behind us.
Are sellers exhausted—or are bulls ignoring a weak chart?
THE MARKET FILE — RED MONTH, BULLISH THESIS
October 27, 2026
BTC is down roughly 4.1% this month. October hasn’t closed yet.
Four arguments support the bullish case. Each has limits. 👇
📊 1️⃣ LONG-TERM STRUCTURE
BTC reclaimed its 50-week moving average after 44 weeks below it, then posted five weekly closes above it through October 18.
Four comparable historical cases support the thesis—but remain a small sample.
🏦 2️⃣ POSITIONING RESET
Asset managers’ net long exposure in CME BTC futures fell 57% from the all-time-high week.
U.S. spot ETFs added about 87,000 BTC from the June low through the report’s cutoff.
Demand persisted as speculative positions unwound. That doesn’t prove selling is over.
👥 3️⃣ POSSIBLE CAPITULATION
Roughly 30,000 fewer addresses held BTC balances since October 16.
A potential contrarian bottom signal—but addresses aren’t individual investors. Transfers and consolidation also affect the count.
💵 4️⃣ MACRO SUPPORT
High U.S. debt and persistent deficits strengthen the long-term case for a scarce asset.
This thesis plays out over years, not days.
⚠️ HISTORY ISN’T A PROMISE
October was positive in 10 of 13 years from 2013–2025. Yet October 2025 lost 3.95%.
Seasonality won’t save a weak trade.
👀 THE MARKET FILE’S TEST
• Hold $80K and reclaim ~$82.5K: stronger bottom case.
• Sustained break below $79K: weaker case.
These are conditions, not guaranteed floors or targets.
📖 MY READ:
A bullish thesis needs to explain what would prove it wrong.
💬 Accumulation—or a bullish story to justify falling prices?
Name ONE signal that would change your mind.
$BTC
#bitcoin #BTCanalysis #CryptoMarket #BitcoinSlipsBelow$80KAgain
ABO3ZAM:
تحليلك واقعي، السوق حالياً يختبر صبرنا عند الـ 79 ألف، كسرها يعني بنشوف سيولة تطلع من السوق والوضع بيصير حرج. ننتظر إغلاق الشمعة ونشوف الوضع 🤝
2
2
1k
See translation
**BTC Stuck at the $80k Ceiling 🚧📉**
Bitcoin is consolidating right below the $80,000 psychological barrier, trading at $79,890 after a week‑long mild correction. Sell‑side liquidity is stacked above the price—strong clusters sit at $80,000‑$80,300 and $81,000‑$81,200, acting as immediate resistance.
Derivatives data tells a cautionary story: a positive funding rate of 0.0100% and a lofty Long/Short ratio of 1.98 signal heavy leveraged longs, raising the odds of a short‑term Long Squeeze. On‑chain, the net outflow of –15.2 K BTC points to accumulation, yet the order flow shows aggressive selling around $79,900, reinforcing short pressure.
Technical cues add nuance. RSI sits at 39, indicating weakness, while the Fear & Greed Index is neutral at 44—no panic, but also no bullish optimism. Volume is modestly above average, and the price is trapped between sell pressure at $80,000 and buy walls near $79,500.
Whale activity suggests a 65 % chance of an orchestrated move in the next 24 hours, likely aimed at draining liquidity below the current level to force long liquidations before any deeper accumulation. Silent accumulation appears probable, while spoofing looks unlikely.
**Verdict:** The most probable short‑term path is a dip to hunt liquidity, with $80,300 as the invalidation point. Caution is advised; wait for a clearer retest of lower support (around $79,200‑$79,000) before considering a long entry. The $80k barrier remains a tough ceiling—will the market break through or slide lower?
#Bitcoin #CryptoTrading #LongSqueeze #BTCAnalysis
66

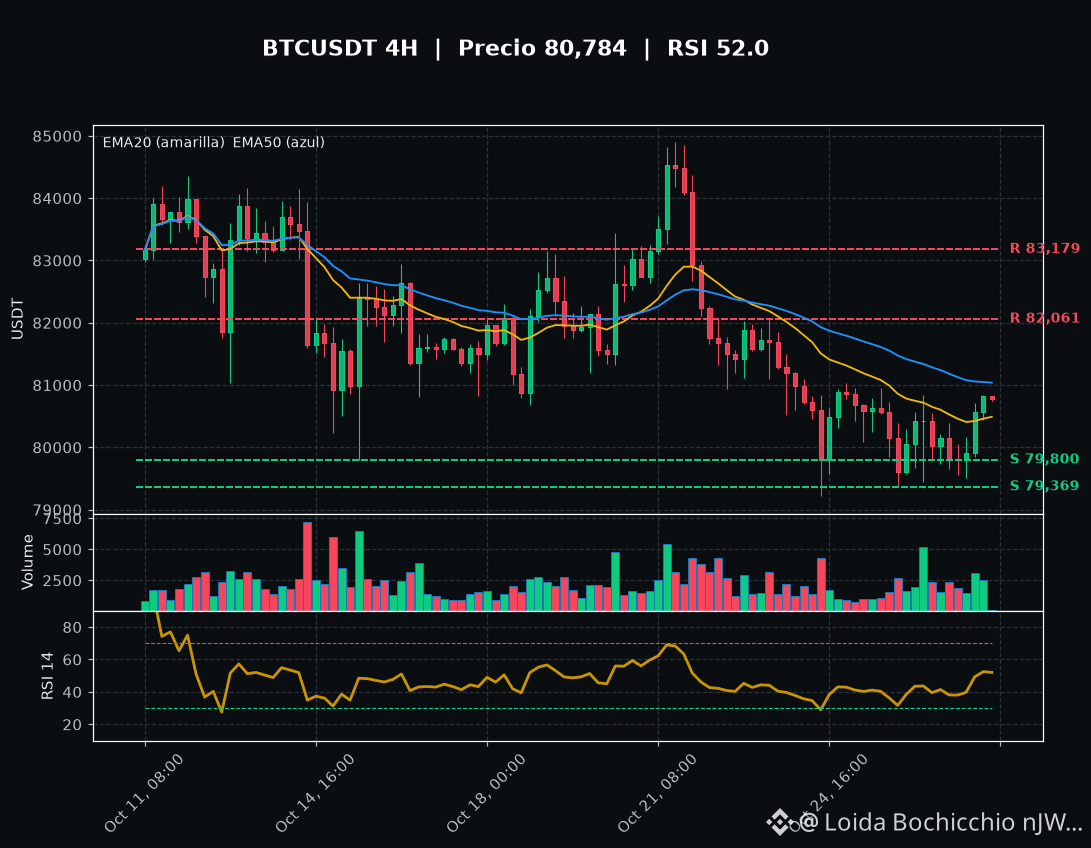
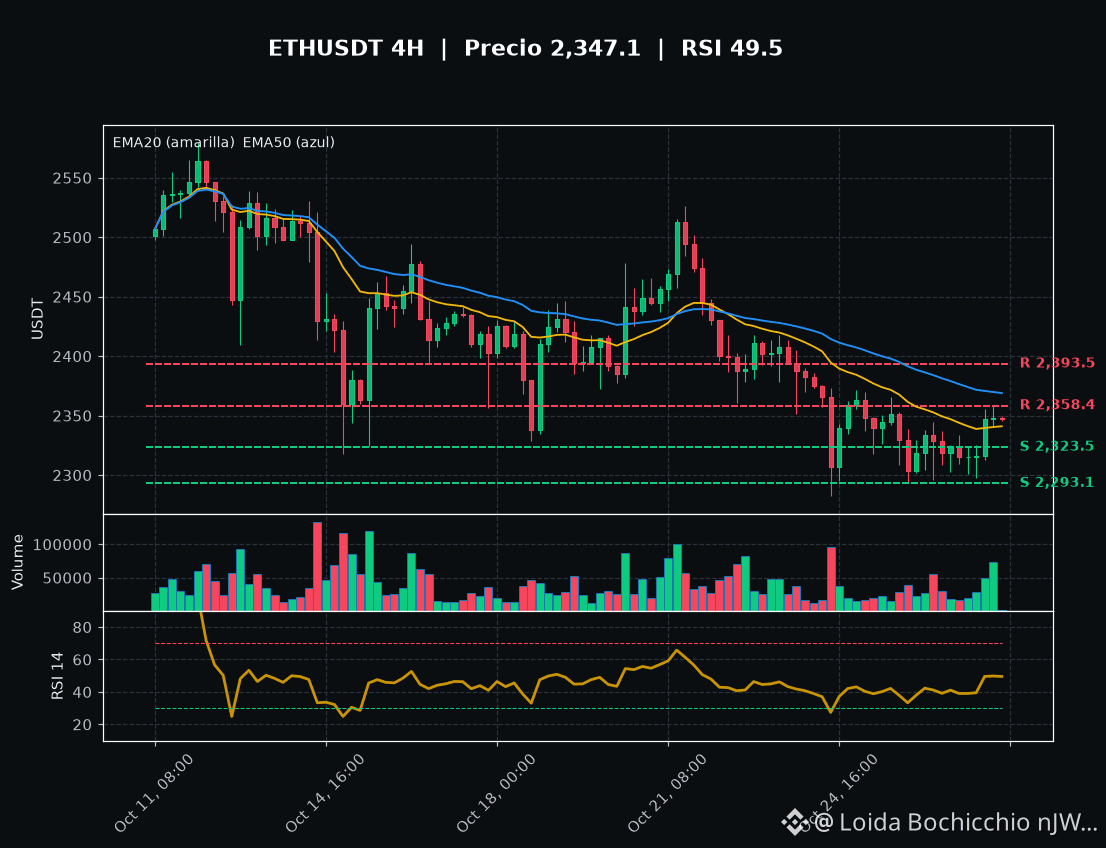
⚡ $BTC is hugging the EMA50 and the RSI crosses 50... is a breakout coming? $ETH is also waking up at 2,347 👀
📊 $BTC (4H) | 80,784
• It has already cleared the EMA20 (~80.5K), and is now hitting the EMA50 (~81.04K), the key wall 🧱
• Resistances: 82,061 and 83,179 🔴
• Supports: 79,800 and 79,369 🟢
• RSI 52: back in bullish territory for the first time in days 💪
🐂 A 4H close above 81K opens the way to 82K, then 83.1K
🐻 If it gets rejected, a retest of 79,800 is on the table
📊 $ETH (4H) | 2,347
• Above the EMA20 (~2,341), the EMA50 (~2,369) is the ceiling to break 🌡️
• Resistances: 2,358 and 2,393 🔴
• Supports: 2,323 and 2,293 🟢
• RSI 49.5: neutral, but trending upward 📈
🐂 Breaking 2,358 puts 2,393 in sight
🐻 Losing 2,323 sends us back to 2,293
Wall Street's close is in sight... breakout or bounce? Let me know 👇
#BTC #ETH #Bitcoin #Ethereum #Crypto #BinanceSquare #CryptoMarket #MarketUpdate #BTCAnalysis
Not financial advice (NFA)
64

See translation
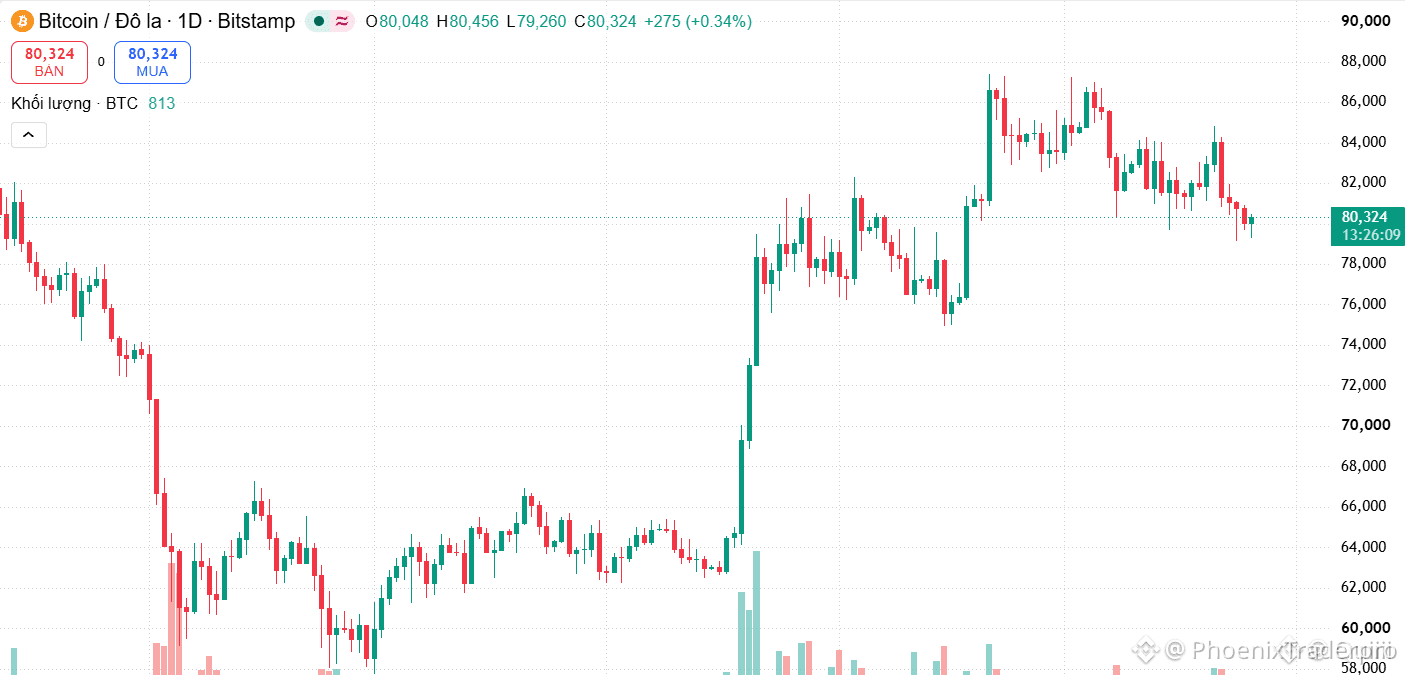
🚨 $BTC EYES $75K STRONG SUPPORT IF $79K BREAKS 🟢
📊 Liquidity hunters are already eyeing the $79K barrier; a breach could hand the market to the whales.
If the price slips under, the order block at $75K forms a deep demand pocket that has repeatedly absorbed sell pressure and sparked quick rebounds. 🦈 The 4‑hour volume profile shows a growing imbalance favoring buyers at that level.
Watch the $71K floor as a secondary safety net; a dip below could trigger a cascade of stop‑losses and a fresh liquidity sweep. 🌊 💬 Are you positioning for a rebound at $75K or waiting for the next liquidity dump? 👇
⚠️ Not financial advice. Always manage your risk. 🛡️
🏷️ #BTC #SupportLevels #Crypto #BTCAnalysis
🔥 💎
2

·
--
See translation
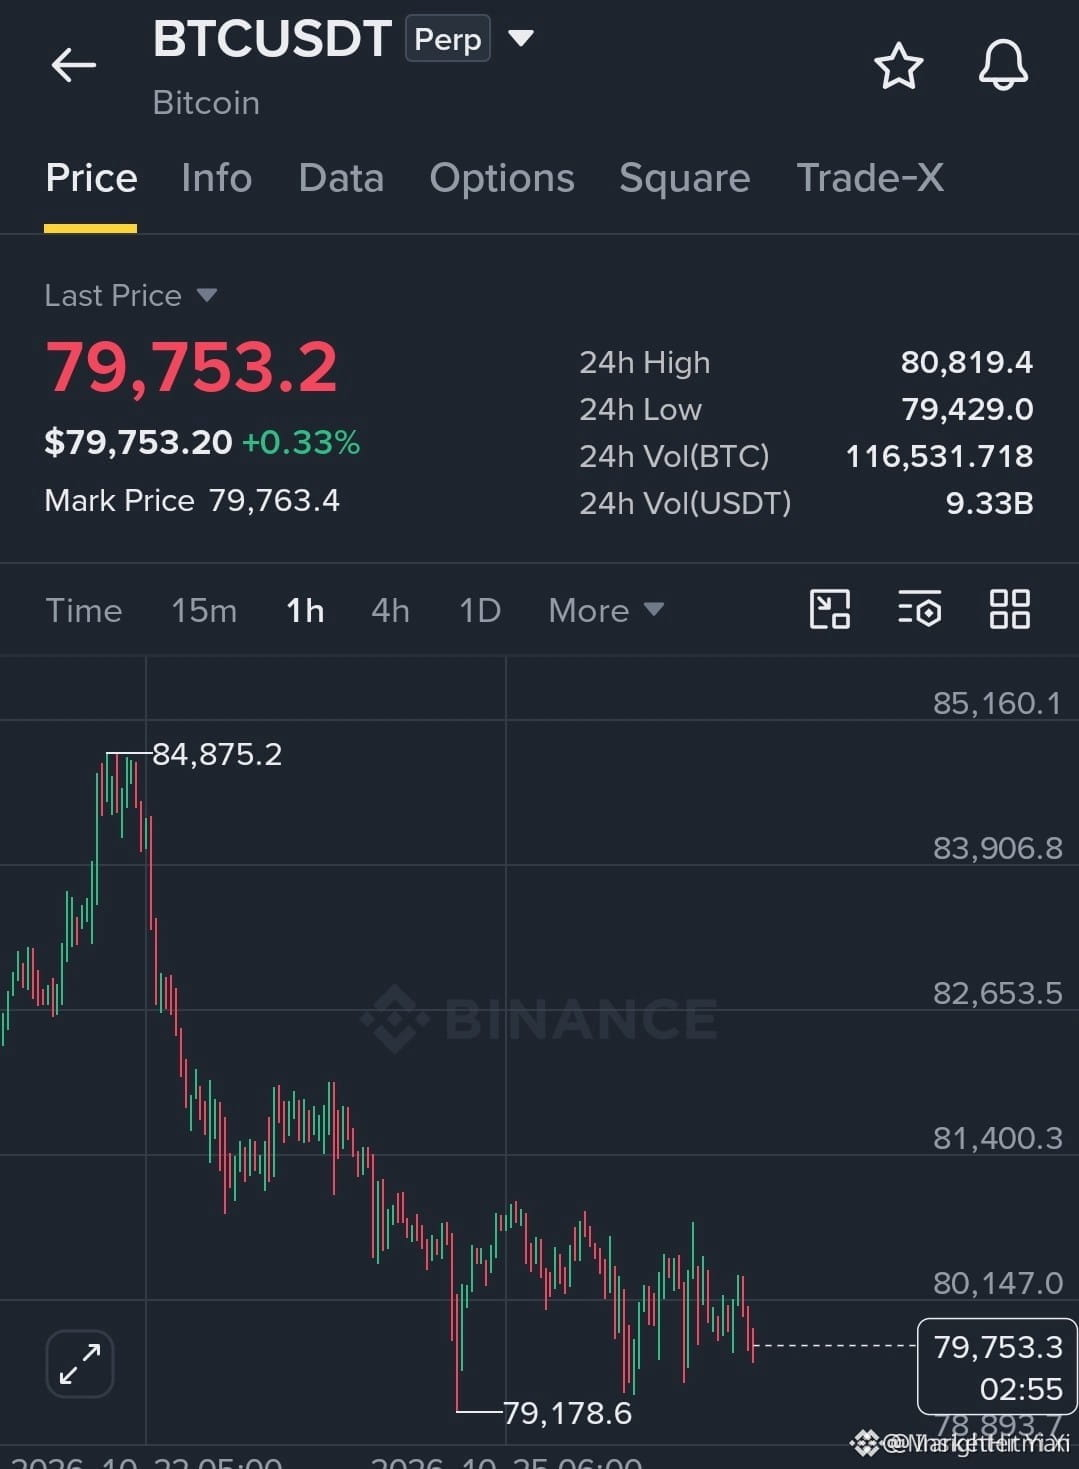
🚨 $BTC APPROACHING CRITICAL $79K THRESHOLD – WILL SELLERS HOLD? 🟢
Entry: 78,850–79,000 ⚡
Target: 78,500 🚀
Stop Loss: 79,600 ⚠️
📊 The order flow shows a tightening demand wall around $79,200, with smart money quietly absorbing sell pressure. ⚡ A decisive break below $79K could trigger a liquidity sweep, flipping the market into a short cascade. 🌊 Watch the retest – if price bounces off the $78,893 support cluster, the bearish narrative fizzles. 📌 Keep an eye on volume spikes as the next catalyst.
💬 Do you see the short window opening if $79K cracks, or will the bulls defend the zone? 👇
⚠️ Not financial advice. Always manage your risk. 🛡️
🏷️ #BTC #ShortSetup #Crypto #BTCAnalysis
🔥 💎
56
·
--
See translation
🚨 BITCOIN LONGS UNDER PRESSURE — WILL BTC BOUNCE OR BREAK LOWER? 🔻
🔴 BTC Liquidated Long: $79.3K at $79,630
Bitcoin traders just witnessed another painful shakeout as $79,300 in long positions were liquidated around the $79,630 price level. This signals that leveraged bullish traders are facing pressure, putting short-term market sentiment under the spotlight.
📊 What This Means
🔻 Bearish pressure: Long liquidations can reflect downside momentum and forced position closures.
⚡ Volatility alert: BTC could make a sharp move as traders reposition.
🎯 Critical zone: Watch how Bitcoin reacts around $79,630 and whether buyers can defend nearby support.
🔮 NEXT MOVE — MY MARKET OUTLOOK
🐻 Bearish scenario: If BTC loses nearby support and selling volume increases, another leg down could follow.
🐂 Bullish recovery: If buyers reclaim $79,630 and hold above it, a relief bounce may develop.
🎯 Signal-provider view: Avoid chasing the first move. Wait for confirmation through price action, volume, and support/resistance reactions before considering an entry.
⚠️ Liquidation data alone does not confirm the next direction. Manage leverage carefully and always use risk management.
#BTC #Bitcoin #CryptoTrading #BTCAnalysis #Liquidations #CryptoSignals #MarketOutlook
#SouthKoreaConsidersEducationTaxOnCryptoExchanges #OCCUrgesCommunityBanksToEnterStablecoinPayments #RippleWinsFullApprovalAsNationalTrustBank
{spot}(BTCUSDT)
🚨 BITCOIN LONGS UNDER PRESSURE — WILL BTC BOUNCE OR BREAK LOWER? 🔻
🔴 BTC Liquidated Long: $79.3K at $79,630
Bitcoin traders just witnessed another painful shakeout as $79,300 in long positions were liquidated around the $79,630 price level. This signals that leveraged bullish traders are facing pressure, putting short-term market sentiment under the spotlight.
📊 What This Means
🔻 Bearish pressure: Long liquidations can reflect downside momentum and forced position closures.
⚡ Volatility alert: BTC could make a sharp move as traders reposition.
🎯 Critical zone: Watch how Bitcoin reacts around $79,630 and whether buyers can defend nearby support.
🔮 NEXT MOVE — MY MARKET OUTLOOK
🐻 Bearish scenario: If BTC loses nearby support and selling volume increases, another leg down could follow.
🐂 Bullish recovery: If buyers reclaim $79,630 and hold above it, a relief bounce may develop.
🎯 Signal-provider view: Avoid chasing the first move. Wait for confirmation through price action, volume, and support/resistance reactions before considering an entry.
⚠️ Liquidation data alone does not confirm the next direction. Manage leverage carefully and always use risk management.
#BTC #Bitcoin #CryptoTrading #BTCAnalysis #Liquidations #CryptoSignals #MarketOutlook
#SouthKoreaConsidersEducationTaxOnCryptoExchanges #OCCUrgesCommunityBanksToEnterStablecoinPayments #RippleWinsFullApprovalAsNationalTrustBank
66
Log in to explore more content
Join global crypto users on Binance Square
⚡️ Get latest and useful information about crypto.
💬 Trusted by the world’s largest crypto exchange.
👍 Discover real insights from verified creators.
Email / Phone number
Trending Topics
1
#BinanceToResumePhaseOneOfWithdrawals
5,962 views
306 Discussing
2
#BinanceHadAlreadyCovered$6BofHackLoss
1,464 views
45 Discussing
3
#FBIConfirmsNorthKoreaIsResponsibleForBinanceCryptoHack
8,629 views
55 Discussing
4
#BinanceSAFUFundTransferCompleted7499BTC
73,829 views
1,290 Discussing
5
#CZDismissesClaimsBinanceHackWasPredicted
1,429 views
79 Discussing
6
#BinanceRecovery90% of stolen assets
203,016 views
220 Discussing
7
#YiHe:ProofOfReserves:10TokensAt100%Backing
181,226 views
1,095 Discussing
8
#BackedNotBroken:RichardTengSaysUsersBearNoLoss
63,548 views
679 Discussing
9
#B14gReportsUnauthorizedTransferOfAbout97MCORE
4,331 views
124 Discussing
10
#USSpotETHETFsPost23StraightDaysOfNetOutflows
5,069 views
115 Discussing