
#sp500
sp500
727,334 views
2,437 Discussing
Hot
Latest

See translation
🚨 WALL STREET FACES A CRITICAL MONDAY. HISTORY SAYS THE NEXT MOVE COULD GO EITHER WAY.
The global AI selloff has wiped out more than $9 TRILLION from world stocks since August.
The S&P 500 has lost $6 TRILLION in market value in just 5 trading days.
Now all eyes are on Monday's opening bell.
But here's what history tells us:
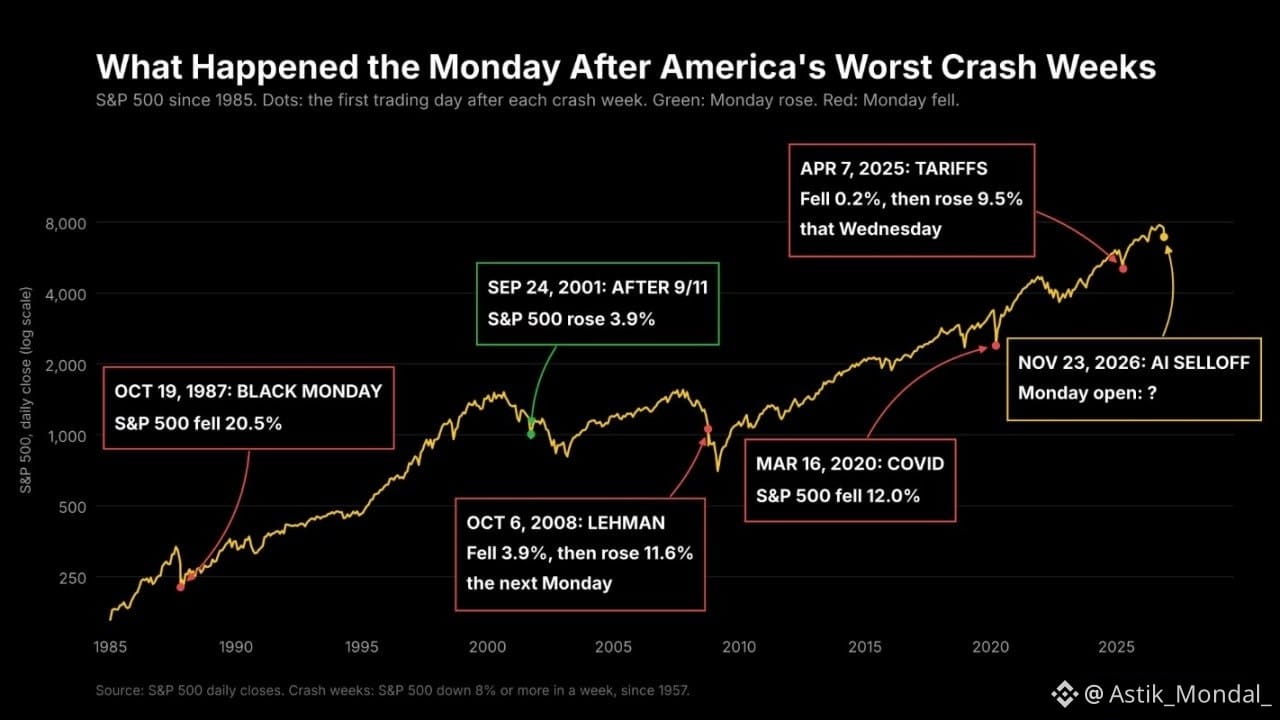
After some of America's worst crash weeks, the following Monday delivered completely different outcomes.
📉 October 1987 (Black Monday): S&P 500 plunged 20.5%.
🟢 September 2001 (After 9/11): S&P 500 rebounded 3.9%.
📉 October 2008 (Lehman Crisis): Fell 3.9%, then surged 11.6% the following Monday.
📉 March 2020 (COVID Crash): S&P 500 dropped 12.0%.
⚡ April 2025 (Tariff Shock): Fell just 0.2%, then rallied 9.5% that Wednesday.
But there's an even more interesting historical pattern.
Since 1957, the S&P 500 experienced 12 other weeks with similarly severe declines.
The following Monday?
6 times UP. 6 times DOWN.
However, one month later, the market was higher in 8 out of those 12 cases.
Here's where markets stand heading into Monday:
🔻 S&P 500: -8.6%
🔻 Nasdaq 100: -10.4%
🔻 Semiconductor stocks: -17.1%
🟢 Bitcoin: Back above $60,000.
The key question isn't whether markets will bounce. It's whether the AI selloff has finally found buyers or whether another wave of forced selling is coming.
Monday's opening could set the tone for the entire week.
Watch liquidity, institutional positioning, semiconductor stocks, and Bitcoin closely.
History doesn't guarantee a recovery. But it shows why panic and opportunity can exist at the same time.
#StockMarket #SP500 #Nasdaq #Bitcoin #AI
🚨 WALL STREET FACES A CRITICAL MONDAY. HISTORY SAYS THE NEXT MOVE COULD GO EITHER WAY.
The global AI selloff has wiped out more than $9 TRILLION from world stocks since August.
The S&P 500 has lost $6 TRILLION in market value in just 5 trading days.
Now all eyes are on Monday's opening bell.
But here's what history tells us:
After some of America's worst crash weeks, the following Monday delivered completely different outcomes.
📉 October 1987 (Black Monday): S&P 500 plunged 20.5%.
🟢 September 2001 (After 9/11): S&P 500 rebounded 3.9%.
📉 October 2008 (Lehman Crisis): Fell 3.9%, then surged 11.6% the following Monday.
📉 March 2020 (COVID Crash): S&P 500 dropped 12.0%.
⚡ April 2025 (Tariff Shock): Fell just 0.2%, then rallied 9.5% that Wednesday.
But there's an even more interesting historical pattern.
Since 1957, the S&P 500 experienced 12 other weeks with similarly severe declines.
The following Monday?
6 times UP. 6 times DOWN.
However, one month later, the market was higher in 8 out of those 12 cases.
Here's where markets stand heading into Monday:
🔻 S&P 500: -8.6%
🔻 Nasdaq 100: -10.4%
🔻 Semiconductor stocks: -17.1%
🟢 Bitcoin: Back above $60,000.
The key question isn't whether markets will bounce. It's whether the AI selloff has finally found buyers or whether another wave of forced selling is coming.
Monday's opening could set the tone for the entire week.
Watch liquidity, institutional positioning, semiconductor stocks, and Bitcoin closely.
History doesn't guarantee a recovery. But it shows why panic and opportunity can exist at the same time.
#StockMarket #SP500 #Nasdaq #Bitcoin #AI
The global AI selloff has wiped out more than $9 TRILLION from world stocks since August.
The S&P 500 has lost $6 TRILLION in market value in just 5 trading days.
Now all eyes are on Monday's opening bell.
But here's what history tells us:
After some of America's worst crash weeks, the following Monday delivered completely different outcomes.
📉 October 1987 (Black Monday): S&P 500 plunged 20.5%.
🟢 September 2001 (After 9/11): S&P 500 rebounded 3.9%.
📉 October 2008 (Lehman Crisis): Fell 3.9%, then surged 11.6% the following Monday.
📉 March 2020 (COVID Crash): S&P 500 dropped 12.0%.
⚡ April 2025 (Tariff Shock): Fell just 0.2%, then rallied 9.5% that Wednesday.
But there's an even more interesting historical pattern.
Since 1957, the S&P 500 experienced 12 other weeks with similarly severe declines.
The following Monday?
6 times UP. 6 times DOWN.
However, one month later, the market was higher in 8 out of those 12 cases.
Here's where markets stand heading into Monday:
🔻 S&P 500: -8.6%
🔻 Nasdaq 100: -10.4%
🔻 Semiconductor stocks: -17.1%
🟢 Bitcoin: Back above $60,000.
The key question isn't whether markets will bounce. It's whether the AI selloff has finally found buyers or whether another wave of forced selling is coming.
Monday's opening could set the tone for the entire week.
Watch liquidity, institutional positioning, semiconductor stocks, and Bitcoin closely.
History doesn't guarantee a recovery. But it shows why panic and opportunity can exist at the same time.
#StockMarket #SP500 #Nasdaq #Bitcoin #AI
3
190

·
--
Article
See translation
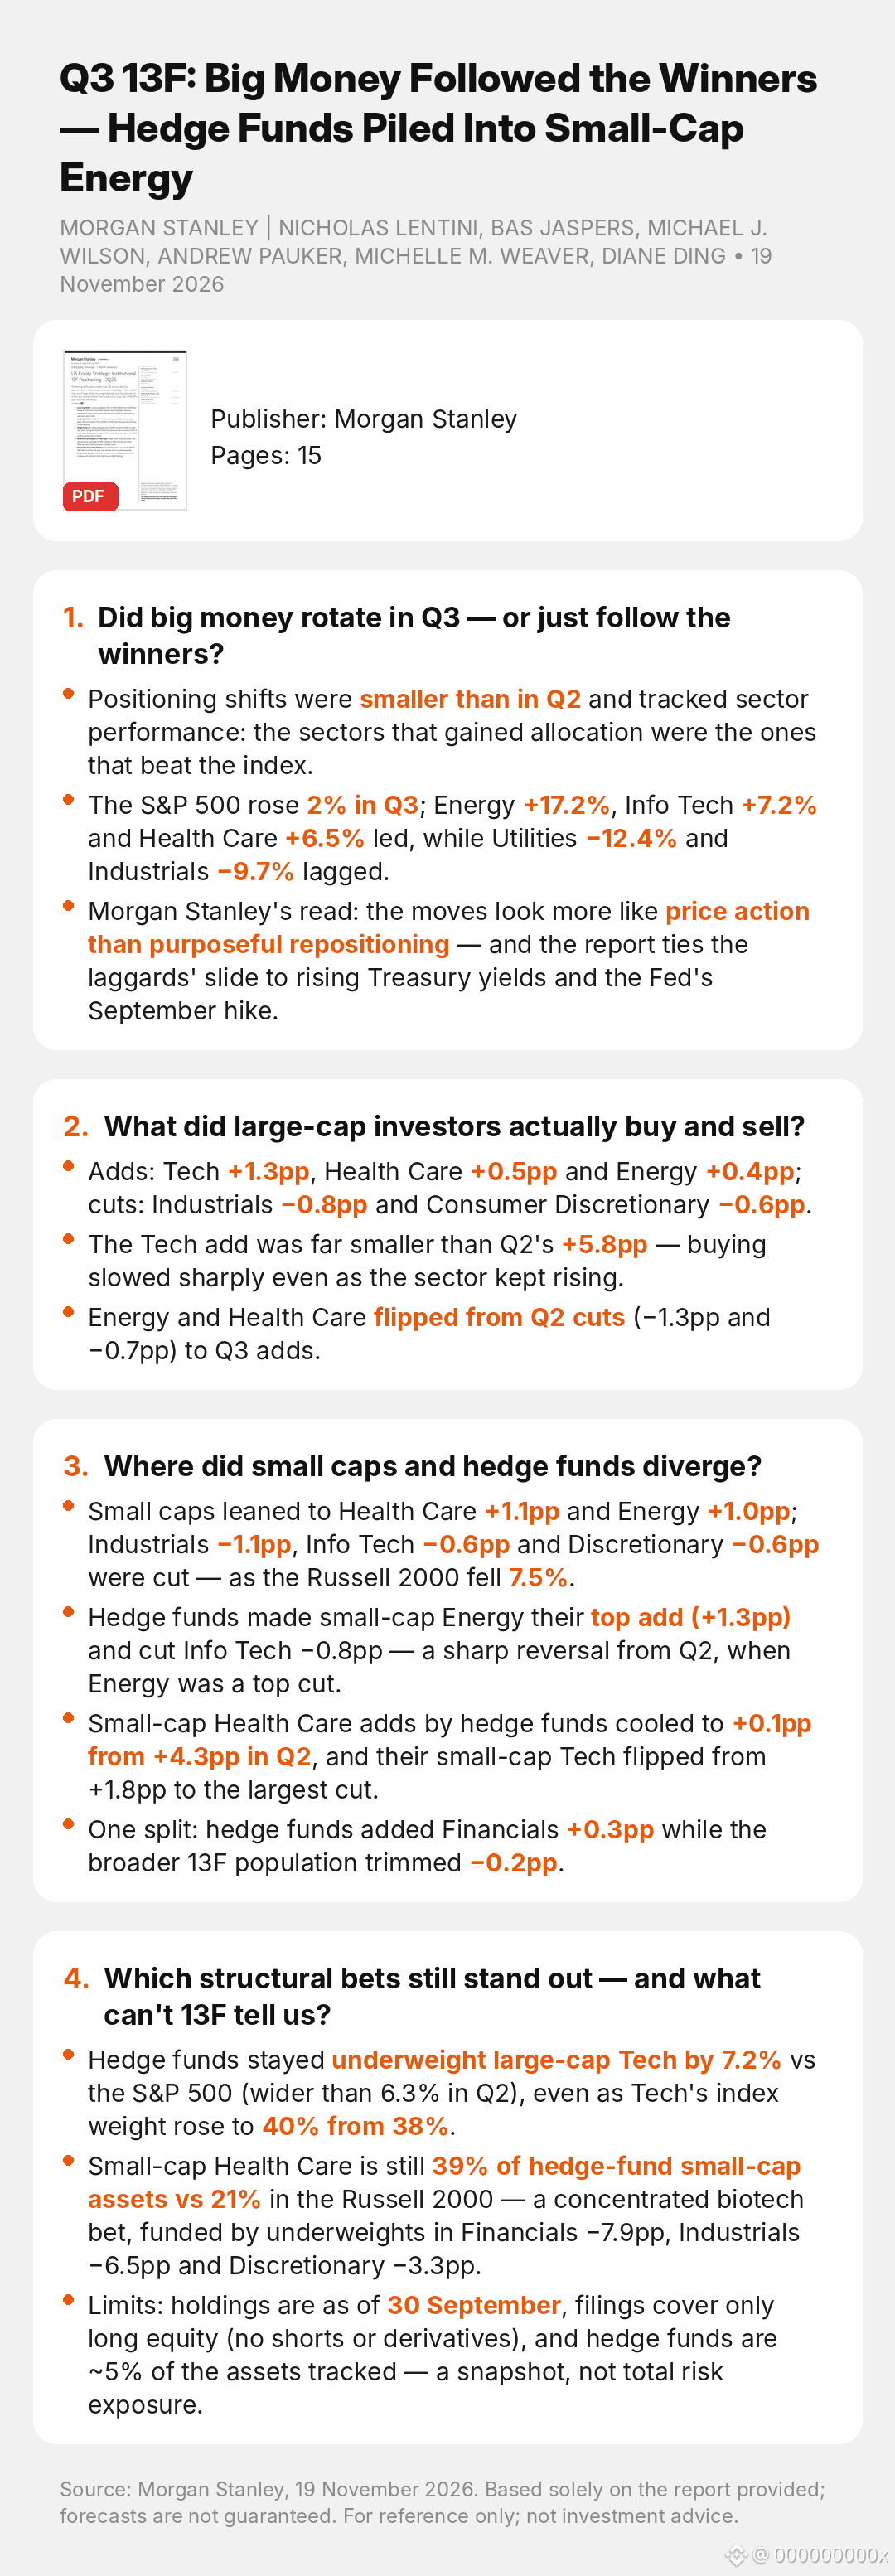
Q3 13F: Big Money Followed the Winners — Hedge Funds Piled Into Small-Cap EnergyQ3 13F: Big Money Followed the Winners — Hedge Funds Piled Into Small-Cap Energy
$SPX $BTC
After Friday's broad selloff, here is what the big money was actually holding at the end of Q3:
Source: Morgan Stanley | Nicholas Lentini, Bas Jaspers, Michael J. Wilson, Andrew Pauker, Michelle M. Weaver, Diane Ding • 19 November 2026
1. Did big money rotate in Q3 — or just follow the winners?
• Positioning shifts were smaller than in Q2 and tracked sector performance: the sectors that gained allocation were the ones that beat the index.
• The S&P 500 rose 2% in Q3; Energy +17.2%, Info Tech +7.2% and Health Care +6.5% led, while Utilities −12.4% and Industrials −9.7% lagged.
• Morgan Stanley's read: the moves look more like price action than purposeful repositioning — and the report ties the laggards' slide to rising Treasury yields and the Fed's September hike.
2. What did large-cap investors actually buy and sell?
• Adds: Tech +1.3pp, Health Care +0.5pp and Energy +0.4pp; cuts: Industrials −0.8pp and Consumer Discretionary −0.6pp.
• The Tech add was far smaller than Q2's +5.8pp — buying slowed sharply even as the sector kept rising.
• Energy and Health Care flipped from Q2 cuts (−1.3pp and −0.7pp) to Q3 adds.
3. Where did small caps and hedge funds diverge?
• Small caps leaned to Health Care +1.1pp and Energy +1.0pp; Industrials −1.1pp, Info Tech −0.6pp and Discretionary −0.6pp were cut — as the Russell 2000 fell 7.5%.
• Hedge funds made small-cap Energy their top add (+1.3pp) and cut Info Tech −0.8pp — a sharp reversal from Q2, when Energy was a top cut.
• Small-cap Health Care adds by hedge funds cooled to +0.1pp from +4.3pp in Q2, and their small-cap Tech flipped from +1.8pp to the largest cut.
• One split: hedge funds added Financials +0.3pp while the broader 13F population trimmed −0.2pp.
4. Which structural bets still stand out — and what can't 13F tell us?
• Hedge funds stayed underweight large-cap Tech by 7.2% vs the S&P 500 (wider than 6.3% in Q2), even as Tech's index weight rose to 40% from 38%.
• Small-cap Health Care is still 39% of hedge-fund small-cap assets vs 21% in the Russell 2000 — a concentrated biotech bet, funded by underweights in Financials −7.9pp, Industrials −6.5pp and Discretionary −3.3pp.
• Limits: holdings are as of 30 September, filings cover only long equity (no shorts or derivatives), and hedge funds are ~5% of the assets tracked — a snapshot, not total risk exposure.
#SP500 #13F #HedgeFunds #Energy #SmallCaps
Source: Morgan Stanley, "US Equity Strategy: Institutional 13F Positioning — 3Q26", 19 November 2026. Holdings as of 30 September 2026. For reference only; not investment advice.
Read the full breakdown on Unhidea: https://unhidea.com/en/articles/research-08f88aea5bab40b4857854422a56126a-en
Visit unhidea.com for more of the latest sell-side research interpretations.
Q3 13F: Big Money Followed the Winners — Hedge Funds Piled Into Small-Cap Energy
Q3 13F: Big Money Followed the Winners — Hedge Funds Piled Into Small-Cap Energy
$SPX $BTC
After Friday's broad selloff, here is what the big money was actually holding at the end of Q3:
Source: Morgan Stanley | Nicholas Lentini, Bas Jaspers, Michael J. Wilson, Andrew Pauker, Michelle M. Weaver, Diane Ding • 19 November 2026
1. Did big money rotate in Q3 — or just follow the winners?
• Positioning shifts were smaller than in Q2 and tracked sector performance: the sectors that gained allocation were the ones that beat the index.
• The S&P 500 rose 2% in Q3; Energy +17.2%, Info Tech +7.2% and Health Care +6.5% led, while Utilities −12.4% and Industrials −9.7% lagged.
• Morgan Stanley's read: the moves look more like price action than purposeful repositioning — and the report ties the laggards' slide to rising Treasury yields and the Fed's September hike.
2. What did large-cap investors actually buy and sell?
• Adds: Tech +1.3pp, Health Care +0.5pp and Energy +0.4pp; cuts: Industrials −0.8pp and Consumer Discretionary −0.6pp.
• The Tech add was far smaller than Q2's +5.8pp — buying slowed sharply even as the sector kept rising.
• Energy and Health Care flipped from Q2 cuts (−1.3pp and −0.7pp) to Q3 adds.
3. Where did small caps and hedge funds diverge?
• Small caps leaned to Health Care +1.1pp and Energy +1.0pp; Industrials −1.1pp, Info Tech −0.6pp and Discretionary −0.6pp were cut — as the Russell 2000 fell 7.5%.
• Hedge funds made small-cap Energy their top add (+1.3pp) and cut Info Tech −0.8pp — a sharp reversal from Q2, when Energy was a top cut.
• Small-cap Health Care adds by hedge funds cooled to +0.1pp from +4.3pp in Q2, and their small-cap Tech flipped from +1.8pp to the largest cut.
• One split: hedge funds added Financials +0.3pp while the broader 13F population trimmed −0.2pp.
4. Which structural bets still stand out — and what can't 13F tell us?
• Hedge funds stayed underweight large-cap Tech by 7.2% vs the S&P 500 (wider than 6.3% in Q2), even as Tech's index weight rose to 40% from 38%.
• Small-cap Health Care is still 39% of hedge-fund small-cap assets vs 21% in the Russell 2000 — a concentrated biotech bet, funded by underweights in Financials −7.9pp, Industrials −6.5pp and Discretionary −3.3pp.
• Limits: holdings are as of 30 September, filings cover only long equity (no shorts or derivatives), and hedge funds are ~5% of the assets tracked — a snapshot, not total risk exposure.
#SP500 #13F #HedgeFunds #Energy #SmallCaps
Source: Morgan Stanley, "US Equity Strategy: Institutional 13F Positioning — 3Q26", 19 November 2026. Holdings as of 30 September 2026. For reference only; not investment advice.
Read the full breakdown on Unhidea: https://unhidea.com/en/articles/research-08f88aea5bab40b4857854422a56126a-en
Visit unhidea.com for more of the latest sell-side research interpretations.
$SPX $BTC
After Friday's broad selloff, here is what the big money was actually holding at the end of Q3:
Source: Morgan Stanley | Nicholas Lentini, Bas Jaspers, Michael J. Wilson, Andrew Pauker, Michelle M. Weaver, Diane Ding • 19 November 2026
1. Did big money rotate in Q3 — or just follow the winners?
• Positioning shifts were smaller than in Q2 and tracked sector performance: the sectors that gained allocation were the ones that beat the index.
• The S&P 500 rose 2% in Q3; Energy +17.2%, Info Tech +7.2% and Health Care +6.5% led, while Utilities −12.4% and Industrials −9.7% lagged.
• Morgan Stanley's read: the moves look more like price action than purposeful repositioning — and the report ties the laggards' slide to rising Treasury yields and the Fed's September hike.
2. What did large-cap investors actually buy and sell?
• Adds: Tech +1.3pp, Health Care +0.5pp and Energy +0.4pp; cuts: Industrials −0.8pp and Consumer Discretionary −0.6pp.
• The Tech add was far smaller than Q2's +5.8pp — buying slowed sharply even as the sector kept rising.
• Energy and Health Care flipped from Q2 cuts (−1.3pp and −0.7pp) to Q3 adds.
3. Where did small caps and hedge funds diverge?
• Small caps leaned to Health Care +1.1pp and Energy +1.0pp; Industrials −1.1pp, Info Tech −0.6pp and Discretionary −0.6pp were cut — as the Russell 2000 fell 7.5%.
• Hedge funds made small-cap Energy their top add (+1.3pp) and cut Info Tech −0.8pp — a sharp reversal from Q2, when Energy was a top cut.
• Small-cap Health Care adds by hedge funds cooled to +0.1pp from +4.3pp in Q2, and their small-cap Tech flipped from +1.8pp to the largest cut.
• One split: hedge funds added Financials +0.3pp while the broader 13F population trimmed −0.2pp.
4. Which structural bets still stand out — and what can't 13F tell us?
• Hedge funds stayed underweight large-cap Tech by 7.2% vs the S&P 500 (wider than 6.3% in Q2), even as Tech's index weight rose to 40% from 38%.
• Small-cap Health Care is still 39% of hedge-fund small-cap assets vs 21% in the Russell 2000 — a concentrated biotech bet, funded by underweights in Financials −7.9pp, Industrials −6.5pp and Discretionary −3.3pp.
• Limits: holdings are as of 30 September, filings cover only long equity (no shorts or derivatives), and hedge funds are ~5% of the assets tracked — a snapshot, not total risk exposure.
#SP500 #13F #HedgeFunds #Energy #SmallCaps
Source: Morgan Stanley, "US Equity Strategy: Institutional 13F Positioning — 3Q26", 19 November 2026. Holdings as of 30 September 2026. For reference only; not investment advice.
Read the full breakdown on Unhidea: https://unhidea.com/en/articles/research-08f88aea5bab40b4857854422a56126a-en
Visit unhidea.com for more of the latest sell-side research interpretations.
91

Article
See translation
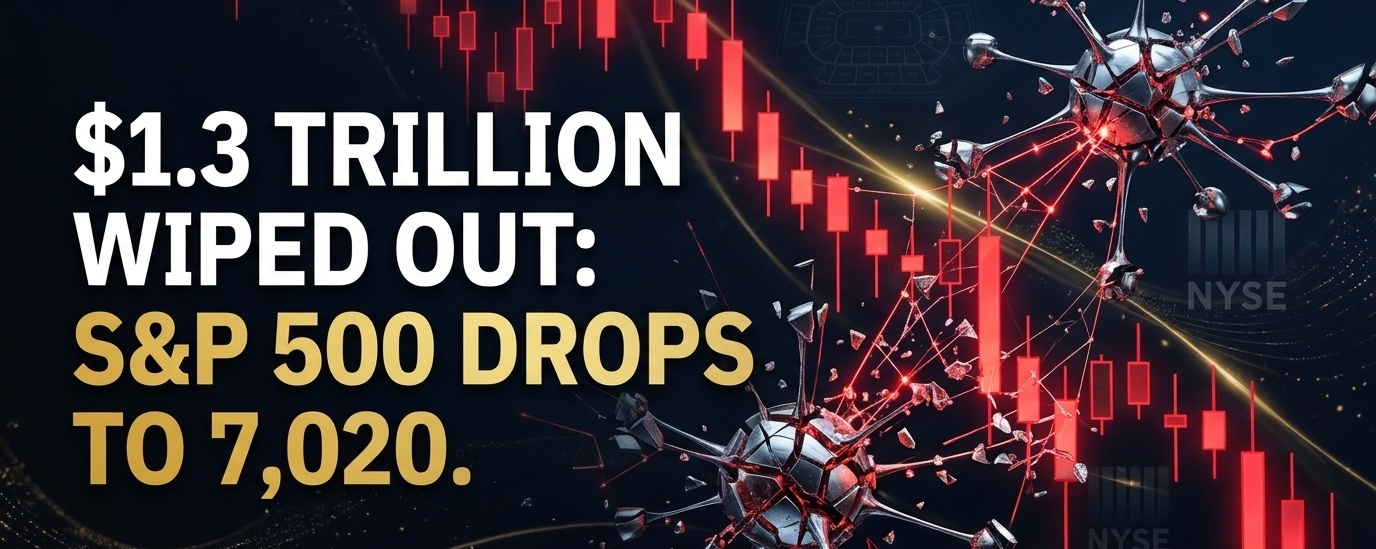
$1.3 Trillion Wiped Out as S&P 500 Drops to 7,020: Why Anthropic’s Historic IPO Couldn't Save the AIWall Street just suffered another brutal session as the S&P 500 tumbled toward 7,020, erasing more than $1.3 trillion in market value in a single day. Rather than sparking a fresh wave of tech optimism, the record-breaking public debut of AI giant Anthropic failed to calm growing investor anxiety around artificial intelligence valuations, triggering a sharp selloff across equities and spillover volatility in crypto.
The IPO That Didn't Spark a Turnaround
Anthropic’s Nasdaq listing under the ticker ANT was supposed to be a major catalyst for the AI sector. Priced at $83 per share to raise roughly $81.3 billion—making it the largest IPO in market history—the stock initially surged past $111 on its opening day.
However, that momentum quickly faded. Shares pulled back sharply in follow-up trading, sliding toward the mid-$80s and dragging major semiconductor and big-tech names down with them. Instead of bringing new sidelined cash into the market, the mega-listing acted as a liquidity vacuum—prompting institutional funds to sell existing tech holdings to rebalance their portfolios.
3 Forces Driving the $1.3 Trillion Selloff
AI Valuation Fatigue & CapEx Scrutiny: After massive multi-year rallies, Wall Street is questioning whether heavy spending on AI data centers and infrastructure will deliver near-term profits fast enough to justify stretched tech multiples. Chipmakers like Nvidia, AMD, and Broadcom led the broader market lower as traders locked in gains.Portfolio Rebalancing Around Mega-Listings: Absorbing an $80B+ public offering requires massive capital. Rather than deploying fresh leverage, asset managers trimmed exposure across high-beta tech stocks to free up cash.Macro & Interest Rate Headwinds: Stubborn inflation readings and hawkish signals from Federal Reserve officials have pushed traders to price in tighter monetary policy, putting extra pressure on growth stocks and risk assets across the board.
What This Means for Crypto Traders
When traditional equity indices lose over a trillion dollars in a single day, digital assets rarely escape the crossfire. Institutional desks treat $BTC and major altcoins (ETH, SOL) as high-beta liquidity vehicles during broad risk-off events.
As tech stocks tumble and liquidity tightens, crypto traders should watch two key dynamics closely:
Equity-Crypto Correlation: Whether the S&P 500 finds footing around the 7,000 psychological level or continues its multi-day losing streak.Institutional Liquidity Rotation: Once the initial post-IPO dust settles on Wall Street, capital that rotated out of risk assets often looks for oversold bounces—making spot ETF flows and key $BTC support zones critical indicators to monitor.
Is this $1.3 trillion equity wipeout the start of a deeper macro reset, or a classic shakeout before year-end?
DYOR. NFA
#SP500
#TradFiForBeginners #NvidiaBoardReportedlySplitOverHuang’sReturn #IPO
$1.3 Trillion Wiped Out as S&P 500 Drops to 7,020: Why Anthropic’s Historic IPO Couldn't Save the AI
Wall Street just suffered another brutal session as the S&P 500 tumbled toward 7,020, erasing more than $1.3 trillion in market value in a single day. Rather than sparking a fresh wave of tech optimism, the record-breaking public debut of AI giant Anthropic failed to calm growing investor anxiety around artificial intelligence valuations, triggering a sharp selloff across equities and spillover volatility in crypto.
The IPO That Didn't Spark a Turnaround
Anthropic’s Nasdaq listing under the ticker ANT was supposed to be a major catalyst for the AI sector. Priced at $83 per share to raise roughly $81.3 billion—making it the largest IPO in market history—the stock initially surged past $111 on its opening day.
However, that momentum quickly faded. Shares pulled back sharply in follow-up trading, sliding toward the mid-$80s and dragging major semiconductor and big-tech names down with them. Instead of bringing new sidelined cash into the market, the mega-listing acted as a liquidity vacuum—prompting institutional funds to sell existing tech holdings to rebalance their portfolios.
3 Forces Driving the $1.3 Trillion Selloff
AI Valuation Fatigue & CapEx Scrutiny: After massive multi-year rallies, Wall Street is questioning whether heavy spending on AI data centers and infrastructure will deliver near-term profits fast enough to justify stretched tech multiples. Chipmakers like Nvidia, AMD, and Broadcom led the broader market lower as traders locked in gains.Portfolio Rebalancing Around Mega-Listings: Absorbing an $80B+ public offering requires massive capital. Rather than deploying fresh leverage, asset managers trimmed exposure across high-beta tech stocks to free up cash.Macro & Interest Rate Headwinds: Stubborn inflation readings and hawkish signals from Federal Reserve officials have pushed traders to price in tighter monetary policy, putting extra pressure on growth stocks and risk assets across the board.
What This Means for Crypto Traders
When traditional equity indices lose over a trillion dollars in a single day, digital assets rarely escape the crossfire. Institutional desks treat $BTC and major altcoins (ETH, SOL) as high-beta liquidity vehicles during broad risk-off events.
As tech stocks tumble and liquidity tightens, crypto traders should watch two key dynamics closely:
Equity-Crypto Correlation: Whether the S&P 500 finds footing around the 7,000 psychological level or continues its multi-day losing streak.Institutional Liquidity Rotation: Once the initial post-IPO dust settles on Wall Street, capital that rotated out of risk assets often looks for oversold bounces—making spot ETF flows and key $BTC support zones critical indicators to monitor.
Is this $1.3 trillion equity wipeout the start of a deeper macro reset, or a classic shakeout before year-end?
DYOR. NFA
#SP500
#TradFiForBeginners #NvidiaBoardReportedlySplitOverHuang’sReturn #IPO
The IPO That Didn't Spark a Turnaround
Anthropic’s Nasdaq listing under the ticker ANT was supposed to be a major catalyst for the AI sector. Priced at $83 per share to raise roughly $81.3 billion—making it the largest IPO in market history—the stock initially surged past $111 on its opening day.
However, that momentum quickly faded. Shares pulled back sharply in follow-up trading, sliding toward the mid-$80s and dragging major semiconductor and big-tech names down with them. Instead of bringing new sidelined cash into the market, the mega-listing acted as a liquidity vacuum—prompting institutional funds to sell existing tech holdings to rebalance their portfolios.
3 Forces Driving the $1.3 Trillion Selloff
AI Valuation Fatigue & CapEx Scrutiny: After massive multi-year rallies, Wall Street is questioning whether heavy spending on AI data centers and infrastructure will deliver near-term profits fast enough to justify stretched tech multiples. Chipmakers like Nvidia, AMD, and Broadcom led the broader market lower as traders locked in gains.Portfolio Rebalancing Around Mega-Listings: Absorbing an $80B+ public offering requires massive capital. Rather than deploying fresh leverage, asset managers trimmed exposure across high-beta tech stocks to free up cash.Macro & Interest Rate Headwinds: Stubborn inflation readings and hawkish signals from Federal Reserve officials have pushed traders to price in tighter monetary policy, putting extra pressure on growth stocks and risk assets across the board.
What This Means for Crypto Traders
When traditional equity indices lose over a trillion dollars in a single day, digital assets rarely escape the crossfire. Institutional desks treat $BTC and major altcoins (ETH, SOL) as high-beta liquidity vehicles during broad risk-off events.
As tech stocks tumble and liquidity tightens, crypto traders should watch two key dynamics closely:
Equity-Crypto Correlation: Whether the S&P 500 finds footing around the 7,000 psychological level or continues its multi-day losing streak.Institutional Liquidity Rotation: Once the initial post-IPO dust settles on Wall Street, capital that rotated out of risk assets often looks for oversold bounces—making spot ETF flows and key $BTC support zones critical indicators to monitor.
Is this $1.3 trillion equity wipeout the start of a deeper macro reset, or a classic shakeout before year-end?
DYOR. NFA
#SP500
#TradFiForBeginners #NvidiaBoardReportedlySplitOverHuang’sReturn #IPO
2
665

·
--
Partly True
See translation
The S&P 500 information technology sector is officially in a bear market, down roughly 23% from its October 6 closing high. A close 20% below a recent peak triggers bear market territory, and the sector blew past that level this week.
The selloff is concentrated in AI names. Core Weave is down 76% from its peak, Oracle down 68%. But the pain isn't universal. On the day the tech sector dropped 5%, 303 stocks in the S&P 500 were actually higher. The Nasdaq is only in correction territory, not a full bear market, because the damage is lopsided toward tech.
The trigger was the midterm election result. Democrats taking both chambers sparked fears of AI regulation and data center scrutiny, which hit the exact companies that carried the market higher. Add in worries about AI capex outpacing returns and free cash flow shrinking at Google, Amazon, and Meta, and you have the recipe for a sector-specific rout.
Technology still makes up over 35% of the S&P 500. When a sector that big swings, it drags the whole index with it.
$SPXC.US $NVDA
{future}(NVDAUSDT)
{web3_wallet_create}(10x42778037d69350508cdd34d9fa17053970591101)
$GOOGL
{future}(GOOGLUSDT)
#SP500 #Tech #AI #Markets #Crypto
The S&P 500 information technology sector is officially in a bear market, down roughly 23% from its October 6 closing high. A close 20% below a recent peak triggers bear market territory, and the sector blew past that level this week.
The selloff is concentrated in AI names. Core Weave is down 76% from its peak, Oracle down 68%. But the pain isn't universal. On the day the tech sector dropped 5%, 303 stocks in the S&P 500 were actually higher. The Nasdaq is only in correction territory, not a full bear market, because the damage is lopsided toward tech.
The trigger was the midterm election result. Democrats taking both chambers sparked fears of AI regulation and data center scrutiny, which hit the exact companies that carried the market higher. Add in worries about AI capex outpacing returns and free cash flow shrinking at Google, Amazon, and Meta, and you have the recipe for a sector-specific rout.
Technology still makes up over 35% of the S&P 500. When a sector that big swings, it drags the whole index with it.
$SPXC.US $NVDA
$GOOGL
#SP500 #Tech #AI #Markets #Crypto
The selloff is concentrated in AI names. Core Weave is down 76% from its peak, Oracle down 68%. But the pain isn't universal. On the day the tech sector dropped 5%, 303 stocks in the S&P 500 were actually higher. The Nasdaq is only in correction territory, not a full bear market, because the damage is lopsided toward tech.
The trigger was the midterm election result. Democrats taking both chambers sparked fears of AI regulation and data center scrutiny, which hit the exact companies that carried the market higher. Add in worries about AI capex outpacing returns and free cash flow shrinking at Google, Amazon, and Meta, and you have the recipe for a sector-specific rout.
Technology still makes up over 35% of the S&P 500. When a sector that big swings, it drags the whole index with it.
$SPXC.US $NVDA
$GOOGL
#SP500 #Tech #AI #Markets #Crypto

4
671

·
--
Bullish
See translation
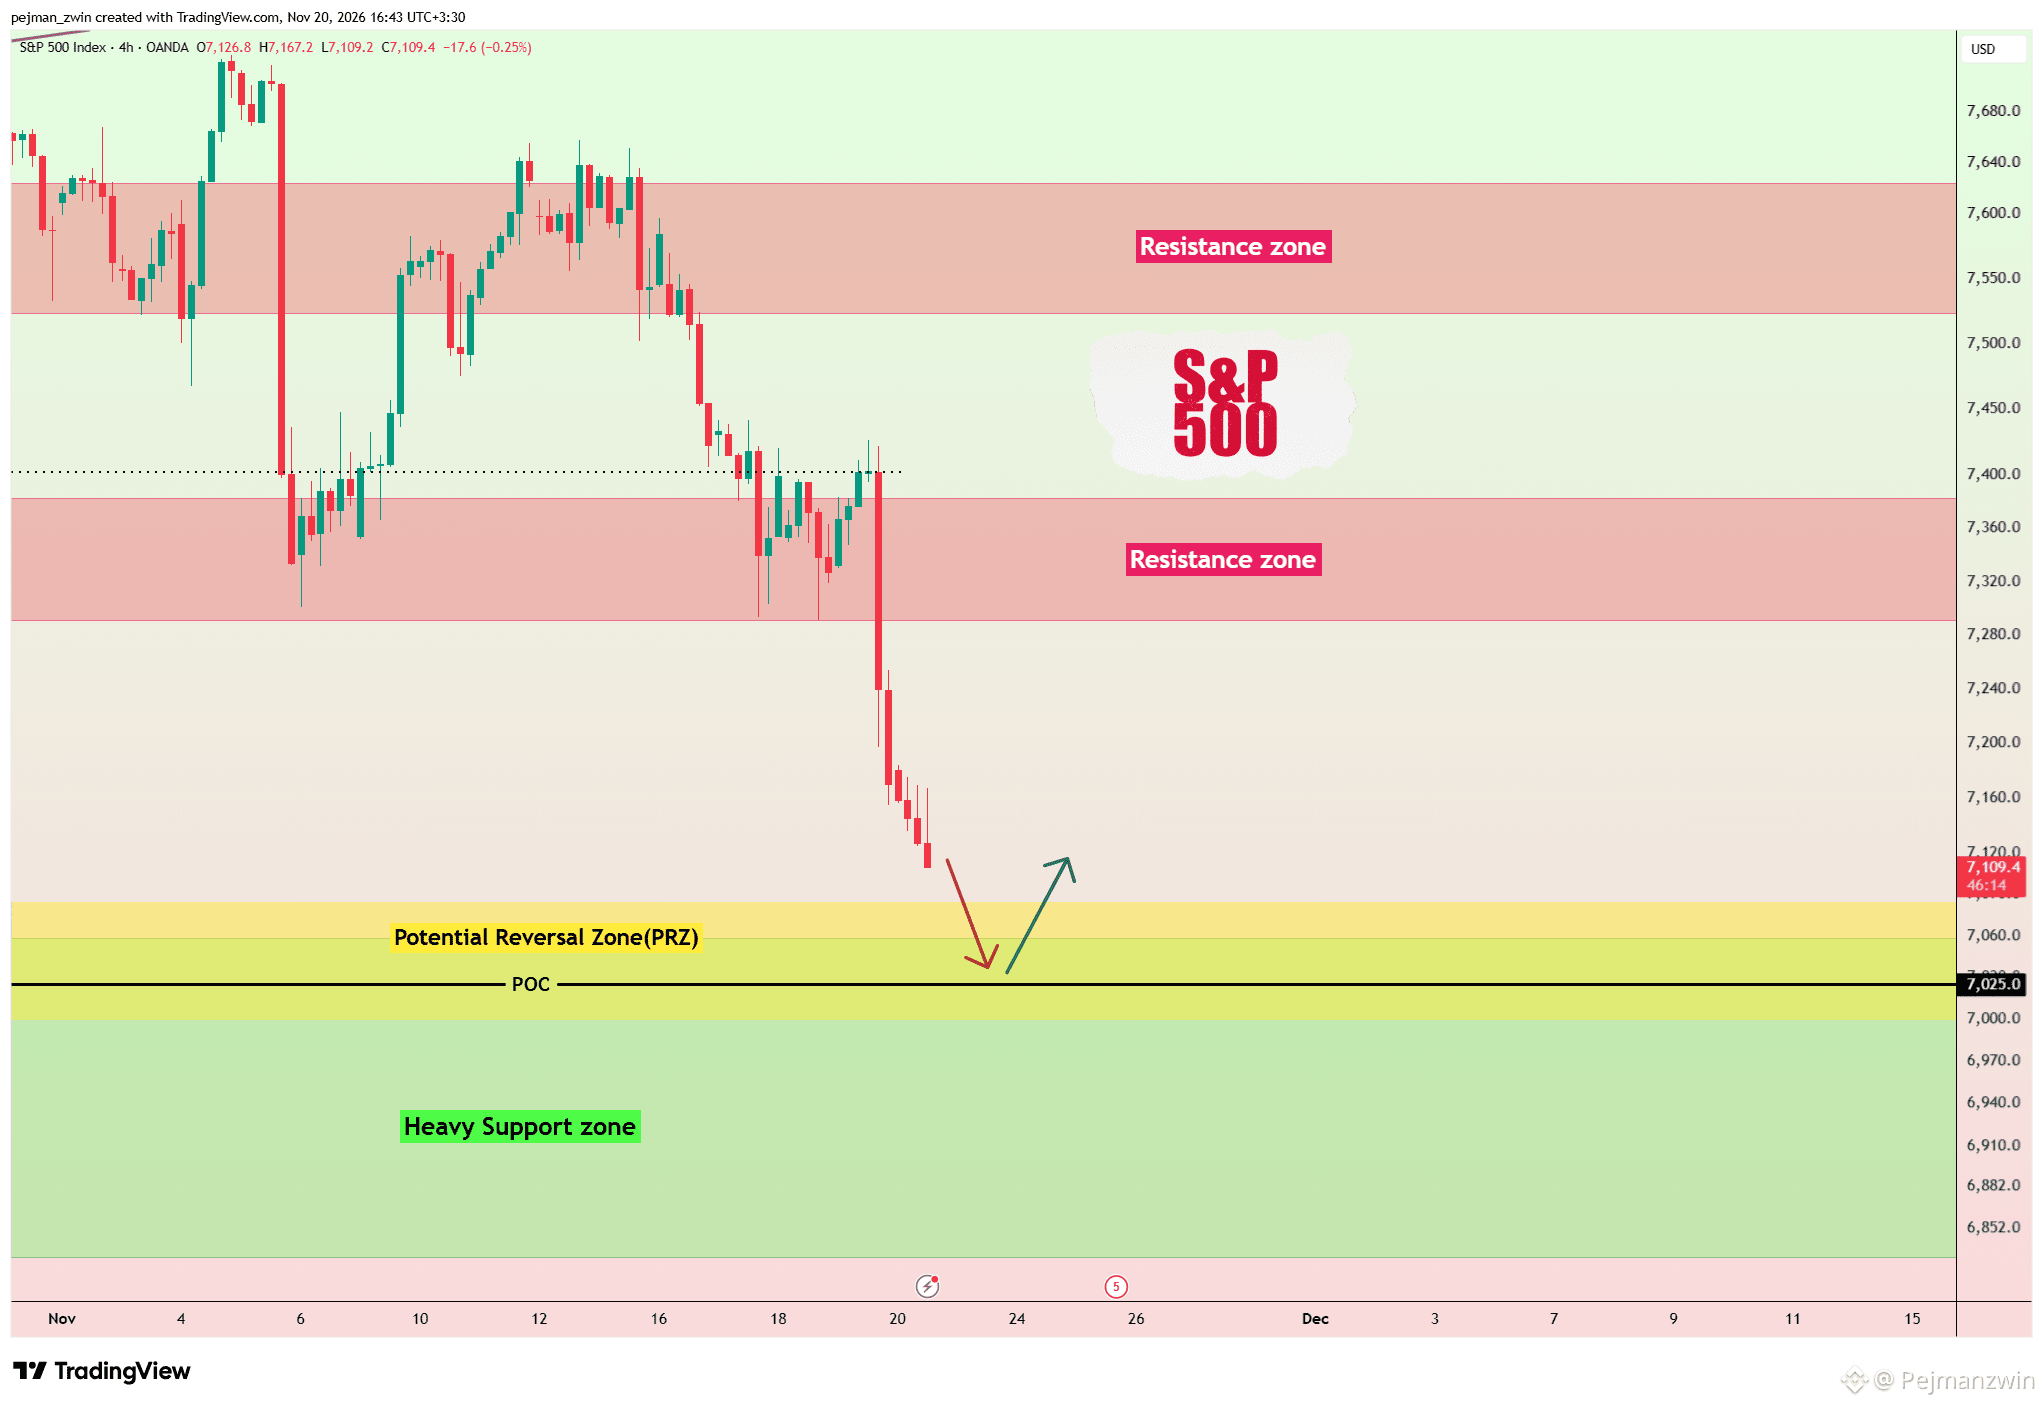
S&P 500 Is Entering a Major Reversal Zone
⠀
SPX fell 2.02% yesterday, extending its losing streak to six sessions as AI valuation concerns, persistent inflation, and hawkish Fed expectations continued to pressure risk assets.
⠀
Selling continued into Friday, while the VIX briefly reached 30.
⠀
But the index is now approaching one of the most important support clusters on the chart.
⠀
I’m watching the Heavy Support Zone around ($6,832-$7,058), the PRZ around ($7,000-$7,084), and especially the key $7,025 level.
⠀
The psychological $7,000 level makes this area even more important.
⠀
Further selling before the weekly close is still possible.
⠀
However, the first test of such a major support confluence can attract buyers and trigger a sharp rebound.
⠀
Today I’m also watching Michigan Consumer Sentiment and Inflation Expectations, Fed Governor Lisa Cook, and monthly Options Expiration flows.
⠀
If buyers step in around $7,000-$7,025, I’ll be watching $7,137 first, followed by the nearby $7,145 level.
⠀
Opening fresh Shorts directly into this support cluster looks increasingly risky to me.
⠀
My setup:
⠀
TP: $7,137
⠀
SL: $6,985
⠀
A sharp S&P 500 rebound could also quickly support Bitcoin and Ethereum while crypto sentiment remains fragile.
⠀
Which level comes first?
⠀
🟢 $7,137
⠀
🔴 $6,985
#SP500
S&P 500 Is Entering a Major Reversal Zone
⠀
SPX fell 2.02% yesterday, extending its losing streak to six sessions as AI valuation concerns, persistent inflation, and hawkish Fed expectations continued to pressure risk assets.
⠀
Selling continued into Friday, while the VIX briefly reached 30.
⠀
But the index is now approaching one of the most important support clusters on the chart.
⠀
I’m watching the Heavy Support Zone around ($6,832-$7,058), the PRZ around ($7,000-$7,084), and especially the key $7,025 level.
⠀
The psychological $7,000 level makes this area even more important.
⠀
Further selling before the weekly close is still possible.
⠀
However, the first test of such a major support confluence can attract buyers and trigger a sharp rebound.
⠀
Today I’m also watching Michigan Consumer Sentiment and Inflation Expectations, Fed Governor Lisa Cook, and monthly Options Expiration flows.
⠀
If buyers step in around $7,000-$7,025, I’ll be watching $7,137 first, followed by the nearby $7,145 level.
⠀
Opening fresh Shorts directly into this support cluster looks increasingly risky to me.
⠀
My setup:
⠀
TP: $7,137
⠀
SL: $6,985
⠀
A sharp S&P 500 rebound could also quickly support Bitcoin and Ethereum while crypto sentiment remains fragile.
⠀
Which level comes first?
⠀
🟢 $7,137
⠀
🔴 $6,985
#SP500
⠀
SPX fell 2.02% yesterday, extending its losing streak to six sessions as AI valuation concerns, persistent inflation, and hawkish Fed expectations continued to pressure risk assets.
⠀
Selling continued into Friday, while the VIX briefly reached 30.
⠀
But the index is now approaching one of the most important support clusters on the chart.
⠀
I’m watching the Heavy Support Zone around ($6,832-$7,058), the PRZ around ($7,000-$7,084), and especially the key $7,025 level.
⠀
The psychological $7,000 level makes this area even more important.
⠀
Further selling before the weekly close is still possible.
⠀
However, the first test of such a major support confluence can attract buyers and trigger a sharp rebound.
⠀
Today I’m also watching Michigan Consumer Sentiment and Inflation Expectations, Fed Governor Lisa Cook, and monthly Options Expiration flows.
⠀
If buyers step in around $7,000-$7,025, I’ll be watching $7,137 first, followed by the nearby $7,145 level.
⠀
Opening fresh Shorts directly into this support cluster looks increasingly risky to me.
⠀
My setup:
⠀
TP: $7,137
⠀
SL: $6,985
⠀
A sharp S&P 500 rebound could also quickly support Bitcoin and Ethereum while crypto sentiment remains fragile.
⠀
Which level comes first?
⠀
🟢 $7,137
⠀
🔴 $6,985
#SP500
3
241

·
--
See translation
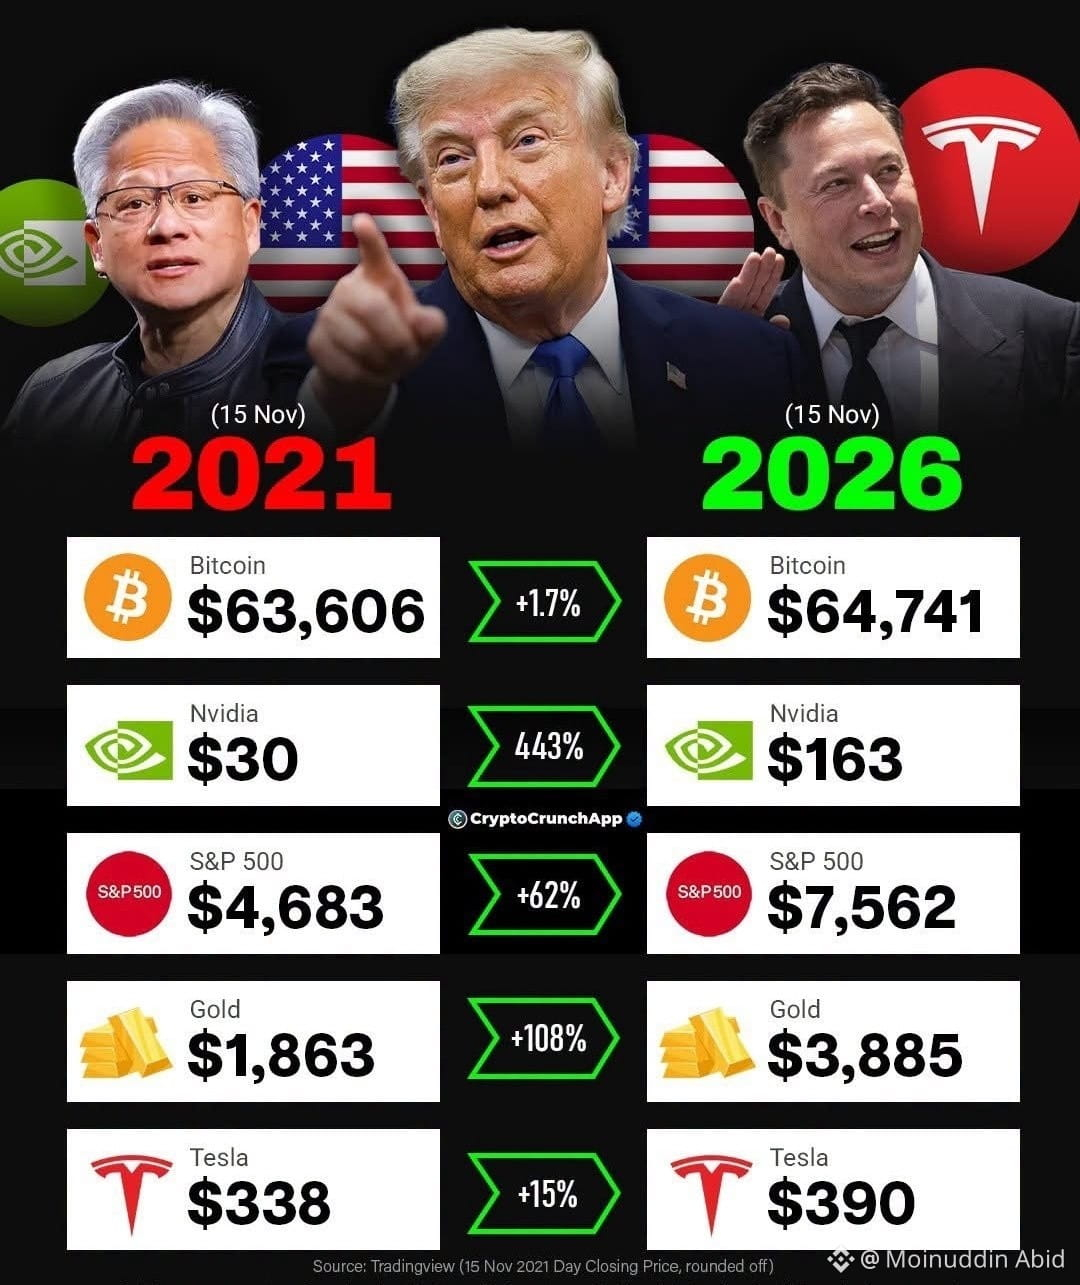
Frankly the US market has grown more inflated than Bitcoin.
5-Year Market Snapshot (Nov 15, 2021 – Nov 15, 2026)
* Bitcoin: $63,606 → $64,741 (+1.7%)
* Nvidia: $30 → $163 (+443%)
* S&P 500: $4,683 → $7,562 (+62%)
* Gold: $1,863 → $3,885 (+108%)
* Tesla: $338 → $390 (+15%)
Nvidia leads by far (+443%), followed by Gold (+108%).
#bitcoin #NVIDIA #GOLD #Tesla #SP500 #crypto
Frankly the US market has grown more inflated than Bitcoin.
5-Year Market Snapshot (Nov 15, 2021 – Nov 15, 2026)
* Bitcoin: $63,606 → $64,741 (+1.7%)
* Nvidia: $30 → $163 (+443%)
* S&P 500: $4,683 → $7,562 (+62%)
* Gold: $1,863 → $3,885 (+108%)
* Tesla: $338 → $390 (+15%)
Nvidia leads by far (+443%), followed by Gold (+108%).
#bitcoin #NVIDIA #GOLD #Tesla #SP500 #crypto
5-Year Market Snapshot (Nov 15, 2021 – Nov 15, 2026)
* Bitcoin: $63,606 → $64,741 (+1.7%)
* Nvidia: $30 → $163 (+443%)
* S&P 500: $4,683 → $7,562 (+62%)
* Gold: $1,863 → $3,885 (+108%)
* Tesla: $338 → $390 (+15%)
Nvidia leads by far (+443%), followed by Gold (+108%).
#bitcoin #NVIDIA #GOLD #Tesla #SP500 #crypto
231

·
--
See translation
🚨 IS THE STOCK MARKET ENTERING A BEAR MARKET?
The Nasdaq is already in correction territory, while the S&P 500 has lost over $6 trillion in market value in six weeks, according to The Kobeissi Letter.
But remember:
A 10% drop = Correction.
A 20% drop = Bear Market.
Are we heading for another major market crash?
#stockmarket #NASDAQ #SP500 #Finance
🚨 IS THE STOCK MARKET ENTERING A BEAR MARKET?
The Nasdaq is already in correction territory, while the S&P 500 has lost over $6 trillion in market value in six weeks, according to The Kobeissi Letter.
But remember:
A 10% drop = Correction.
A 20% drop = Bear Market.
Are we heading for another major market crash?
#stockmarket #NASDAQ #SP500 #Finance
The Nasdaq is already in correction territory, while the S&P 500 has lost over $6 trillion in market value in six weeks, according to The Kobeissi Letter.
But remember:
A 10% drop = Correction.
A 20% drop = Bear Market.
Are we heading for another major market crash?
#stockmarket #NASDAQ #SP500 #Finance
1
1
238

·
--
Verified
Article
See translation
S&P 500 Is 8.2% Below Its Record After Six Straight Losses: What Happened After the Previous 34 TimeDisclosure: It is not financial advice
On Thursday 19 November 2026 the S&P 500 fell 2.02% to 7,175.83, its sixth straight loss, according to CNBC. AP described it as the longest losing streak in two and a half years and put the index 8.2% below the all-time high set last month.
A line like that makes people ask two things: "how bad can it get?" and "how long until it is back?" I did not want to answer from feeling, so I pulled the index history and counted.
What the last six days look like
I used Yahoo Finance daily closes for the S&P 500 (the price index, so dividends are excluded). The record close is 7,818.93 on 6 October 2026. The last close, 7,175.83, is 8.22% below it.
The six losing days are 12 to 19 November. Together they took the index from 7,619.38 (11 November) to 7,175.83, a fall of 5.82%. The other 2.5% came earlier, between the record and 11 November.
The first piece of arithmetic: why recovery needs more than 8.22%
Losses and gains are not symmetric. If $10,000 was invested at the record close, it is $9,177.51 today. To get back to $10,000 it needs to gain $822.49, which is +8.96% on the smaller base.
The same formula gets steep fast. A 20% fall needs a 25% gain. The 2020 low, 33.9% below the peak, needed 51.35%. The 2007 to 2009 low, 56.8% below, needed about 131%. I am not saying that is where we are going. I am saying the cost of a deeper fall is not linear.
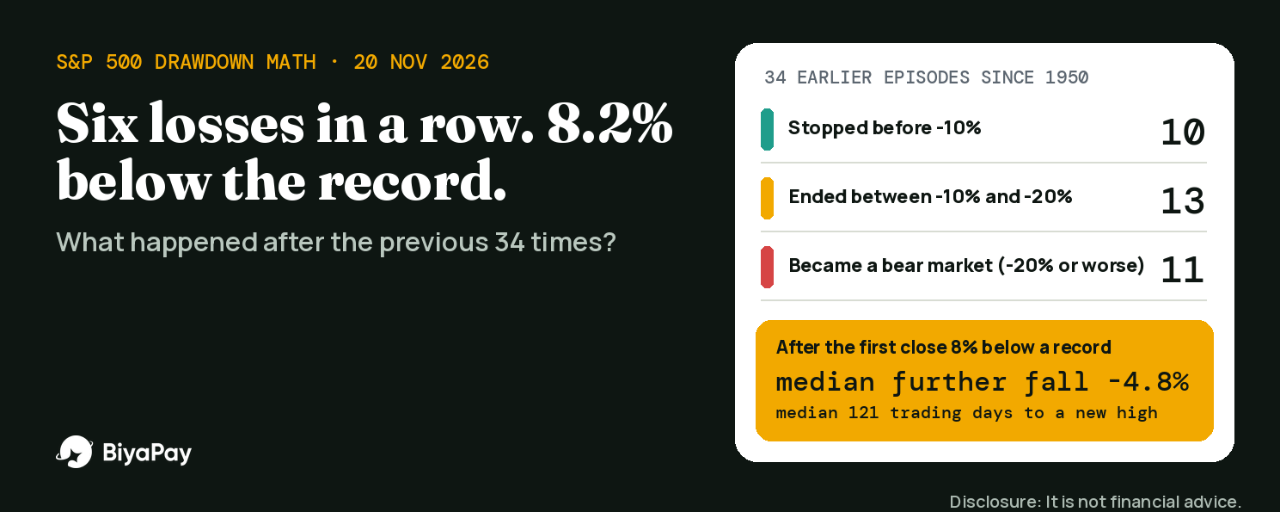
What happened after the previous 34 times
Next I counted every time since 1950 that the S&P 500 first closed at least 8% below a record high. I counted one episode per record high and left out the current one. That gives 34 episodes, and all 34 have since made a new closing high.
How they ended:
10 of 34 stopped before reaching -10%13 of 34 ended between -10% and -20%11 of 34 became bear markets of -20% or worse (with troughs in 1957, 1962, 1966, 1970, 1974, 1982, 1987, 2002, 2009, 2020 and 2022)
After that first close 8% below a record, the median further fall was 4.8%. In 17 of the 34 cases the index fell at least another 5%, in 15 at least another 10%, and in 8 at least another 20%.
On the other side, the median time from the first -8% close to a new closing high was 121 trading days, about six months. The range is wide: 12 days in March-April 2026, 32 days in 2024, and 1,851 days after 1973.
One year after that first close, the index was higher in 22 of the 33 episodes that have a full year of data behind them, with a median change of +8.4%. It was lower in 11, and the worst was -37.5% from November 2007.
Reading it honestly: this is close to a coin flip on whether the first -8% is the worst of it. The sample is small, the episodes overlap with very different backdrops, and price-only data understates recoveries because dividends are left out.
What this is not telling you
It covers the broad US index, not a single stock. AMD lost nearly 8% on Thursday after Hunterbrook Capital disclosed a short position (CNBC), which is a different kind of risk from an index drifting lower.
It also says nothing about this exact cycle. The Fed's October minutes showed officials open to more rate hikes, and futures were pricing a 25 basis point hike for December (Straits Times, 19 November). The 10-year Treasury yield was about 5.05% on Thursday (CoinDesk). Many of the 34 episodes came with different rate backdrops, so I treat them as a range of outcomes, not a forecast.
Buying the S&P 500 through an ETF
If someone wants S&P 500 exposure without picking stocks, the usual route is an ETF. BiyaPay lists the three biggest S&P 500 funds: VOO, SPY and IVV. I checked them on 20 November 2026 at about 05:17 to 05:19 WIB.
What is shown: VOO showed a post-market price of 658.01, equal to its 19 November close in Yahoo's data. SPY showed 715.87 and IVV 719.05, which also match. The order panel shows Buy and Sell, Limit, Market and Stop order, and a session choice of pre-market, regular and after-hoursRequirements: BiyaPay cannot provide services in the United StatesFees: on BiyaPay's Cost Center, US stock commission is $0, platform fee is $0.005 per share with a $0.99 minimum per order and a 1% cap, settlement is $0.003 per share, and SEC and trading activity fees apply to sells. On 15 whole shares of VOO ($9,870.15) my arithmetic gives $1.035 to buy and $1.248 to sell, $2.283 in total, or 0.023%Fund cost: VOO and IVV charge a 0.03% expense ratio and SPY 0.0945%, according to their fund documents. On $9,870 that is about $2.96 a year for VOO
Fees are not the reason to buy or not buy. At this size they are tiny next to the market moving 2% in a day, which is why I would spend my effort on position size instead.
My opinion
I do not know if 7,175.83 is the low, and the 34 episodes say nobody should be confident either way. What I take from them is simpler.
First, size matters more than timing. If a 20% fall, which would turn $10,000 into $8,000, would force me to sell something I need, the position is too big already.
Second, if I add, I would add in steps decided in advance, not all at once because of a headline. On an account this size, splitting into a few whole-share orders costs about $1 in fees per order.
Third, I would not use leverage into a streak like this. A drawdown that history says can run another 5% to 10% is exactly when forced selling hurts.
When this applies, and when it does not
This applies to a broad US stock index and to someone who can hold for years. It does not apply to single stocks, to leveraged or short-term products, to money needed within a year, or to anyone who cannot sleep at -20%. The statistics are from price data, and a different definition of an episode would give slightly different counts.
Checklist I use
Write down the drop I could accept before I buy, in dollars, not in percentRemember that recovery math is not symmetric: -20% needs +25%Check whether I am looking at an index, an ETF or a single stockDecide the buying steps in advance, with a date or a level, not in the middle of a red dayRead the order preview for fees before confirming, and the fund's expense ratio onceConfirm the service is available in my country and what the deposit route costsDo not borrow to buy a falling market
Sources (all checked 20 November 2026, Asia/Jakarta): CNBC, "Stock market news for Nov. 19, 2026"; AP, "Wall Street tumbles to its longest losing streak since 2024 as the Dow drops 1,100 points" (19 November 2026); Straits Times, "Wall Street ends mixed after Nvidia earnings and Fed minutes" (19 November 2026); CoinDesk live updates, 19 November 2026; Yahoo Finance daily closes for ^GSPC (1950 to 19 November 2026), VOO, SPY and IVV; BiyaPay VOO, SPY and IVV pages and Cost Center US stock fees (20 November 2026); Vanguard VOO fact sheet (25 March 2026); iShares IVV prospectus (31 July 2026); State Street SPY prospectus (0.0945%). Episode counts, streak sums and fee arithmetic are my own calculations.
#BiyaPay #SP500 #ETF #StockMarket #Drawdown
S&P 500 Is 8.2% Below Its Record After Six Straight Losses: What Happened After the Previous 34 Time
Disclosure: It is not financial advice
On Thursday 19 November 2026 the S&P 500 fell 2.02% to 7,175.83, its sixth straight loss, according to CNBC. AP described it as the longest losing streak in two and a half years and put the index 8.2% below the all-time high set last month.
A line like that makes people ask two things: "how bad can it get?" and "how long until it is back?" I did not want to answer from feeling, so I pulled the index history and counted.
What the last six days look like
I used Yahoo Finance daily closes for the S&P 500 (the price index, so dividends are excluded). The record close is 7,818.93 on 6 October 2026. The last close, 7,175.83, is 8.22% below it.
The six losing days are 12 to 19 November. Together they took the index from 7,619.38 (11 November) to 7,175.83, a fall of 5.82%. The other 2.5% came earlier, between the record and 11 November.
The first piece of arithmetic: why recovery needs more than 8.22%
Losses and gains are not symmetric. If $10,000 was invested at the record close, it is $9,177.51 today. To get back to $10,000 it needs to gain $822.49, which is +8.96% on the smaller base.
The same formula gets steep fast. A 20% fall needs a 25% gain. The 2020 low, 33.9% below the peak, needed 51.35%. The 2007 to 2009 low, 56.8% below, needed about 131%. I am not saying that is where we are going. I am saying the cost of a deeper fall is not linear.
What happened after the previous 34 times
Next I counted every time since 1950 that the S&P 500 first closed at least 8% below a record high. I counted one episode per record high and left out the current one. That gives 34 episodes, and all 34 have since made a new closing high.
How they ended:
10 of 34 stopped before reaching -10%13 of 34 ended between -10% and -20%11 of 34 became bear markets of -20% or worse (with troughs in 1957, 1962, 1966, 1970, 1974, 1982, 1987, 2002, 2009, 2020 and 2022)
After that first close 8% below a record, the median further fall was 4.8%. In 17 of the 34 cases the index fell at least another 5%, in 15 at least another 10%, and in 8 at least another 20%.
On the other side, the median time from the first -8% close to a new closing high was 121 trading days, about six months. The range is wide: 12 days in March-April 2026, 32 days in 2024, and 1,851 days after 1973.
One year after that first close, the index was higher in 22 of the 33 episodes that have a full year of data behind them, with a median change of +8.4%. It was lower in 11, and the worst was -37.5% from November 2007.
Reading it honestly: this is close to a coin flip on whether the first -8% is the worst of it. The sample is small, the episodes overlap with very different backdrops, and price-only data understates recoveries because dividends are left out.
What this is not telling you
It covers the broad US index, not a single stock. AMD lost nearly 8% on Thursday after Hunterbrook Capital disclosed a short position (CNBC), which is a different kind of risk from an index drifting lower.
It also says nothing about this exact cycle. The Fed's October minutes showed officials open to more rate hikes, and futures were pricing a 25 basis point hike for December (Straits Times, 19 November). The 10-year Treasury yield was about 5.05% on Thursday (CoinDesk). Many of the 34 episodes came with different rate backdrops, so I treat them as a range of outcomes, not a forecast.
Buying the S&P 500 through an ETF
If someone wants S&P 500 exposure without picking stocks, the usual route is an ETF. BiyaPay lists the three biggest S&P 500 funds: VOO, SPY and IVV. I checked them on 20 November 2026 at about 05:17 to 05:19 WIB.
What is shown: VOO showed a post-market price of 658.01, equal to its 19 November close in Yahoo's data. SPY showed 715.87 and IVV 719.05, which also match. The order panel shows Buy and Sell, Limit, Market and Stop order, and a session choice of pre-market, regular and after-hoursRequirements: BiyaPay cannot provide services in the United StatesFees: on BiyaPay's Cost Center, US stock commission is $0, platform fee is $0.005 per share with a $0.99 minimum per order and a 1% cap, settlement is $0.003 per share, and SEC and trading activity fees apply to sells. On 15 whole shares of VOO ($9,870.15) my arithmetic gives $1.035 to buy and $1.248 to sell, $2.283 in total, or 0.023%Fund cost: VOO and IVV charge a 0.03% expense ratio and SPY 0.0945%, according to their fund documents. On $9,870 that is about $2.96 a year for VOO
Fees are not the reason to buy or not buy. At this size they are tiny next to the market moving 2% in a day, which is why I would spend my effort on position size instead.
My opinion
I do not know if 7,175.83 is the low, and the 34 episodes say nobody should be confident either way. What I take from them is simpler.
First, size matters more than timing. If a 20% fall, which would turn $10,000 into $8,000, would force me to sell something I need, the position is too big already.
Second, if I add, I would add in steps decided in advance, not all at once because of a headline. On an account this size, splitting into a few whole-share orders costs about $1 in fees per order.
Third, I would not use leverage into a streak like this. A drawdown that history says can run another 5% to 10% is exactly when forced selling hurts.
When this applies, and when it does not
This applies to a broad US stock index and to someone who can hold for years. It does not apply to single stocks, to leveraged or short-term products, to money needed within a year, or to anyone who cannot sleep at -20%. The statistics are from price data, and a different definition of an episode would give slightly different counts.
Checklist I use
Write down the drop I could accept before I buy, in dollars, not in percentRemember that recovery math is not symmetric: -20% needs +25%Check whether I am looking at an index, an ETF or a single stockDecide the buying steps in advance, with a date or a level, not in the middle of a red dayRead the order preview for fees before confirming, and the fund's expense ratio onceConfirm the service is available in my country and what the deposit route costsDo not borrow to buy a falling market
Sources (all checked 20 November 2026, Asia/Jakarta): CNBC, "Stock market news for Nov. 19, 2026"; AP, "Wall Street tumbles to its longest losing streak since 2024 as the Dow drops 1,100 points" (19 November 2026); Straits Times, "Wall Street ends mixed after Nvidia earnings and Fed minutes" (19 November 2026); CoinDesk live updates, 19 November 2026; Yahoo Finance daily closes for ^GSPC (1950 to 19 November 2026), VOO, SPY and IVV; BiyaPay VOO, SPY and IVV pages and Cost Center US stock fees (20 November 2026); Vanguard VOO fact sheet (25 March 2026); iShares IVV prospectus (31 July 2026); State Street SPY prospectus (0.0945%). Episode counts, streak sums and fee arithmetic are my own calculations.
#BiyaPay #SP500 #ETF #StockMarket #Drawdown
On Thursday 19 November 2026 the S&P 500 fell 2.02% to 7,175.83, its sixth straight loss, according to CNBC. AP described it as the longest losing streak in two and a half years and put the index 8.2% below the all-time high set last month.
A line like that makes people ask two things: "how bad can it get?" and "how long until it is back?" I did not want to answer from feeling, so I pulled the index history and counted.
What the last six days look like
I used Yahoo Finance daily closes for the S&P 500 (the price index, so dividends are excluded). The record close is 7,818.93 on 6 October 2026. The last close, 7,175.83, is 8.22% below it.
The six losing days are 12 to 19 November. Together they took the index from 7,619.38 (11 November) to 7,175.83, a fall of 5.82%. The other 2.5% came earlier, between the record and 11 November.
The first piece of arithmetic: why recovery needs more than 8.22%
Losses and gains are not symmetric. If $10,000 was invested at the record close, it is $9,177.51 today. To get back to $10,000 it needs to gain $822.49, which is +8.96% on the smaller base.
The same formula gets steep fast. A 20% fall needs a 25% gain. The 2020 low, 33.9% below the peak, needed 51.35%. The 2007 to 2009 low, 56.8% below, needed about 131%. I am not saying that is where we are going. I am saying the cost of a deeper fall is not linear.
What happened after the previous 34 times
Next I counted every time since 1950 that the S&P 500 first closed at least 8% below a record high. I counted one episode per record high and left out the current one. That gives 34 episodes, and all 34 have since made a new closing high.
How they ended:
10 of 34 stopped before reaching -10%13 of 34 ended between -10% and -20%11 of 34 became bear markets of -20% or worse (with troughs in 1957, 1962, 1966, 1970, 1974, 1982, 1987, 2002, 2009, 2020 and 2022)
After that first close 8% below a record, the median further fall was 4.8%. In 17 of the 34 cases the index fell at least another 5%, in 15 at least another 10%, and in 8 at least another 20%.
On the other side, the median time from the first -8% close to a new closing high was 121 trading days, about six months. The range is wide: 12 days in March-April 2026, 32 days in 2024, and 1,851 days after 1973.
One year after that first close, the index was higher in 22 of the 33 episodes that have a full year of data behind them, with a median change of +8.4%. It was lower in 11, and the worst was -37.5% from November 2007.
Reading it honestly: this is close to a coin flip on whether the first -8% is the worst of it. The sample is small, the episodes overlap with very different backdrops, and price-only data understates recoveries because dividends are left out.
What this is not telling you
It covers the broad US index, not a single stock. AMD lost nearly 8% on Thursday after Hunterbrook Capital disclosed a short position (CNBC), which is a different kind of risk from an index drifting lower.
It also says nothing about this exact cycle. The Fed's October minutes showed officials open to more rate hikes, and futures were pricing a 25 basis point hike for December (Straits Times, 19 November). The 10-year Treasury yield was about 5.05% on Thursday (CoinDesk). Many of the 34 episodes came with different rate backdrops, so I treat them as a range of outcomes, not a forecast.
Buying the S&P 500 through an ETF
If someone wants S&P 500 exposure without picking stocks, the usual route is an ETF. BiyaPay lists the three biggest S&P 500 funds: VOO, SPY and IVV. I checked them on 20 November 2026 at about 05:17 to 05:19 WIB.
What is shown: VOO showed a post-market price of 658.01, equal to its 19 November close in Yahoo's data. SPY showed 715.87 and IVV 719.05, which also match. The order panel shows Buy and Sell, Limit, Market and Stop order, and a session choice of pre-market, regular and after-hoursRequirements: BiyaPay cannot provide services in the United StatesFees: on BiyaPay's Cost Center, US stock commission is $0, platform fee is $0.005 per share with a $0.99 minimum per order and a 1% cap, settlement is $0.003 per share, and SEC and trading activity fees apply to sells. On 15 whole shares of VOO ($9,870.15) my arithmetic gives $1.035 to buy and $1.248 to sell, $2.283 in total, or 0.023%Fund cost: VOO and IVV charge a 0.03% expense ratio and SPY 0.0945%, according to their fund documents. On $9,870 that is about $2.96 a year for VOO
Fees are not the reason to buy or not buy. At this size they are tiny next to the market moving 2% in a day, which is why I would spend my effort on position size instead.
My opinion
I do not know if 7,175.83 is the low, and the 34 episodes say nobody should be confident either way. What I take from them is simpler.
First, size matters more than timing. If a 20% fall, which would turn $10,000 into $8,000, would force me to sell something I need, the position is too big already.
Second, if I add, I would add in steps decided in advance, not all at once because of a headline. On an account this size, splitting into a few whole-share orders costs about $1 in fees per order.
Third, I would not use leverage into a streak like this. A drawdown that history says can run another 5% to 10% is exactly when forced selling hurts.
When this applies, and when it does not
This applies to a broad US stock index and to someone who can hold for years. It does not apply to single stocks, to leveraged or short-term products, to money needed within a year, or to anyone who cannot sleep at -20%. The statistics are from price data, and a different definition of an episode would give slightly different counts.
Checklist I use
Write down the drop I could accept before I buy, in dollars, not in percentRemember that recovery math is not symmetric: -20% needs +25%Check whether I am looking at an index, an ETF or a single stockDecide the buying steps in advance, with a date or a level, not in the middle of a red dayRead the order preview for fees before confirming, and the fund's expense ratio onceConfirm the service is available in my country and what the deposit route costsDo not borrow to buy a falling market
Sources (all checked 20 November 2026, Asia/Jakarta): CNBC, "Stock market news for Nov. 19, 2026"; AP, "Wall Street tumbles to its longest losing streak since 2024 as the Dow drops 1,100 points" (19 November 2026); Straits Times, "Wall Street ends mixed after Nvidia earnings and Fed minutes" (19 November 2026); CoinDesk live updates, 19 November 2026; Yahoo Finance daily closes for ^GSPC (1950 to 19 November 2026), VOO, SPY and IVV; BiyaPay VOO, SPY and IVV pages and Cost Center US stock fees (20 November 2026); Vanguard VOO fact sheet (25 March 2026); iShares IVV prospectus (31 July 2026); State Street SPY prospectus (0.0945%). Episode counts, streak sums and fee arithmetic are my own calculations.
#BiyaPay #SP500 #ETF #StockMarket #Drawdown
1
1.2k

·
--
Article
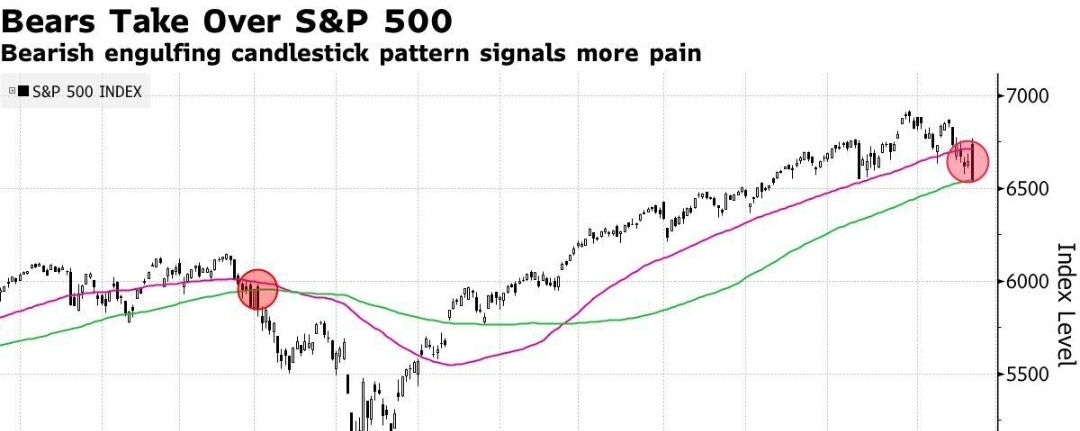
S & P 500📊 S&P 500 Market Analysis | November 20, 2026
The S&P 500 closed at 7,175.83 on November 19, down 2.02% for the day. Current conditions show a significant increase in selling pressure in the U.S. stock market.
S & P 500
📊 S&P 500 Market Analysis | November 20, 2026
The S&P 500 closed at 7,175.83 on November 19, down 2.02% for the day. Current conditions show a significant increase in selling pressure in the U.S. stock market.
The S&P 500 closed at 7,175.83 on November 19, down 2.02% for the day. Current conditions show a significant increase in selling pressure in the U.S. stock market.
151


·
--
Verified
See translation
$ONDO Finance launches tokenized S&P 500 portfolio with downside protection features
The Ondo US 500 Capital Shielded Portfolio, SPYSHIELDon, combines 12 defined-outcome ETFs into one token, aiming to cushion S&P 500 losses over one-year periods in exchange for capped upside, with quarterly rebalancing for eligible.
#ONDO #SP500
{future}(ONDOUSDT)
{future}(XRPUSDT)
{alpha}(560xb305e6954e4e0cd021c06ec355681abc8a00dbd7)
$ONDO Finance launches tokenized S&P 500 portfolio with downside protection features
The Ondo US 500 Capital Shielded Portfolio, SPYSHIELDon, combines 12 defined-outcome ETFs into one token, aiming to cushion S&P 500 losses over one-year periods in exchange for capped upside, with quarterly rebalancing for eligible.
#ONDO #SP500
The Ondo US 500 Capital Shielded Portfolio, SPYSHIELDon, combines 12 defined-outcome ETFs into one token, aiming to cushion S&P 500 losses over one-year periods in exchange for capped upside, with quarterly rebalancing for eligible.
#ONDO #SP500


1
900

See translation
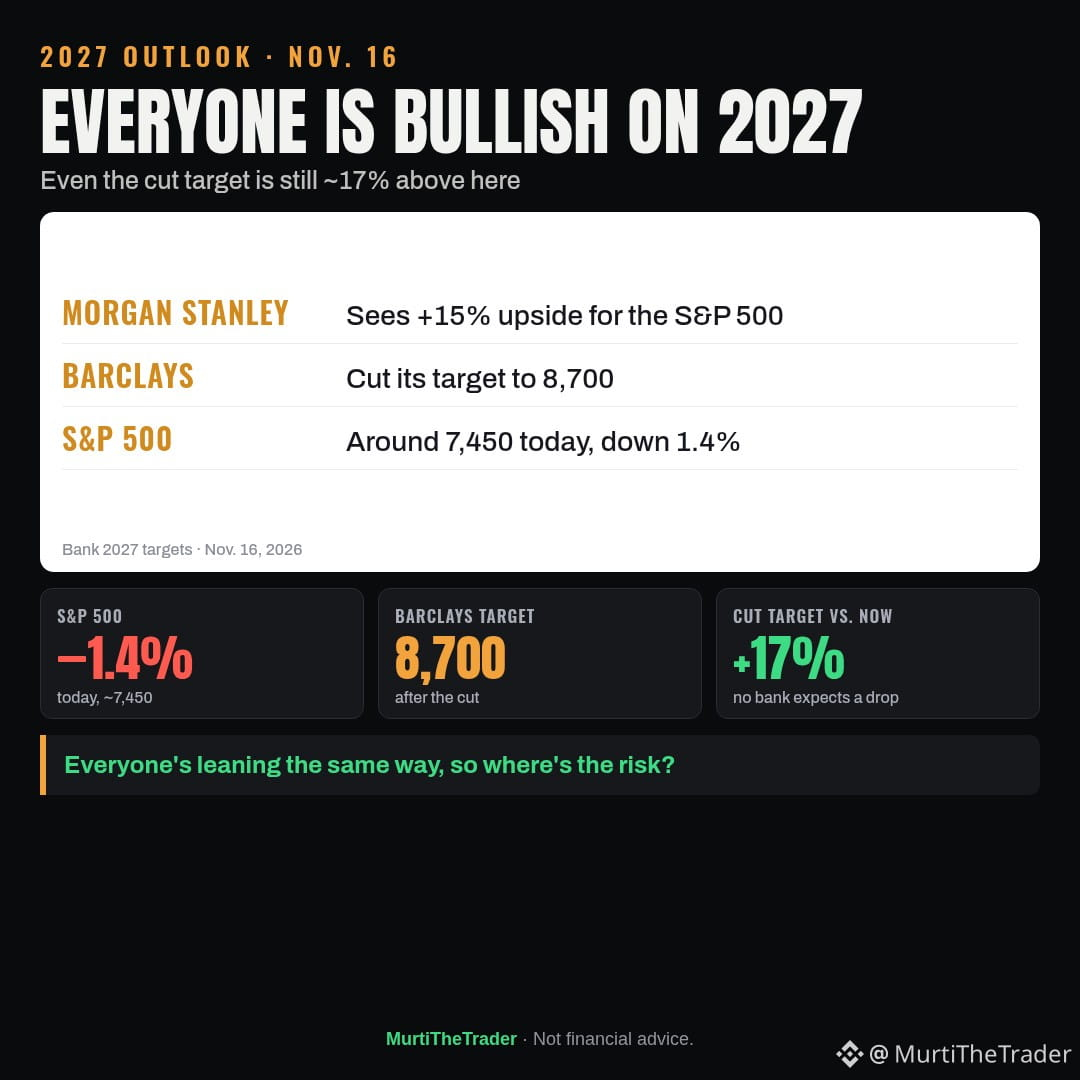
Everyone is talking about 2027 targets.
Morgan Stanley sees 15% upside for the S&P 500, Barclays cut its target to 8,700; the S&P 500, meanwhile, is around 7,450 today, down 1.4%.
What I find interesting: even the "cut" target is 17% above here, so none of the banks expects a decline.
With everyone looking the same way, where do you think the risk is?
#StockMarket #SP500
Watching: $SPY $QQQ
Everyone is talking about 2027 targets.
Morgan Stanley sees 15% upside for the S&P 500, Barclays cut its target to 8,700; the S&P 500, meanwhile, is around 7,450 today, down 1.4%.
What I find interesting: even the "cut" target is 17% above here, so none of the banks expects a decline.
With everyone looking the same way, where do you think the risk is?
#StockMarket #SP500
Watching: $SPY $QQQ
Morgan Stanley sees 15% upside for the S&P 500, Barclays cut its target to 8,700; the S&P 500, meanwhile, is around 7,450 today, down 1.4%.
What I find interesting: even the "cut" target is 17% above here, so none of the banks expects a decline.
With everyone looking the same way, where do you think the risk is?
#StockMarket #SP500
Watching: $SPY $QQQ
The Puppet Master:
The target is the destination, not the route. A higher year-end forecast can still leave room for a nasty drawdown along the way. I’d be more interested in how much of that upside assumes earnings growth versus a richer valuation. Which assumption looks more fragile to you?
2
1
428

·
--
Article
See translation
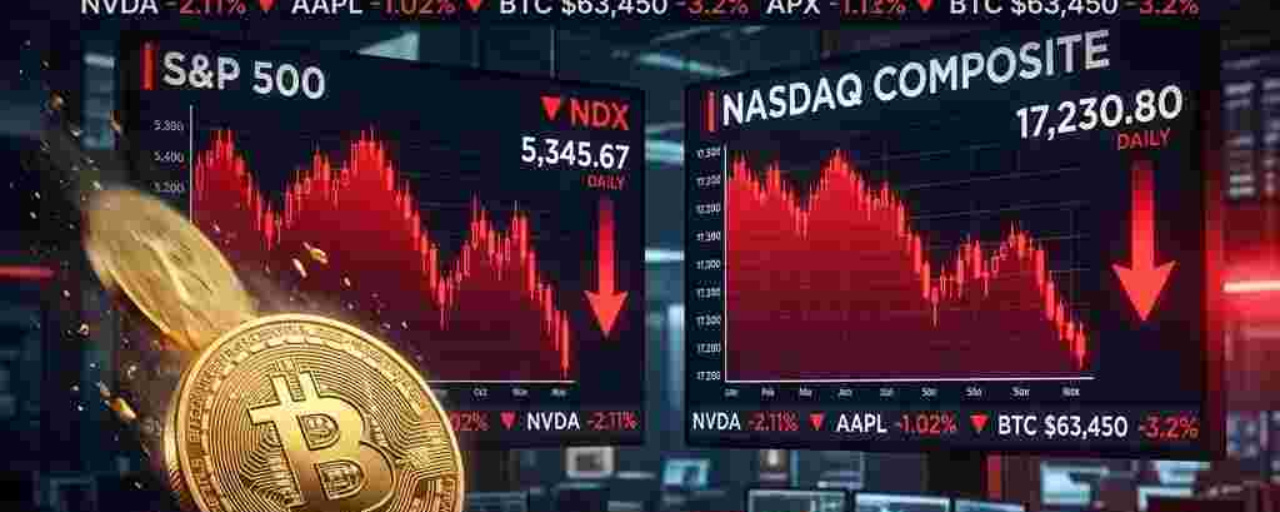
WALL STREET WARNING: S&P 500 & NASDAQ HIT QUARTERLY LOWS!#sp500andnasdaqfutureshitquarterlylows
US stock futures are facing heavy selling pressure as investors pull back from AI and cryptocurrency-related stocks.
📉 MARKET SNAPSHOT:
Nasdaq 100 futures: -1.45%S&P 500 futures: -0.69%Dow futures: -0.09%NVIDIA shares: -3.83%
🔥 What's driving the sell-off?
Bitcoin's six-week losing streak is hurting crypto-related stocks.AI stocks face growing valuation concerns.Investors are nervous ahead of NVIDIA's earnings.Rising interest-rate expectations are adding pressure.
WHAT'S NEXT?
All eyes are on NVIDIA's earnings, upcoming US economic data, and Federal Reserve signals.
⚠️ If selling continues, volatility could spread across global markets.
💬 Your prediction: Is Wall Street heading toward a deeper correction, or is this a temporary buying opportunity?
#SP500 #NASDAQ #WallStreet #NVIDIA
WALL STREET WARNING: S&P 500 & NASDAQ HIT QUARTERLY LOWS!
#sp500andnasdaqfutureshitquarterlylows
US stock futures are facing heavy selling pressure as investors pull back from AI and cryptocurrency-related stocks.
📉 MARKET SNAPSHOT:
Nasdaq 100 futures: -1.45%S&P 500 futures: -0.69%Dow futures: -0.09%NVIDIA shares: -3.83%
🔥 What's driving the sell-off?
Bitcoin's six-week losing streak is hurting crypto-related stocks.AI stocks face growing valuation concerns.Investors are nervous ahead of NVIDIA's earnings.Rising interest-rate expectations are adding pressure.
WHAT'S NEXT?
All eyes are on NVIDIA's earnings, upcoming US economic data, and Federal Reserve signals.
⚠️ If selling continues, volatility could spread across global markets.
💬 Your prediction: Is Wall Street heading toward a deeper correction, or is this a temporary buying opportunity?
#SP500 #NASDAQ #WallStreet #NVIDIA
US stock futures are facing heavy selling pressure as investors pull back from AI and cryptocurrency-related stocks.
📉 MARKET SNAPSHOT:
Nasdaq 100 futures: -1.45%S&P 500 futures: -0.69%Dow futures: -0.09%NVIDIA shares: -3.83%
🔥 What's driving the sell-off?
Bitcoin's six-week losing streak is hurting crypto-related stocks.AI stocks face growing valuation concerns.Investors are nervous ahead of NVIDIA's earnings.Rising interest-rate expectations are adding pressure.
WHAT'S NEXT?
All eyes are on NVIDIA's earnings, upcoming US economic data, and Federal Reserve signals.
⚠️ If selling continues, volatility could spread across global markets.
💬 Your prediction: Is Wall Street heading toward a deeper correction, or is this a temporary buying opportunity?
#SP500 #NASDAQ #WallStreet #NVIDIA
2
199
·
--
See translation
MARKET ALERT: S&P 500 & NASDAQ FUTURES HIT QUARTERLY LOWS!
Wall Street is facing renewed selling pressure as S&P 500 and Nasdaq futures slide to their lowest levels of the quarter.
Investor sentiment is weakening. Market volatility is rising. Traders are watching closely for the next move.
Is this the beginning of a deeper market correction, or a potential buying opportunity?
Stay alert. Protect your capital. Trade smart.
#SP500 #NASDAQ #trading #SP500AndNasdaqFuturesHitQuarterlyLows
MARKET ALERT: S&P 500 & NASDAQ FUTURES HIT QUARTERLY LOWS!
Wall Street is facing renewed selling pressure as S&P 500 and Nasdaq futures slide to their lowest levels of the quarter.
Investor sentiment is weakening. Market volatility is rising. Traders are watching closely for the next move.
Is this the beginning of a deeper market correction, or a potential buying opportunity?
Stay alert. Protect your capital. Trade smart.
#SP500 #NASDAQ #trading #SP500AndNasdaqFuturesHitQuarterlyLows
Wall Street is facing renewed selling pressure as S&P 500 and Nasdaq futures slide to their lowest levels of the quarter.
Investor sentiment is weakening. Market volatility is rising. Traders are watching closely for the next move.
Is this the beginning of a deeper market correction, or a potential buying opportunity?
Stay alert. Protect your capital. Trade smart.
#SP500 #NASDAQ #trading #SP500AndNasdaqFuturesHitQuarterlyLows
182
Partly True
See translation
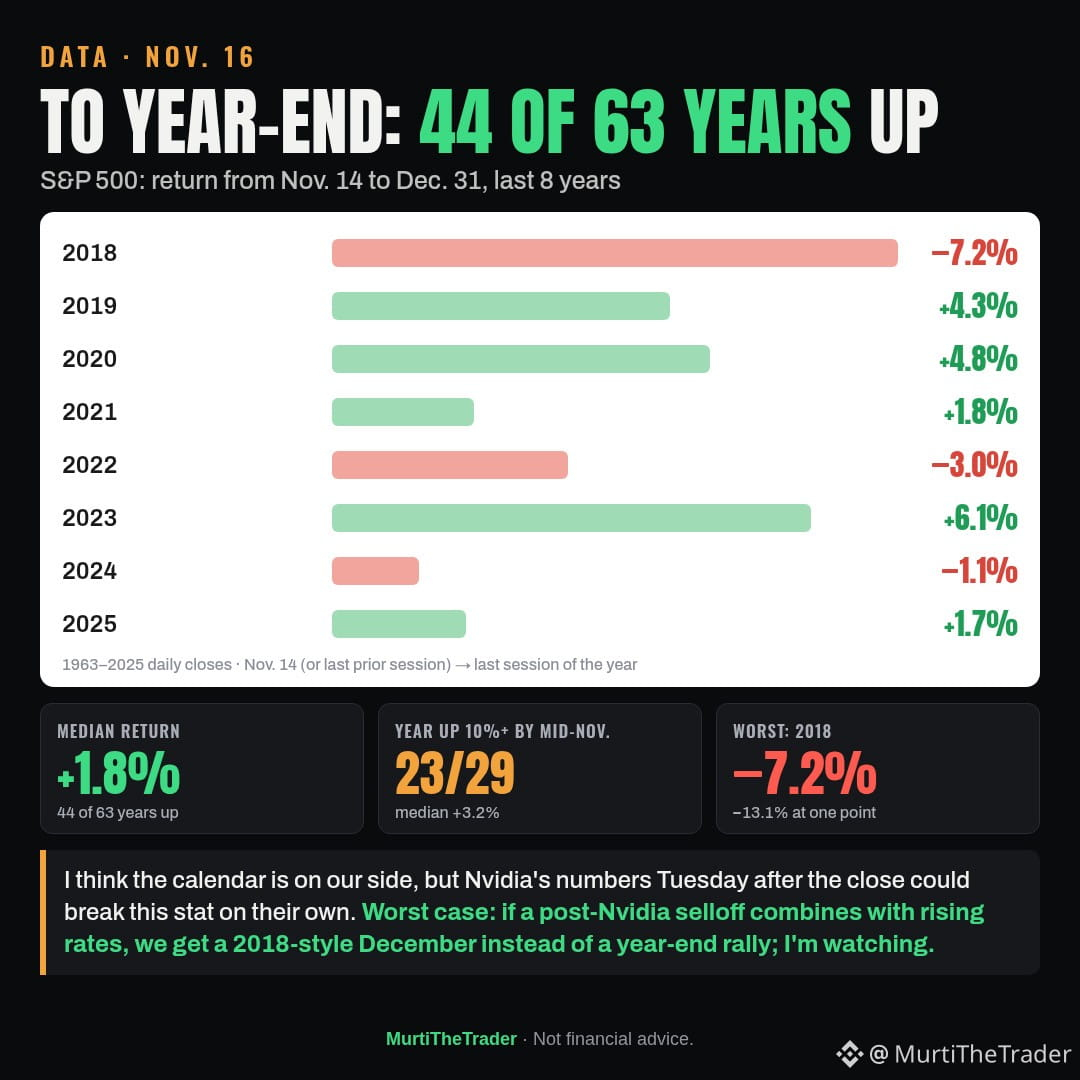
Data: Since 1963, the S&P 500 has risen from Nov. 14 to year-end in 44 of 63 years, with a median gain of 1.8%.
→ In the 29 years it came into mid-November up more than 10%, 23 were positive, median +3.2% (2026: +10.5%)
→ The worst was 2018: it first fell 13.1% and closed the year down 7.2%
I think the calendar is on our side, but Nvidia's numbers Tuesday after the close could break this stat on their own.
Worst case: if a post-Nvidia selloff combines with rising rates, we get a 2018-style December instead of a year-end rally; I'm watching.
#Investing #SP500 $SPY
Watching: $SPY $NVDA
Data: Since 1963, the S&P 500 has risen from Nov. 14 to year-end in 44 of 63 years, with a median gain of 1.8%.
→ In the 29 years it came into mid-November up more than 10%, 23 were positive, median +3.2% (2026: +10.5%)
→ The worst was 2018: it first fell 13.1% and closed the year down 7.2%
I think the calendar is on our side, but Nvidia's numbers Tuesday after the close could break this stat on their own.
Worst case: if a post-Nvidia selloff combines with rising rates, we get a 2018-style December instead of a year-end rally; I'm watching.
#Investing #SP500 $SPY
Watching: $SPY $NVDA
→ In the 29 years it came into mid-November up more than 10%, 23 were positive, median +3.2% (2026: +10.5%)
→ The worst was 2018: it first fell 13.1% and closed the year down 7.2%
I think the calendar is on our side, but Nvidia's numbers Tuesday after the close could break this stat on their own.
Worst case: if a post-Nvidia selloff combines with rising rates, we get a 2018-style December instead of a year-end rally; I'm watching.
#Investing #SP500 $SPY
Watching: $SPY $NVDA
864
See translation
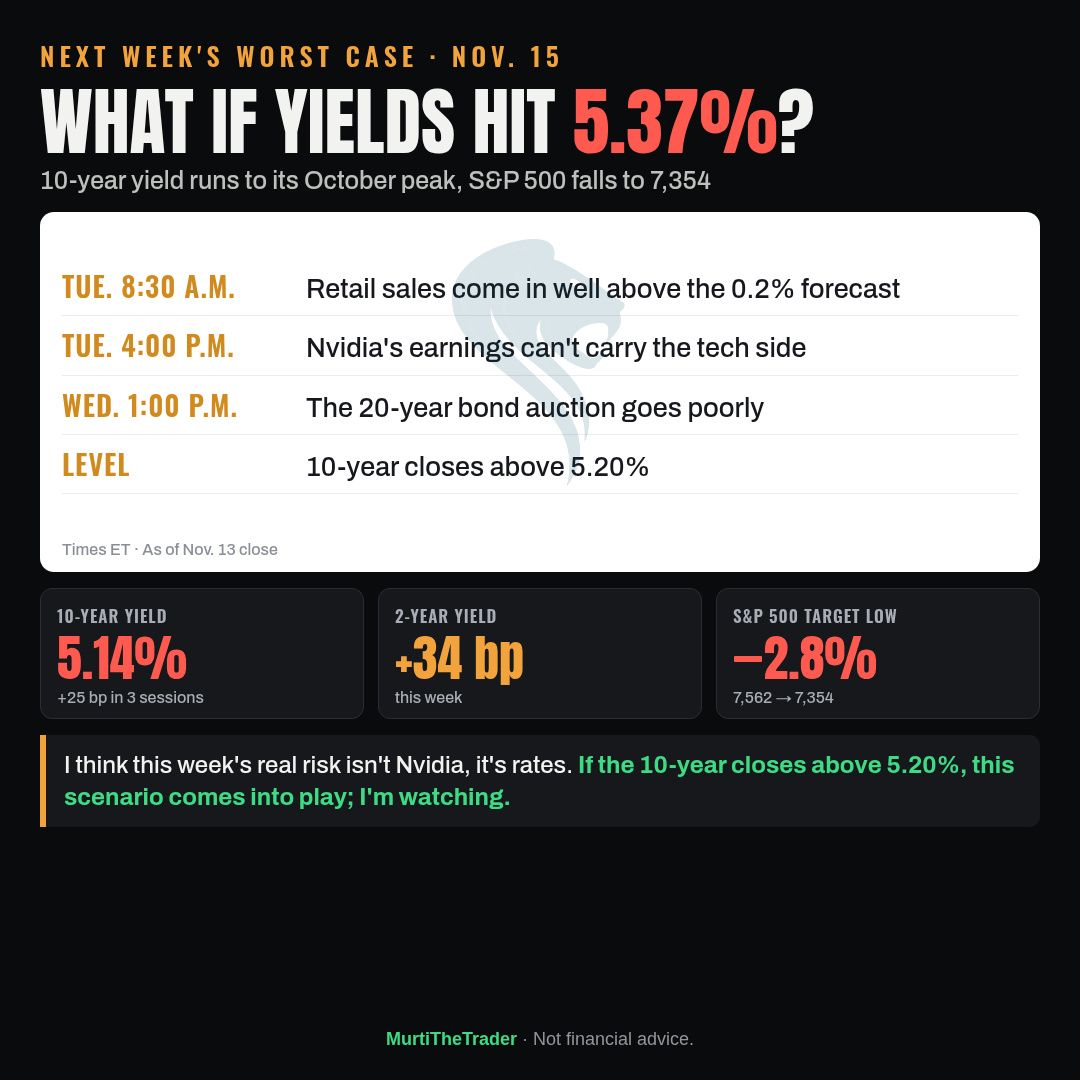
Next week's worst case: the 10-year yield runs from 5.14% to its October peak of 5.37%, and the S&P 500 falls from 7,562 to the Nov. 5 low of 7,354 (−2.8%).
→ Tue. 8:30 a.m. ET · If retail sales come in well above the 0.2% forecast
→ Tue. 4:00 p.m. ET · If Nvidia's earnings can't carry the tech side
→ Wed. 1:00 p.m. ET · If the 20-year bond auction goes poorly
I think the real risk isn't Nvidia, it's rates: the 2-year jumped 34 basis points this week. If the 10-year closes above 5.20%, this scenario comes into play; I'm watching.
#InterestRates #SP500
Watching: $SPY $NVDA
Next week's worst case: the 10-year yield runs from 5.14% to its October peak of 5.37%, and the S&P 500 falls from 7,562 to the Nov. 5 low of 7,354 (−2.8%).
→ Tue. 8:30 a.m. ET · If retail sales come in well above the 0.2% forecast
→ Tue. 4:00 p.m. ET · If Nvidia's earnings can't carry the tech side
→ Wed. 1:00 p.m. ET · If the 20-year bond auction goes poorly
I think the real risk isn't Nvidia, it's rates: the 2-year jumped 34 basis points this week. If the 10-year closes above 5.20%, this scenario comes into play; I'm watching.
#InterestRates #SP500
Watching: $SPY $NVDA
→ Tue. 8:30 a.m. ET · If retail sales come in well above the 0.2% forecast
→ Tue. 4:00 p.m. ET · If Nvidia's earnings can't carry the tech side
→ Wed. 1:00 p.m. ET · If the 20-year bond auction goes poorly
I think the real risk isn't Nvidia, it's rates: the 2-year jumped 34 basis points this week. If the 10-year closes above 5.20%, this scenario comes into play; I'm watching.
#InterestRates #SP500
Watching: $SPY $NVDA
400

See translation
The Index Backdoor That’s Keeping SpaceX in Focus👇
Bloomberg reported that Elon Musk may pursue a merger between SpaceX and Tesla to revive SpaceX’s stalled S&P 500 ambitions. Combining the companies could place the space business inside one of the benchmark’s largest existing constituents after SpaceX was denied a swift standalone entry only months earlier. Shares of SPCX still slipped 2.81% to $136.25 as traders remained cautious.
S&P 500 inclusion would potentially unlock substantial passive buying from index-tracking funds. The narrative arrives amid capital-intensive ambitions in AI infrastructure, orbital data centers, robotics, and Mars projects. Investors will now watch for confirmation of terms, valuation, governance structure, and regulatory path, alongside any near-term operational updates from SpaceX.
$SPCXB $SPCX.US $TSLAB #CoinVahini #SpaceX #Tesla #SP500
The Index Backdoor That’s Keeping SpaceX in Focus👇
Bloomberg reported that Elon Musk may pursue a merger between SpaceX and Tesla to revive SpaceX’s stalled S&P 500 ambitions. Combining the companies could place the space business inside one of the benchmark’s largest existing constituents after SpaceX was denied a swift standalone entry only months earlier. Shares of SPCX still slipped 2.81% to $136.25 as traders remained cautious.
S&P 500 inclusion would potentially unlock substantial passive buying from index-tracking funds. The narrative arrives amid capital-intensive ambitions in AI infrastructure, orbital data centers, robotics, and Mars projects. Investors will now watch for confirmation of terms, valuation, governance structure, and regulatory path, alongside any near-term operational updates from SpaceX.
$SPCXB $SPCX.US $TSLAB #CoinVahini #SpaceX #Tesla #SP500
Bloomberg reported that Elon Musk may pursue a merger between SpaceX and Tesla to revive SpaceX’s stalled S&P 500 ambitions. Combining the companies could place the space business inside one of the benchmark’s largest existing constituents after SpaceX was denied a swift standalone entry only months earlier. Shares of SPCX still slipped 2.81% to $136.25 as traders remained cautious.
S&P 500 inclusion would potentially unlock substantial passive buying from index-tracking funds. The narrative arrives amid capital-intensive ambitions in AI infrastructure, orbital data centers, robotics, and Mars projects. Investors will now watch for confirmation of terms, valuation, governance structure, and regulatory path, alongside any near-term operational updates from SpaceX.
$SPCXB $SPCX.US $TSLAB #CoinVahini #SpaceX #Tesla #SP500
532
·
--
Bullish
See translation
S&P 500 Buyers Are Fighting Back
⠀
The S&P 500 came under heavy pressure after NVIDIA CEO Jensen Huang’s resignation triggered fresh uncertainty across AI-related stocks.
But what caught my attention was the recovery.
Despite NVIDIA’s weakness, strength in other semiconductor names and sectors helped the index recover much of its early losses.
⠀
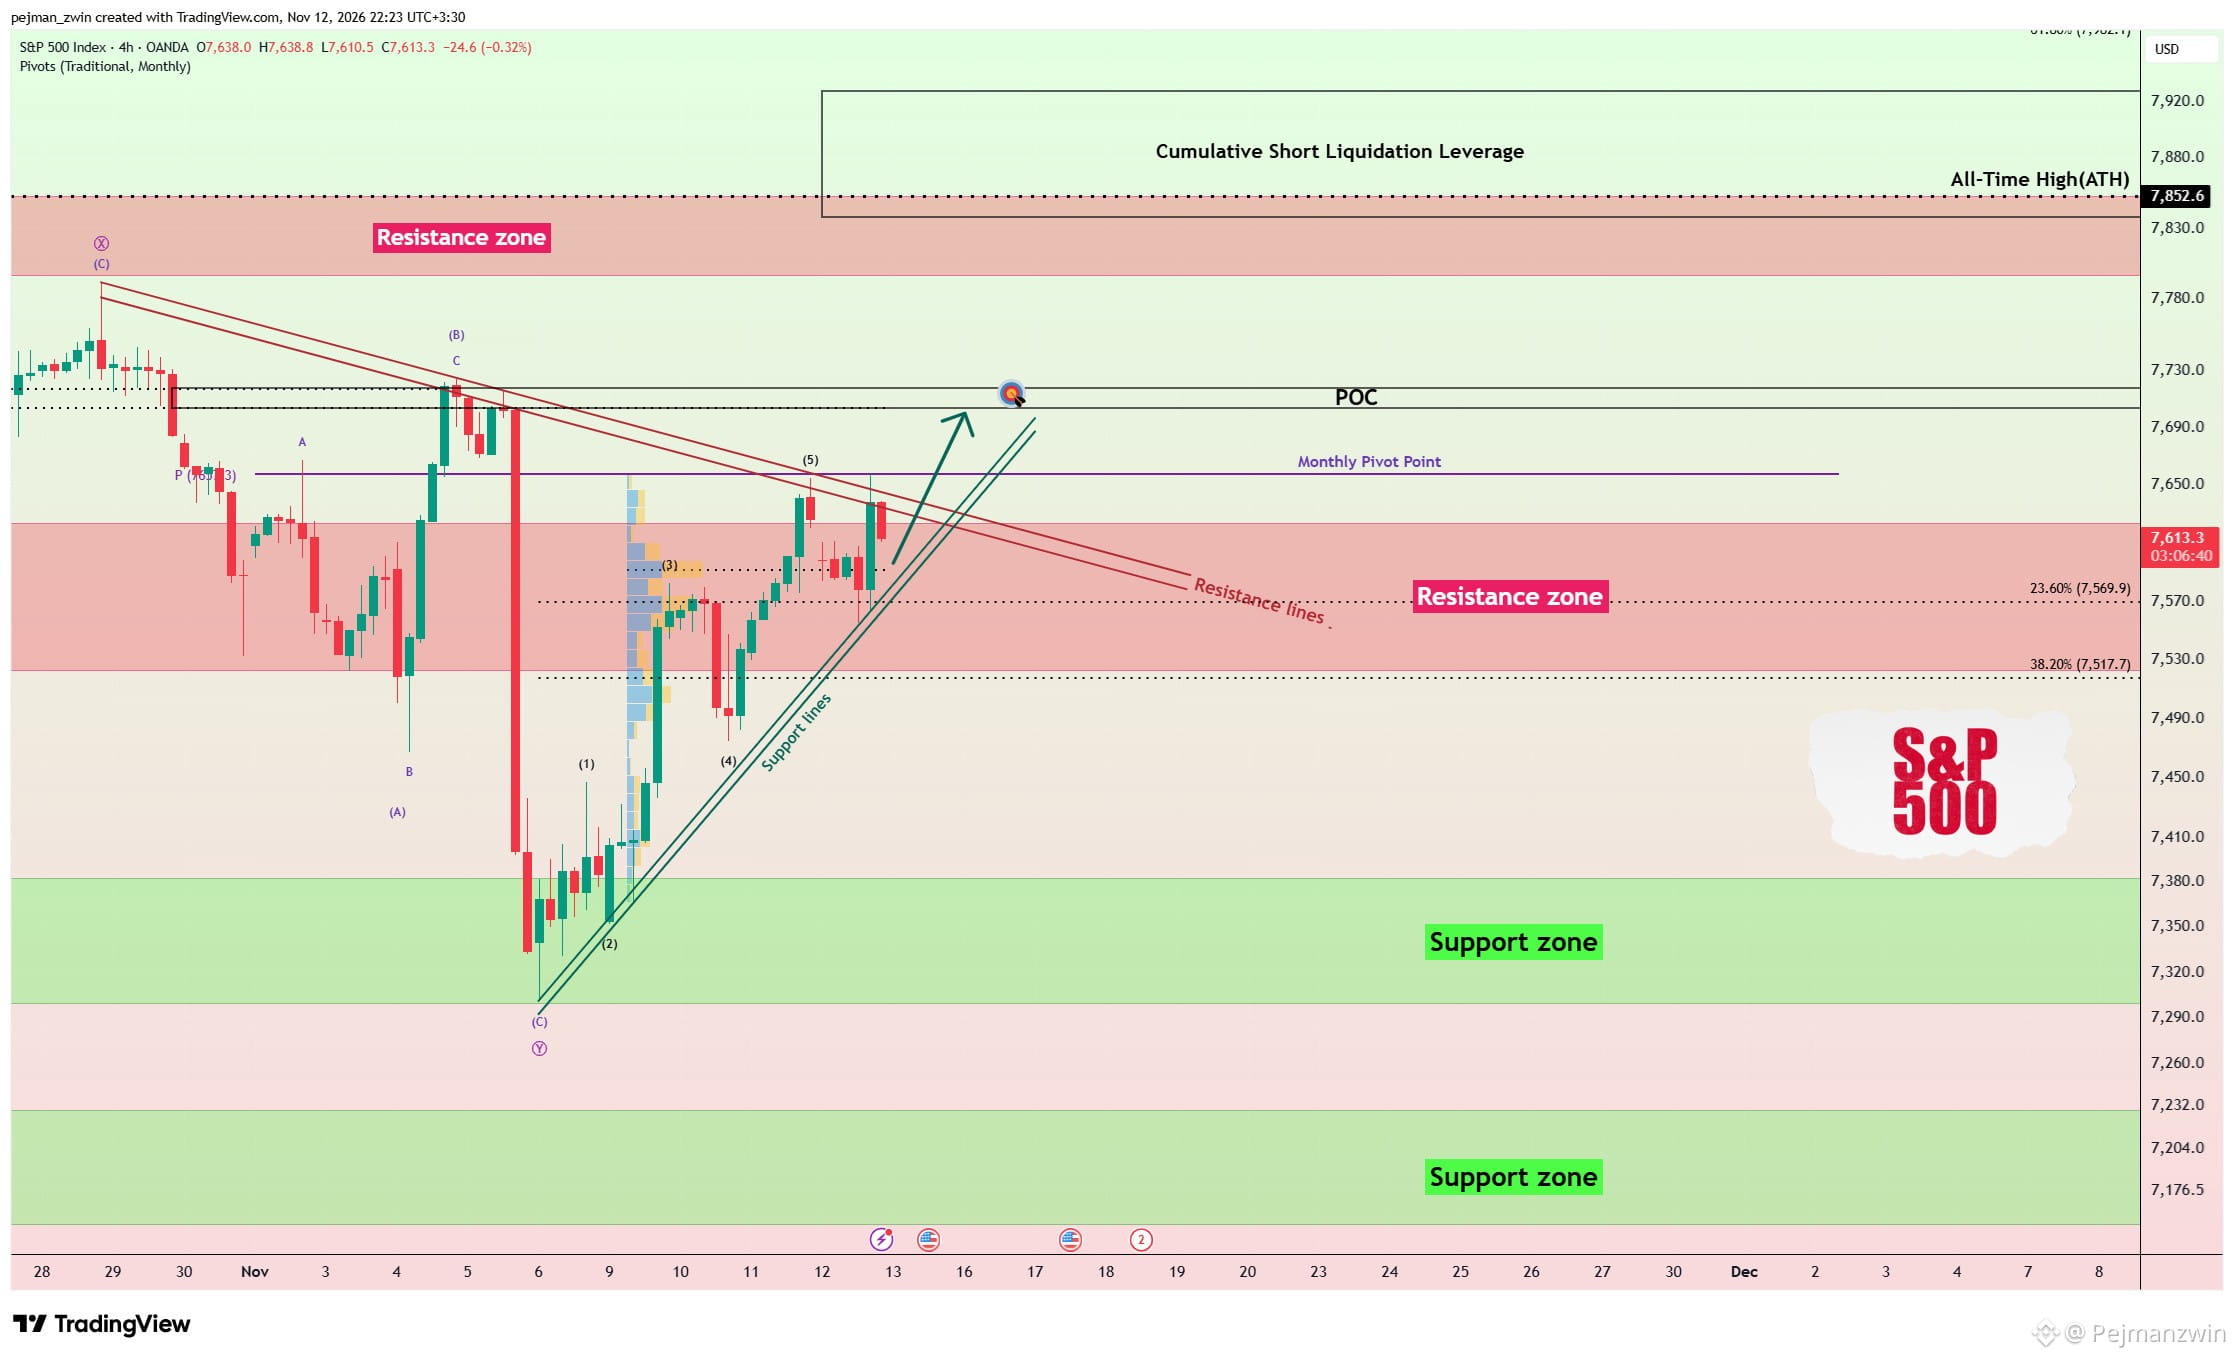
Technically, the S&P 500 is now challenging its Monthly Pivot Point and attempting to break above key Resistance Lines.
From an Elliott Wave perspective, the recent five-wave Impulsive Structure may be complete, so a short corrective move is still possible before another bullish leg.
⠀
As long as buyers defend the key $7,591 area, I’m watching for a move toward ($7,703-$7,716).
A clean breakout above that zone could reopen the path toward new highs.
⠀
My setup:
TP: $7,703
SL: $7,530
⠀
Bitcoin and Ethereum could also react strongly if U.S. equities make another sharp move, especially while broader risk sentiment remains fragile.
⠀
Which level comes first?
🟢 $7,703
🔴 $7,530
#SP500
S&P 500 Buyers Are Fighting Back
⠀
The S&P 500 came under heavy pressure after NVIDIA CEO Jensen Huang’s resignation triggered fresh uncertainty across AI-related stocks.
But what caught my attention was the recovery.
Despite NVIDIA’s weakness, strength in other semiconductor names and sectors helped the index recover much of its early losses.
⠀
Technically, the S&P 500 is now challenging its Monthly Pivot Point and attempting to break above key Resistance Lines.
From an Elliott Wave perspective, the recent five-wave Impulsive Structure may be complete, so a short corrective move is still possible before another bullish leg.
⠀
As long as buyers defend the key $7,591 area, I’m watching for a move toward ($7,703-$7,716).
A clean breakout above that zone could reopen the path toward new highs.
⠀
My setup:
TP: $7,703
SL: $7,530
⠀
Bitcoin and Ethereum could also react strongly if U.S. equities make another sharp move, especially while broader risk sentiment remains fragile.
⠀
Which level comes first?
🟢 $7,703
🔴 $7,530
#SP500
⠀
The S&P 500 came under heavy pressure after NVIDIA CEO Jensen Huang’s resignation triggered fresh uncertainty across AI-related stocks.
But what caught my attention was the recovery.
Despite NVIDIA’s weakness, strength in other semiconductor names and sectors helped the index recover much of its early losses.
⠀
Technically, the S&P 500 is now challenging its Monthly Pivot Point and attempting to break above key Resistance Lines.
From an Elliott Wave perspective, the recent five-wave Impulsive Structure may be complete, so a short corrective move is still possible before another bullish leg.
⠀
As long as buyers defend the key $7,591 area, I’m watching for a move toward ($7,703-$7,716).
A clean breakout above that zone could reopen the path toward new highs.
⠀
My setup:
TP: $7,703
SL: $7,530
⠀
Bitcoin and Ethereum could also react strongly if U.S. equities make another sharp move, especially while broader risk sentiment remains fragile.
⠀
Which level comes first?
🟢 $7,703
🔴 $7,530
#SP500
2
2
357
·
--
See translation
S&P 500 Today & Crypto Link |
📅 Nov 12, 2026
✅ Quick overview
S&P 500 is the main US stock index. Right now BTC still has positive correlation with S&P 500. When S&P 500 moves sharply, crypto on Binance usually follows.
✅ Today’s macro picture
S&P 500 is muted / slightly down, pressured by hot CPI inflation worries and strong US Dollar. Risk sentiment is cautious.
- If S&P 500 drops further → BTC, ETH, altcoins tend to sell off
- If S&P 500 bounces back → crypto can get relief rally
- Small caps (AGT, JCT) move more violently than BTC when S&P swings
✅ Why traders watch S&P 500
Big institutional funds trade both stocks and crypto. When they cut risk in equities, they also reduce crypto positions, triggering futures liquidations on Binance.
✅ Scenarios
🟢 S&P 500 green = risk on, better chance for BTC to hold $74K support
🔴 S&P 500 red = risk off, altcoins will face heavier selling pressure
✅ Trader tip
Watch S&P futures before US market open. It is one of the top macro signals together with CPI, DXY and oil price.
High leverage is dangerous when S&P turns volatile.
⚠️ Not financial advice, DYOR.
#SP500 #BTC #CryptoMacro #BinanceTrading
S&P 500 Today & Crypto Link |
📅 Nov 12, 2026
✅ Quick overview
S&P 500 is the main US stock index. Right now BTC still has positive correlation with S&P 500. When S&P 500 moves sharply, crypto on Binance usually follows.
✅ Today’s macro picture
S&P 500 is muted / slightly down, pressured by hot CPI inflation worries and strong US Dollar. Risk sentiment is cautious.
- If S&P 500 drops further → BTC, ETH, altcoins tend to sell off
- If S&P 500 bounces back → crypto can get relief rally
- Small caps (AGT, JCT) move more violently than BTC when S&P swings
✅ Why traders watch S&P 500
Big institutional funds trade both stocks and crypto. When they cut risk in equities, they also reduce crypto positions, triggering futures liquidations on Binance.
✅ Scenarios
🟢 S&P 500 green = risk on, better chance for BTC to hold $74K support
🔴 S&P 500 red = risk off, altcoins will face heavier selling pressure
✅ Trader tip
Watch S&P futures before US market open. It is one of the top macro signals together with CPI, DXY and oil price.
High leverage is dangerous when S&P turns volatile.
⚠️ Not financial advice, DYOR.
#SP500 #BTC #CryptoMacro #BinanceTrading
📅 Nov 12, 2026
✅ Quick overview
S&P 500 is the main US stock index. Right now BTC still has positive correlation with S&P 500. When S&P 500 moves sharply, crypto on Binance usually follows.
✅ Today’s macro picture
S&P 500 is muted / slightly down, pressured by hot CPI inflation worries and strong US Dollar. Risk sentiment is cautious.
- If S&P 500 drops further → BTC, ETH, altcoins tend to sell off
- If S&P 500 bounces back → crypto can get relief rally
- Small caps (AGT, JCT) move more violently than BTC when S&P swings
✅ Why traders watch S&P 500
Big institutional funds trade both stocks and crypto. When they cut risk in equities, they also reduce crypto positions, triggering futures liquidations on Binance.
✅ Scenarios
🟢 S&P 500 green = risk on, better chance for BTC to hold $74K support
🔴 S&P 500 red = risk off, altcoins will face heavier selling pressure
✅ Trader tip
Watch S&P futures before US market open. It is one of the top macro signals together with CPI, DXY and oil price.
High leverage is dangerous when S&P turns volatile.
⚠️ Not financial advice, DYOR.
#SP500 #BTC #CryptoMacro #BinanceTrading
32

See translation
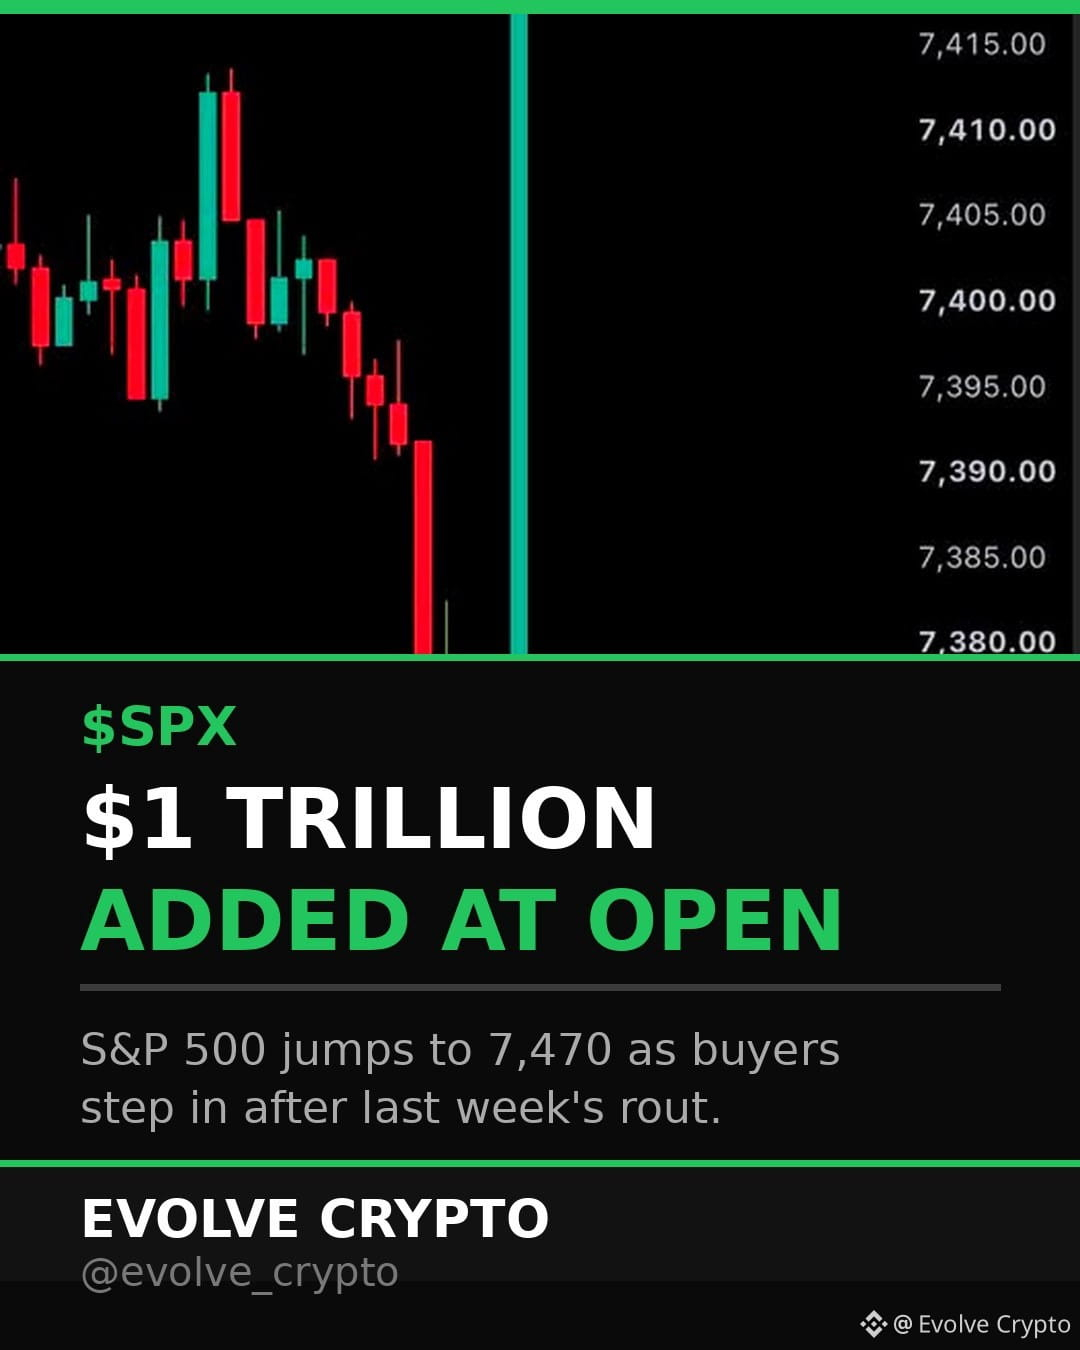
JUST IN: 🇺🇸 US stocks added $1 trillion in market value at the open, with the S&P 500 jumping to 7,470 as buyers stepped in after last week's $3 trillion sell-off.
The rebound comes even as Nvidia slides on its CEO probe — the wider market is buying the dip.
#StockMarket #SP500 #Crypto
DYOR. This is not financial advice.
JUST IN: 🇺🇸 US stocks added $1 trillion in market value at the open, with the S&P 500 jumping to 7,470 as buyers stepped in after last week's $3 trillion sell-off.
The rebound comes even as Nvidia slides on its CEO probe — the wider market is buying the dip.
#StockMarket #SP500 #Crypto
DYOR. This is not financial advice.
The rebound comes even as Nvidia slides on its CEO probe — the wider market is buying the dip.
#StockMarket #SP500 #Crypto
DYOR. This is not financial advice.
12

·
--
Article
WALL STREET AFTER THE SHOCK AND THE JOBS REPORT (NFP): ABSORPTION AT 7,350 OR REDISTRIBUTION?Thursday's selloff on Wall Street—the worst since April 2025, with the Dow Jones losing 1,833 points (-3.44%), the S&P 500 falling 4.36% to 7,353.73, the Nasdaq down 5.52%, chip stocks tumbling nearly 12%, all 11 sectors in the red, and Japan's Nikkei plunging 6% today—has just collided this Friday with a much stronger-than-expected jobs report.
1. What today's Friday October NFP report showed:
- Nonfarm payrolls: +165,000 jobs versus the consensus estimate of 65,000–70,000.
WALL STREET AFTER THE SHOCK AND THE JOBS REPORT (NFP): ABSORPTION AT 7,350 OR REDISTRIBUTION?
Thursday's selloff on Wall Street—the worst since April 2025, with the Dow Jones losing 1,833 points (-3.44%), the S&P 500 falling 4.36% to 7,353.73, the Nasdaq down 5.52%, chip stocks tumbling nearly 12%, all 11 sectors in the red, and Japan's Nikkei plunging 6% today—has just collided this Friday with a much stronger-than-expected jobs report.
1. What today's Friday October NFP report showed:
- Nonfarm payrolls: +165,000 jobs versus the consensus estimate of 65,000–70,000.
1. What today's Friday October NFP report showed:
- Nonfarm payrolls: +165,000 jobs versus the consensus estimate of 65,000–70,000.
225
Log in to explore more content
Join global crypto users on Binance Square
⚡️ Get latest and useful information about crypto.
💬 Trusted by the world’s largest crypto exchange.
👍 Discover real insights from verified creators.
Email / Phone number
Trending Topics
1
#BTCReboundsAbove$60KAmidWhaleDipBuying
87,462 views
374 Discussing
2
#SolanaSets2027RoadmapToDoubleComputeCapacity
72,115 views
1,091 Discussing
3
#CaliforniaNvidiaProbeExaminesPotentialCriminalViolations
19,625 views
152 Discussing
4
#BlackRockLaunchesHKDollarDigitalLiquidityFund
60,494 views
824 Discussing
5
#NvidiaLoses$2.7TrillionInMonthAndAHalf
82,199 views
322 Discussing
6
#GlobalStocksFaceLongestLosingStreakSince2023
590,969 views
3,548 Discussing
7
#BlackRockIBITPostsRecord$541MSingleDayOutflow
100,178 views
186 Discussing
8
#AnthropicPlungesTowardIPOPriceonDay2
329,451 views
2,385 Discussing
9
#TwentyOneCapitalAdds172.25BTC
178,604 views
1,696 Discussing
10
#HKBillWouldExcludeTokenizedDepositsFromVirtualAssets
19,138 views
109 Discussing