
#solusdt
solusdt
7M views
13,732 Discussing
Hot
Latest

·
--
See translation
{future}(SOLUSDT)
$SOL at $92.18 📉
Down -2.26% today, but zoom out. 24H High was 95.90, Low was 91.53. Volume? 1.60B USDT.
This is not a crash. This is $SOL breathing.
Everyone wants to buy at 91.53 and sell at 95.90. But nobody wants to hold through the middle.
Patience > Prediction.
#solana #SOLUSDT #crypto #cryptotrading
$SOL at $92.18 📉
Down -2.26% today, but zoom out. 24H High was 95.90, Low was 91.53. Volume? 1.60B USDT.
This is not a crash. This is $SOL breathing.
Everyone wants to buy at 91.53 and sell at 95.90. But nobody wants to hold through the middle.
Patience > Prediction.
#solana #SOLUSDT #crypto #cryptotrading
$SOL at $92.18 📉
Down -2.26% today, but zoom out. 24H High was 95.90, Low was 91.53. Volume? 1.60B USDT.
This is not a crash. This is $SOL breathing.
Everyone wants to buy at 91.53 and sell at 95.90. But nobody wants to hold through the middle.
Patience > Prediction.
#solana #SOLUSDT #crypto #cryptotrading
1
2
1.7k

See translation
SOL is stuck in a descending channel after yesterday’s rally, and the price is flirting with the 22.5‑level resistance. Volume is thinning, hinting the next move could be down.
━━━━━━━━━━━━━━━━━━━━━
🔴 $SOL SHORT 📉
━━━━━━━━━━━━━━━━━━━━━
📍 Entry Range: $92.8371 – $93.0229
🛑 Stop Loss: $95.7179 (-3.0%)
🎯 TP1: $91.5361 (+1.5%)
🏆 TP2: $88.2835 (+5.0%)
⚡ R/R Ratio: 1:1.7
📊 Confidence: 65%
━━━━━━━━━━━━━━━━━━━━━
The market structure broke lower (CHoCH) and the CVD turned negative, confirming seller pressure. A fair‑value gap lines up right under the current price and the bullish order block turned into a bearish OB, creating a POI where the OB and FVG overlap. All signs point to a short swing with the next swing low as the target.
A 3.0% stop is relatively tight on this volatility, so a 5‑10× leverage range keeps risk in line.
Take half profit at the first target around 22.0 to lock in the move.
Not financial advice — trade only what you can afford to lose 🙏
$SOL #SOLUSDT #THORChain #TradingSignals #Write2Earn
SOL is stuck in a descending channel after yesterday’s rally, and the price is flirting with the 22.5‑level resistance. Volume is thinning, hinting the next move could be down.
━━━━━━━━━━━━━━━━━━━━━
🔴 $SOL SHORT 📉
━━━━━━━━━━━━━━━━━━━━━
📍 Entry Range: $92.8371 – $93.0229
🛑 Stop Loss: $95.7179 (-3.0%)
🎯 TP1: $91.5361 (+1.5%)
🏆 TP2: $88.2835 (+5.0%)
⚡ R/R Ratio: 1:1.7
📊 Confidence: 65%
━━━━━━━━━━━━━━━━━━━━━
The market structure broke lower (CHoCH) and the CVD turned negative, confirming seller pressure. A fair‑value gap lines up right under the current price and the bullish order block turned into a bearish OB, creating a POI where the OB and FVG overlap. All signs point to a short swing with the next swing low as the target.
A 3.0% stop is relatively tight on this volatility, so a 5‑10× leverage range keeps risk in line.
Take half profit at the first target around 22.0 to lock in the move.
Not financial advice — trade only what you can afford to lose 🙏
$SOL #SOLUSDT #THORChain #TradingSignals #Write2Earn
━━━━━━━━━━━━━━━━━━━━━
🔴 $SOL SHORT 📉
━━━━━━━━━━━━━━━━━━━━━
📍 Entry Range: $92.8371 – $93.0229
🛑 Stop Loss: $95.7179 (-3.0%)
🎯 TP1: $91.5361 (+1.5%)
🏆 TP2: $88.2835 (+5.0%)
⚡ R/R Ratio: 1:1.7
📊 Confidence: 65%
━━━━━━━━━━━━━━━━━━━━━
The market structure broke lower (CHoCH) and the CVD turned negative, confirming seller pressure. A fair‑value gap lines up right under the current price and the bullish order block turned into a bearish OB, creating a POI where the OB and FVG overlap. All signs point to a short swing with the next swing low as the target.
A 3.0% stop is relatively tight on this volatility, so a 5‑10× leverage range keeps risk in line.
Take half profit at the first target around 22.0 to lock in the move.
Not financial advice — trade only what you can afford to lose 🙏
$SOL #SOLUSDT #THORChain #TradingSignals #Write2Earn
50

·
--
See translation
🚨 MAJOR ORDER FLOW IMBALANCE: $SOL
The retail crowd is shaking, but the tape tells a different story. While the masses see a dip, WHALES are quietly absorbing every sell order. We are seeing a massive CVD divergence; they want you to panic short here, but the institutional accumulation is undeniable. Liquidity is being swept to trap the weak hands before the real move starts. This is a classic manipulation play.
ENTRY: 93.76 $SOL
SL: 92.81
TP1: 94.94
TP2: 97.50
RR: 1:1.2+
Is $SOL just hunting for more liquidity or are we seeing a permanent supply flip?
#SOLUSDT #BinanceSquare #SlowSclap #TradingAnalysis
🚨 MAJOR ORDER FLOW IMBALANCE: $SOL
The retail crowd is shaking, but the tape tells a different story. While the masses see a dip, WHALES are quietly absorbing every sell order. We are seeing a massive CVD divergence; they want you to panic short here, but the institutional accumulation is undeniable. Liquidity is being swept to trap the weak hands before the real move starts. This is a classic manipulation play.
ENTRY: 93.76 $SOL
SL: 92.81
TP1: 94.94
TP2: 97.50
RR: 1:1.2+
Is $SOL just hunting for more liquidity or are we seeing a permanent supply flip?
#SOLUSDT #BinanceSquare #SlowSclap #TradingAnalysis
The retail crowd is shaking, but the tape tells a different story. While the masses see a dip, WHALES are quietly absorbing every sell order. We are seeing a massive CVD divergence; they want you to panic short here, but the institutional accumulation is undeniable. Liquidity is being swept to trap the weak hands before the real move starts. This is a classic manipulation play.
ENTRY: 93.76 $SOL
SL: 92.81
TP1: 94.94
TP2: 97.50
RR: 1:1.2+
Is $SOL just hunting for more liquidity or are we seeing a permanent supply flip?
#SOLUSDT #BinanceSquare #SlowSclap #TradingAnalysis

·
--
Bullish
See translation
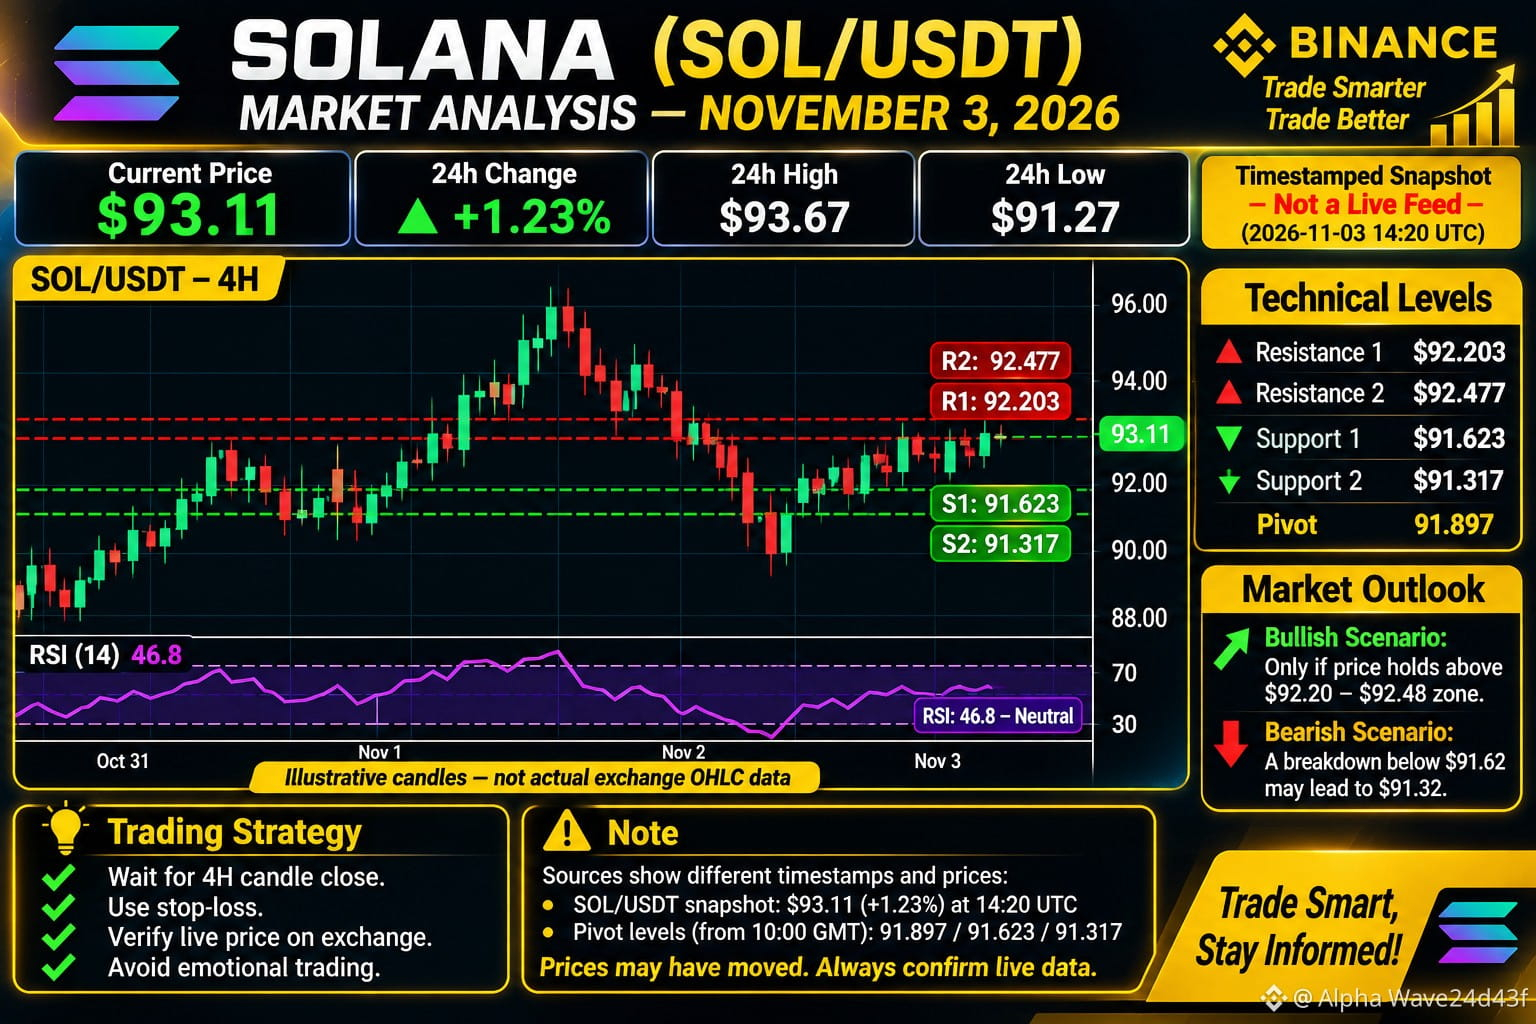
$SOL 🚀 SOLANA (SOL/USDT) – Market Analysis | November 3, 2026
SOL is trading around $93.11 in the latest timestamped snapshot, showing a gain of approximately 1.23%.
📊 Key Technical Levels
🔴 Resistance 1: $92.20
🔴 Resistance 2: $92.48
🟢 Support 1: $91.62
🟢 Support 2: $91.32
📈 Bullish Scenario: Sustained strength and a successful retest above the resistance zone could support further recovery.
📉 Bearish Scenario: A breakdown below $91.62 could bring $91.32 into focus.
📉 Momentum: RSI is around 46.8 (neutral), while the daily technical outlook remains bearish.
⚠️ My View: SOL needs stronger buying pressure to confirm a trend reversal. Wait for candle-close confirmation and manage risk carefully.
#SOL #Solana #SOLUSDT #CryptoAnalysis #BinanceSquare
{spot}(SOLUSDT)
$SOL 🚀 SOLANA (SOL/USDT) – Market Analysis | November 3, 2026
SOL is trading around $93.11 in the latest timestamped snapshot, showing a gain of approximately 1.23%.
📊 Key Technical Levels
🔴 Resistance 1: $92.20
🔴 Resistance 2: $92.48
🟢 Support 1: $91.62
🟢 Support 2: $91.32
📈 Bullish Scenario: Sustained strength and a successful retest above the resistance zone could support further recovery.
📉 Bearish Scenario: A breakdown below $91.62 could bring $91.32 into focus.
📉 Momentum: RSI is around 46.8 (neutral), while the daily technical outlook remains bearish.
⚠️ My View: SOL needs stronger buying pressure to confirm a trend reversal. Wait for candle-close confirmation and manage risk carefully.
#SOL #Solana #SOLUSDT #CryptoAnalysis #BinanceSquare
SOL is trading around $93.11 in the latest timestamped snapshot, showing a gain of approximately 1.23%.
📊 Key Technical Levels
🔴 Resistance 1: $92.20
🔴 Resistance 2: $92.48
🟢 Support 1: $91.62
🟢 Support 2: $91.32
📈 Bullish Scenario: Sustained strength and a successful retest above the resistance zone could support further recovery.
📉 Bearish Scenario: A breakdown below $91.62 could bring $91.32 into focus.
📉 Momentum: RSI is around 46.8 (neutral), while the daily technical outlook remains bearish.
⚠️ My View: SOL needs stronger buying pressure to confirm a trend reversal. Wait for candle-close confirmation and manage risk carefully.
#SOL #Solana #SOLUSDT #CryptoAnalysis #BinanceSquare
59

·
--
See translation
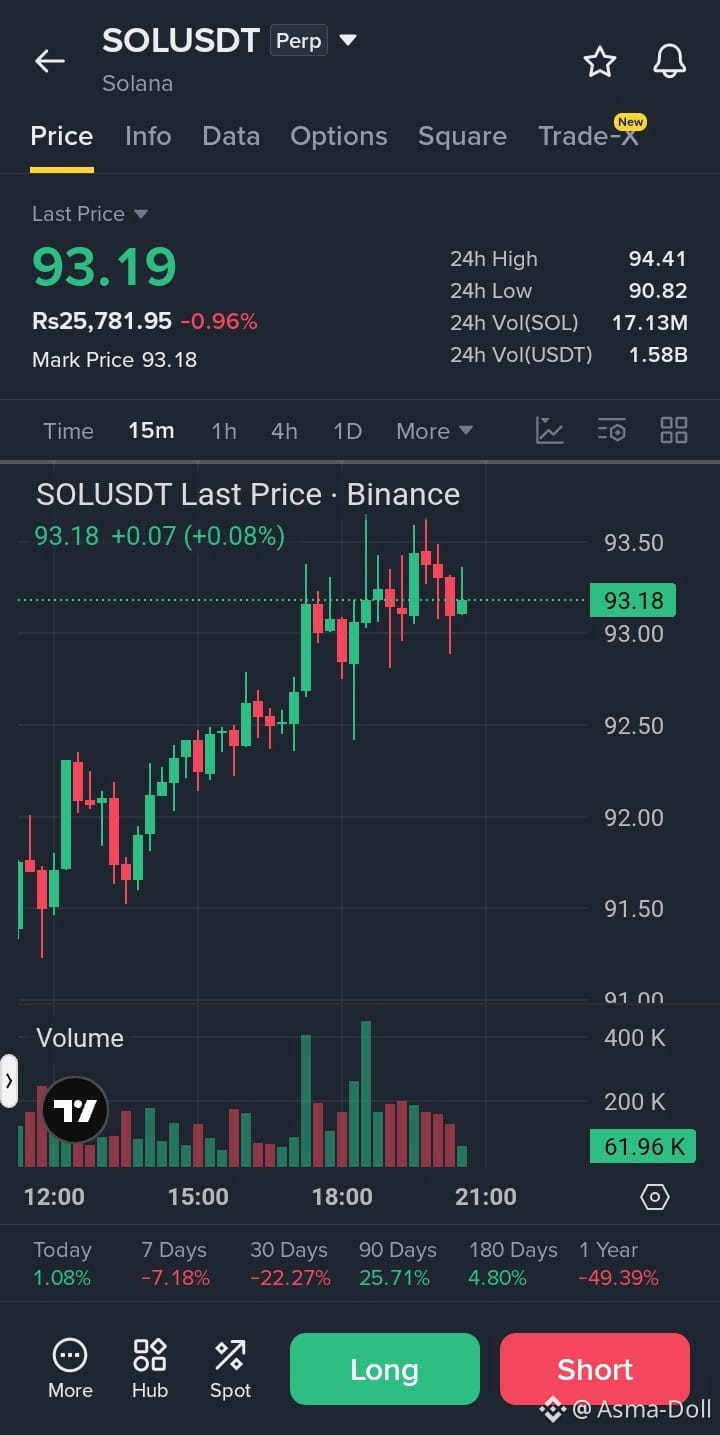
🔴 $SOL /USDT – SHORT SIGNAL
Solana (Perpetual Futures)
Trade Plan:
Direction: SHORT 📉
Entry Zone: $93.00 – $93.50
Stop Loss (SL): $95.00
Take Profits:
TP1: $92.00
TP2: $91.00
TP3: $89.50
Trade here $SOL
{future}(SOLUSDT)
Analysis:
Price facing resistance near $94.40.
Short-term momentum remains weak.
7-day performance: -7.18%.
30-day performance: -22.27%, showing broader weakness.
Price is trading close to the 24H low of $90.82.
A breakdown below $92.80 could trigger further selling pressure.
Confirmation: A clean 15m/1H candle close below $92.80, supported by strong selling volume, confirms bearish momentum.
Risk-to-Reward:
TP1: 0.6:1
TP2: 1.3:1
TP3: 2.3:1
⚠️ Wait for confirmation before entering. Avoid chasing the price, and keep risk controlled.
#SOLUSDT #SOL #CryptoSignals #BinanceFutures #ShortSignal
🔴 $SOL /USDT – SHORT SIGNAL
Solana (Perpetual Futures)
Trade Plan:
Direction: SHORT 📉
Entry Zone: $93.00 – $93.50
Stop Loss (SL): $95.00
Take Profits:
TP1: $92.00
TP2: $91.00
TP3: $89.50
Trade here $SOL
Analysis:
Price facing resistance near $94.40.
Short-term momentum remains weak.
7-day performance: -7.18%.
30-day performance: -22.27%, showing broader weakness.
Price is trading close to the 24H low of $90.82.
A breakdown below $92.80 could trigger further selling pressure.
Confirmation: A clean 15m/1H candle close below $92.80, supported by strong selling volume, confirms bearish momentum.
Risk-to-Reward:
TP1: 0.6:1
TP2: 1.3:1
TP3: 2.3:1
⚠️ Wait for confirmation before entering. Avoid chasing the price, and keep risk controlled.
#SOLUSDT #SOL #CryptoSignals #BinanceFutures #ShortSignal
Solana (Perpetual Futures)
Trade Plan:
Direction: SHORT 📉
Entry Zone: $93.00 – $93.50
Stop Loss (SL): $95.00
Take Profits:
TP1: $92.00
TP2: $91.00
TP3: $89.50
Trade here $SOL
Analysis:
Price facing resistance near $94.40.
Short-term momentum remains weak.
7-day performance: -7.18%.
30-day performance: -22.27%, showing broader weakness.
Price is trading close to the 24H low of $90.82.
A breakdown below $92.80 could trigger further selling pressure.
Confirmation: A clean 15m/1H candle close below $92.80, supported by strong selling volume, confirms bearish momentum.
Risk-to-Reward:
TP1: 0.6:1
TP2: 1.3:1
TP3: 2.3:1
⚠️ Wait for confirmation before entering. Avoid chasing the price, and keep risk controlled.
#SOLUSDT #SOL #CryptoSignals #BinanceFutures #ShortSignal
14
·
--
Bullish
Verified
See translation
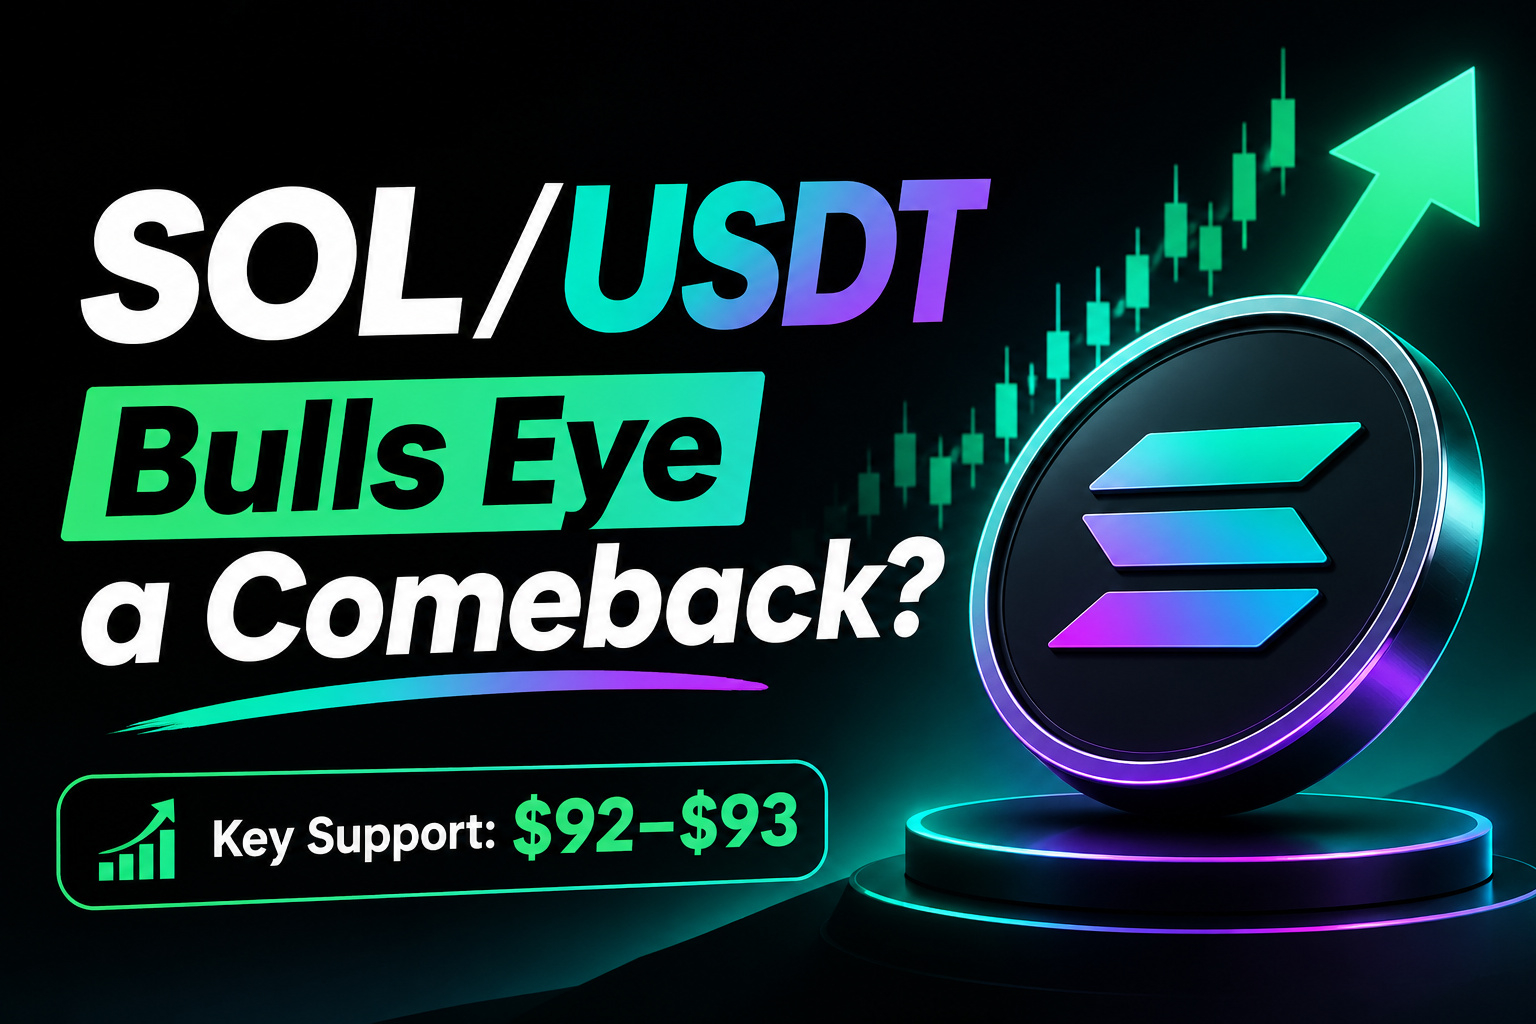
SOL/USDT: Solana Is Testing a Crucial Support Zone — Could Bulls Stage a Comeback? 🚀
$SOL is facing short-term selling pressure, but the bigger opportunity may be developing around its current support zone.
As of November 2, SOL is trading around $94, following a recent decline. However, its ecosystem continues to show meaningful progress, giving long-term bulls reasons to remain interested.
One major development is the Alpenglow upgrade, activated on October 21. It aims to dramatically reduce transaction finality times, potentially making Solana more attractive for DeFi, payments, and high-speed applications.
$SOL expanding stablecoin activity, tokenized assets, and decentralized trading ecosystem also strengthen its long-term growth narrative.
What Should Traders Watch?
- $92–$93: Important support area. Holding this zone could encourage buyers to step in.
- $99–$100: First recovery target and important resistance.
- $104–$109: A stronger bullish recovery zone if buying volume returns.
{future}(SOLUSDT)
Bullish Scenario: If $SOL maintains support around $92–$93 and reclaims $99–$100 with strong volume, momentum could gradually shift in favor of buyers.
Risk: A decisive breakdown below $92 could expose SOL to further downside, especially if broader market sentiment remains weak.
My View: Solana's fundamentals remain interesting despite short-term price weakness. I’m watching the $92–$93 region closely because a confirmed rebound from this area could provide the first sign of renewed bullish momentum.
Do you think SOL can reclaim $100 before November ends?
#SOL #Solana #SOLUSDT #CryptoMarket #BİNANCESQUARE
SOL/USDT: Solana Is Testing a Crucial Support Zone — Could Bulls Stage a Comeback? 🚀
$SOL is facing short-term selling pressure, but the bigger opportunity may be developing around its current support zone.
As of November 2, SOL is trading around $94, following a recent decline. However, its ecosystem continues to show meaningful progress, giving long-term bulls reasons to remain interested.
One major development is the Alpenglow upgrade, activated on October 21. It aims to dramatically reduce transaction finality times, potentially making Solana more attractive for DeFi, payments, and high-speed applications.
$SOL expanding stablecoin activity, tokenized assets, and decentralized trading ecosystem also strengthen its long-term growth narrative.
What Should Traders Watch?
- $92–$93: Important support area. Holding this zone could encourage buyers to step in.
- $99–$100: First recovery target and important resistance.
- $104–$109: A stronger bullish recovery zone if buying volume returns.
Bullish Scenario: If $SOL maintains support around $92–$93 and reclaims $99–$100 with strong volume, momentum could gradually shift in favor of buyers.
Risk: A decisive breakdown below $92 could expose SOL to further downside, especially if broader market sentiment remains weak.
My View: Solana's fundamentals remain interesting despite short-term price weakness. I’m watching the $92–$93 region closely because a confirmed rebound from this area could provide the first sign of renewed bullish momentum.
Do you think SOL can reclaim $100 before November ends?
#SOL #Solana #SOLUSDT #CryptoMarket #BİNANCESQUARE
$SOL is facing short-term selling pressure, but the bigger opportunity may be developing around its current support zone.
As of November 2, SOL is trading around $94, following a recent decline. However, its ecosystem continues to show meaningful progress, giving long-term bulls reasons to remain interested.
One major development is the Alpenglow upgrade, activated on October 21. It aims to dramatically reduce transaction finality times, potentially making Solana more attractive for DeFi, payments, and high-speed applications.
$SOL expanding stablecoin activity, tokenized assets, and decentralized trading ecosystem also strengthen its long-term growth narrative.
What Should Traders Watch?
- $92–$93: Important support area. Holding this zone could encourage buyers to step in.
- $99–$100: First recovery target and important resistance.
- $104–$109: A stronger bullish recovery zone if buying volume returns.
Bullish Scenario: If $SOL maintains support around $92–$93 and reclaims $99–$100 with strong volume, momentum could gradually shift in favor of buyers.
Risk: A decisive breakdown below $92 could expose SOL to further downside, especially if broader market sentiment remains weak.
My View: Solana's fundamentals remain interesting despite short-term price weakness. I’m watching the $92–$93 region closely because a confirmed rebound from this area could provide the first sign of renewed bullish momentum.
Do you think SOL can reclaim $100 before November ends?
#SOL #Solana #SOLUSDT #CryptoMarket #BİNANCESQUARE
Belinha Flor:
simmmm
1
1
1.2k

·
--
See translation
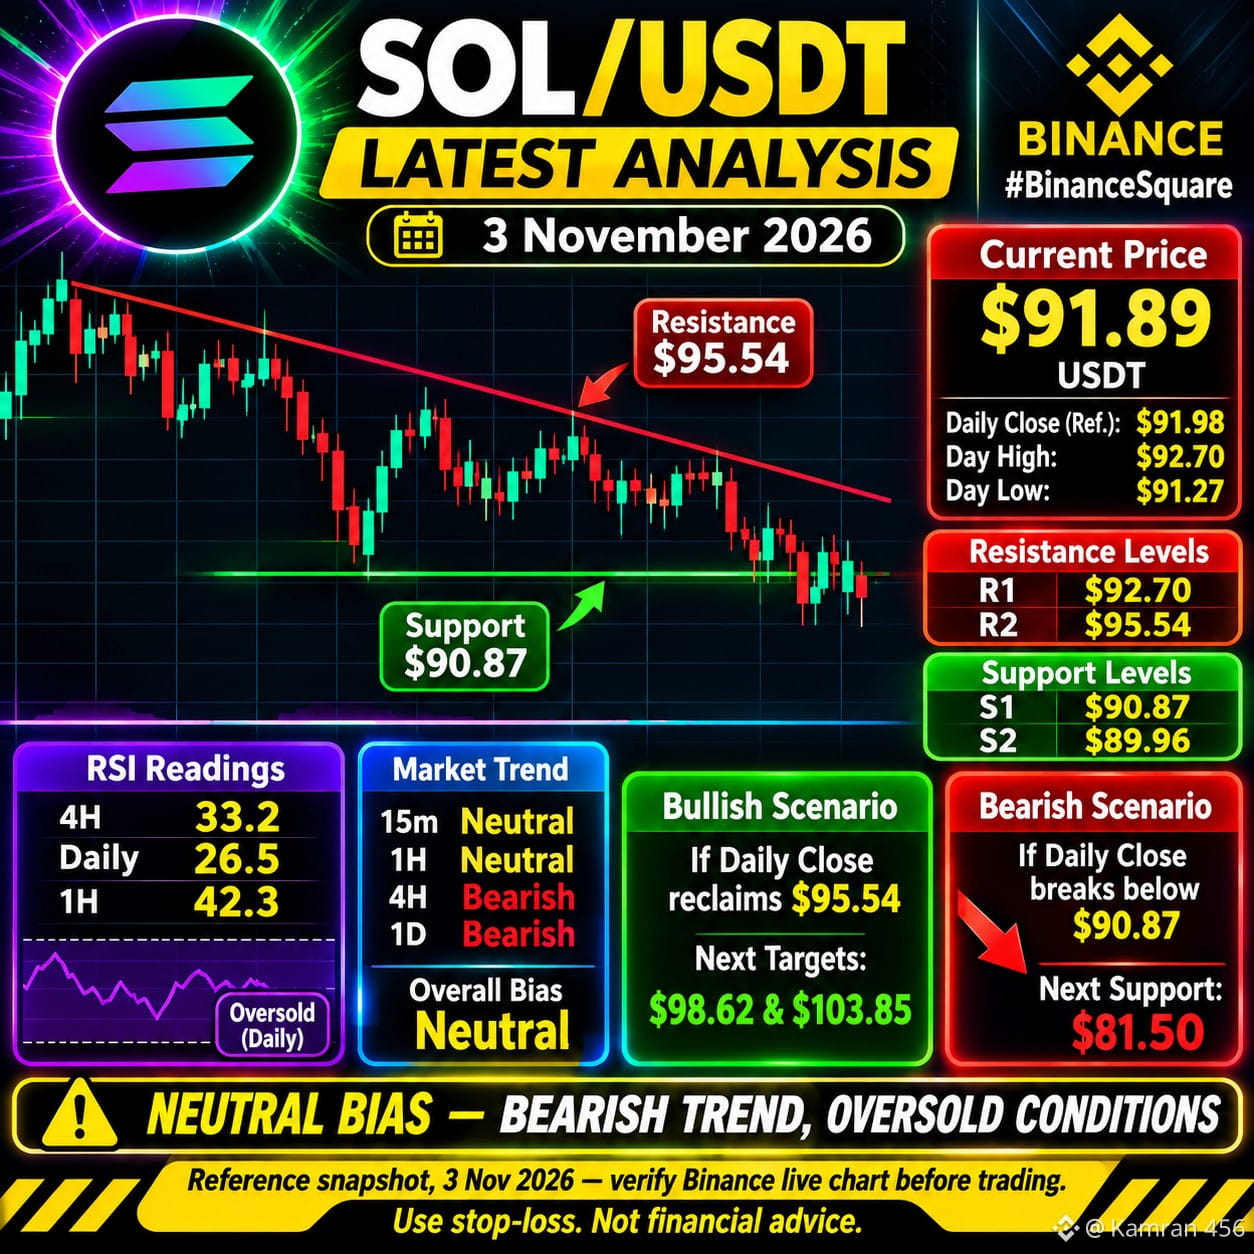
📊 $SOL USDT LATEST ANALYSIS | 3 NOVEMBER 2026
💰 Reference Price: $91.89
📉 Market Overview:
SOL is showing bearish pressure on 4H and daily timeframes. RSI is in the oversold zone, so a short-term bounce is possible, but trend reversal is not confirmed.
🟢 Support Levels:
• $90.87
• $89.96
• $81.50
🔴 Resistance Levels:
• $92.70
• $95.54
• $98.62
📈 Bullish Scenario: A confirmed recovery above $92.70, followed by a daily close above $95.54, could improve momentum.
📉 Bearish Scenario: A daily close below $90.87 may expose the $81.50 support zone.
📌 My View: Neutral bias in a bearish trend. Wait for confirmation instead of chasing trades.
⚠️ Reference snapshot only. Verify Binance live prices before trading. Use proper risk management.
#SOLUSDT #SOL #binanc
{spot}(SOLUSDT)
#CryptoAnalysis #TechnicalAnalysis
📊 $SOL USDT LATEST ANALYSIS | 3 NOVEMBER 2026
💰 Reference Price: $91.89
📉 Market Overview:
SOL is showing bearish pressure on 4H and daily timeframes. RSI is in the oversold zone, so a short-term bounce is possible, but trend reversal is not confirmed.
🟢 Support Levels:
• $90.87
• $89.96
• $81.50
🔴 Resistance Levels:
• $92.70
• $95.54
• $98.62
📈 Bullish Scenario: A confirmed recovery above $92.70, followed by a daily close above $95.54, could improve momentum.
📉 Bearish Scenario: A daily close below $90.87 may expose the $81.50 support zone.
📌 My View: Neutral bias in a bearish trend. Wait for confirmation instead of chasing trades.
⚠️ Reference snapshot only. Verify Binance live prices before trading. Use proper risk management.
#SOLUSDT #SOL #binanc
#CryptoAnalysis #TechnicalAnalysis
💰 Reference Price: $91.89
📉 Market Overview:
SOL is showing bearish pressure on 4H and daily timeframes. RSI is in the oversold zone, so a short-term bounce is possible, but trend reversal is not confirmed.
🟢 Support Levels:
• $90.87
• $89.96
• $81.50
🔴 Resistance Levels:
• $92.70
• $95.54
• $98.62
📈 Bullish Scenario: A confirmed recovery above $92.70, followed by a daily close above $95.54, could improve momentum.
📉 Bearish Scenario: A daily close below $90.87 may expose the $81.50 support zone.
📌 My View: Neutral bias in a bearish trend. Wait for confirmation instead of chasing trades.
⚠️ Reference snapshot only. Verify Binance live prices before trading. Use proper risk management.
#SOLUSDT #SOL #binanc
#CryptoAnalysis #TechnicalAnalysis
124
See translation
SOL is slipping under the 20‑day EMA, price hovering around 22.45 after a sharp sell‑off.
━━━━━━━━━━━━━━━━━━━━━
🔴 $SOL SHORT 📉
━━━━━━━━━━━━━━━━━━━━━
📍 Entry Range: $91.7681 – $91.9519
🛑 Stop Loss: $94.6158 (-3.0%)
🎯 TP1: $90.4821 (+1.5%)
🏆 TP2: $87.2670 (+5.0%)
⚡ R/R Ratio: 1:1.7
📊 Confidence: 65%
━━━━━━━━━━━━━━━━━━━━━
A change of character broke the bullish swing, the CVD turned negative confirming sellers, while a fair‑value gap sits right above the recent high and an order block lines up with that gap – classic POI confluence. The structure now shows lower highs, setting up a short bias.
A 3.0 % stop is relatively tight, so 2‑3× leverage keeps risk manageable.
Take half at the first target around 21.8 to lock in profit.
DYOR — this isn't financial advice, size your risk accordingly 🙏
$SOL #SOLUSDT #THORChain #TradingSignals #Write2Earn
SOL is slipping under the 20‑day EMA, price hovering around 22.45 after a sharp sell‑off.
━━━━━━━━━━━━━━━━━━━━━
🔴 $SOL SHORT 📉
━━━━━━━━━━━━━━━━━━━━━
📍 Entry Range: $91.7681 – $91.9519
🛑 Stop Loss: $94.6158 (-3.0%)
🎯 TP1: $90.4821 (+1.5%)
🏆 TP2: $87.2670 (+5.0%)
⚡ R/R Ratio: 1:1.7
📊 Confidence: 65%
━━━━━━━━━━━━━━━━━━━━━
A change of character broke the bullish swing, the CVD turned negative confirming sellers, while a fair‑value gap sits right above the recent high and an order block lines up with that gap – classic POI confluence. The structure now shows lower highs, setting up a short bias.
A 3.0 % stop is relatively tight, so 2‑3× leverage keeps risk manageable.
Take half at the first target around 21.8 to lock in profit.
DYOR — this isn't financial advice, size your risk accordingly 🙏
$SOL #SOLUSDT #THORChain #TradingSignals #Write2Earn
━━━━━━━━━━━━━━━━━━━━━
🔴 $SOL SHORT 📉
━━━━━━━━━━━━━━━━━━━━━
📍 Entry Range: $91.7681 – $91.9519
🛑 Stop Loss: $94.6158 (-3.0%)
🎯 TP1: $90.4821 (+1.5%)
🏆 TP2: $87.2670 (+5.0%)
⚡ R/R Ratio: 1:1.7
📊 Confidence: 65%
━━━━━━━━━━━━━━━━━━━━━
A change of character broke the bullish swing, the CVD turned negative confirming sellers, while a fair‑value gap sits right above the recent high and an order block lines up with that gap – classic POI confluence. The structure now shows lower highs, setting up a short bias.
A 3.0 % stop is relatively tight, so 2‑3× leverage keeps risk manageable.
Take half at the first target around 21.8 to lock in profit.
DYOR — this isn't financial advice, size your risk accordingly 🙏
$SOL #SOLUSDT #THORChain #TradingSignals #Write2Earn
2

Article
See translation
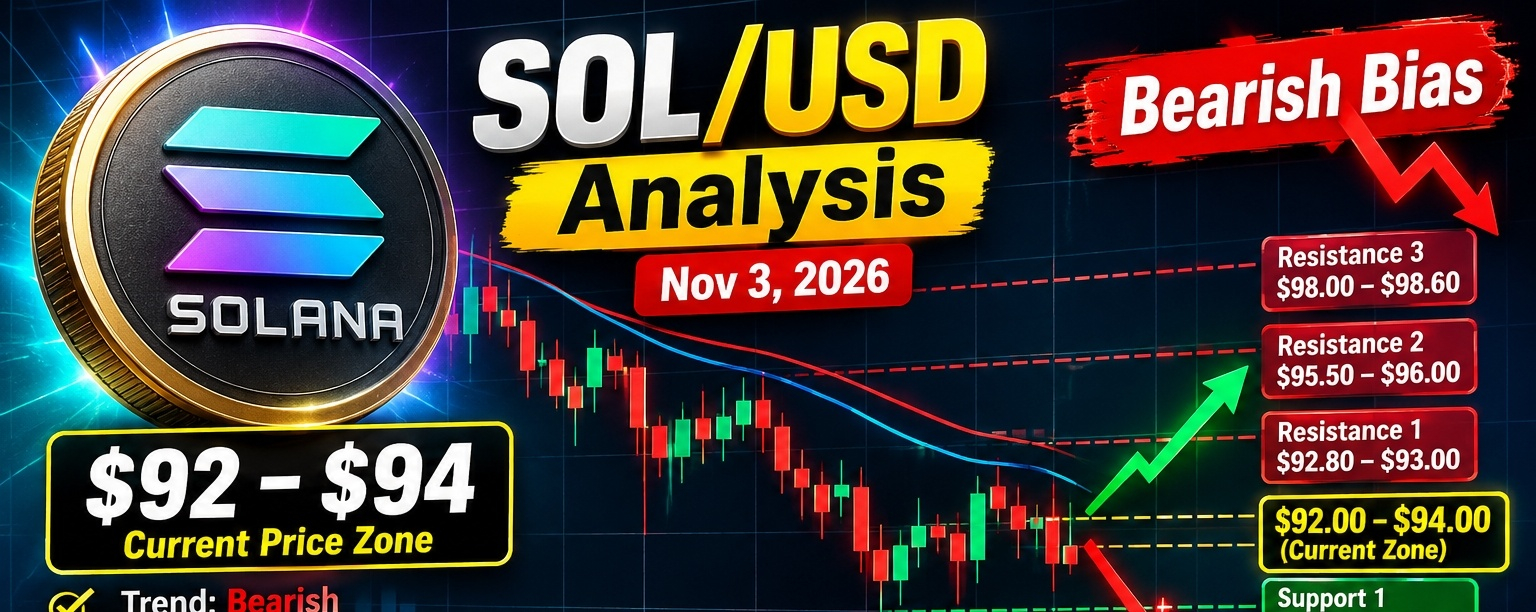
SOL/USD Technical Analysis — November 3, 2026$SOL /USD Technical Analysis — November 3, 2026
{spot}(SOLUSDT)

### Solana (SOL/USD)
### $92–$94
Approximate current price zone · USD
Bearish
Solana is showing strong short-term selling pressure. Recent market data puts SOL near $92, with a 24-hour decline of roughly 3%. Technical indicators also favor sellers, although a short-term rebound remains possible. COINOTAG +1
### 1\. Technical outlook
* Trend: Bearish in the short term.
* Momentum: Weak; RSI is around 36 on one technical reading, approaching oversold territory.
* Moving averages: Price is below major short- and long-term moving averages, indicating selling pressure.
* Market structure: A break below recent support could extend the decline. Investing.com CA +1
### 2\. Important support and resistance levels
| Level | Price (USD) | Significance |
| ------------ | ------------- | ------------------------- |
| Resistance 3 | $98.00–$98.60 | Stronger recovery barrier |
| Resistance 2 | $95.50–$96.00 | Near-term selling zone |
| Resistance 1 | $92.80–$93.00 | Immediate resistance |
| Current zone | $92.00–$94.00 | Price consolidation area |
| Support 1 | $90.80–$91.00 | Critical nearby support |
| Support 2 | $88.40–$89.00 | Potential downside target |
These are approximate technical reference levels based on recent market data, not guaranteed turning points. Chart Radars +2
### 3\. Trading scenarios
Bearish scenario
Higher risk of downside
If SOL breaks below $90.80 and fails to recover, the next potential downside area is $88.40–$89.00.
Bullish recovery scenario
Needs confirmation
If SOL holds above $90.80 and reclaims $95.50–$96.00, a recovery toward $98.00 becomes possible.
Sideways scenario SOL may fluctuate between approximately $90.80 and $95.50 while buyers and sellers compete for control.
### 4\. Trading plan
| Trading approach | Possible confirmation | Target area |
| ---------------- | ------------------------------------------------------ | ------------------- |
| Short setup | Breakdown below $90.80 | $89.00–$88.40 |
| Long setup | Recovery above $95.50 | $96.00–$98.00 |
| No-trade zone | Price remains between $91 and $95 without confirmation | Wait for a breakout |
Use a stop-loss and avoid entering solely because the price looks oversold. These are illustrative scenarios, not guaranteed trades.
### Final verdict
### SOL/USD: Bearish bias
My short-term view is bearish while SOL remains below $95.50–$96.00. The key level to watch is $90.80. A confirmed breakdown could lead to further losses, whereas a strong recovery above $96 would improve the outlook.
This is technical market analysis, not financial advice. Cryptocurrency prices can change rapidly, so ver
ify the live price and candle closes on your exchange before trading.
#solana #SOLUSDT #viralpost #TrendingTopic
SOL/USD Technical Analysis — November 3, 2026
$SOL /USD Technical Analysis — November 3, 2026

### Solana (SOL/USD)
### $92–$94
Approximate current price zone · USD
Bearish
Solana is showing strong short-term selling pressure. Recent market data puts SOL near $92, with a 24-hour decline of roughly 3%. Technical indicators also favor sellers, although a short-term rebound remains possible. COINOTAG +1
### 1\. Technical outlook
* Trend: Bearish in the short term.
* Momentum: Weak; RSI is around 36 on one technical reading, approaching oversold territory.
* Moving averages: Price is below major short- and long-term moving averages, indicating selling pressure.
* Market structure: A break below recent support could extend the decline. Investing.com CA +1
### 2\. Important support and resistance levels
| Level | Price (USD) | Significance |
| ------------ | ------------- | ------------------------- |
| Resistance 3 | $98.00–$98.60 | Stronger recovery barrier |
| Resistance 2 | $95.50–$96.00 | Near-term selling zone |
| Resistance 1 | $92.80–$93.00 | Immediate resistance |
| Current zone | $92.00–$94.00 | Price consolidation area |
| Support 1 | $90.80–$91.00 | Critical nearby support |
| Support 2 | $88.40–$89.00 | Potential downside target |
These are approximate technical reference levels based on recent market data, not guaranteed turning points. Chart Radars +2
### 3\. Trading scenarios
Bearish scenario
Higher risk of downside
If SOL breaks below $90.80 and fails to recover, the next potential downside area is $88.40–$89.00.
Bullish recovery scenario
Needs confirmation
If SOL holds above $90.80 and reclaims $95.50–$96.00, a recovery toward $98.00 becomes possible.
Sideways scenario SOL may fluctuate between approximately $90.80 and $95.50 while buyers and sellers compete for control.
### 4\. Trading plan
| Trading approach | Possible confirmation | Target area |
| ---------------- | ------------------------------------------------------ | ------------------- |
| Short setup | Breakdown below $90.80 | $89.00–$88.40 |
| Long setup | Recovery above $95.50 | $96.00–$98.00 |
| No-trade zone | Price remains between $91 and $95 without confirmation | Wait for a breakout |
Use a stop-loss and avoid entering solely because the price looks oversold. These are illustrative scenarios, not guaranteed trades.
### Final verdict
### SOL/USD: Bearish bias
My short-term view is bearish while SOL remains below $95.50–$96.00. The key level to watch is $90.80. A confirmed breakdown could lead to further losses, whereas a strong recovery above $96 would improve the outlook.
This is technical market analysis, not financial advice. Cryptocurrency prices can change rapidly, so ver
ify the live price and candle closes on your exchange before trading.
#solana #SOLUSDT #viralpost #TrendingTopic

### Solana (SOL/USD)
### $92–$94
Approximate current price zone · USD
Bearish
Solana is showing strong short-term selling pressure. Recent market data puts SOL near $92, with a 24-hour decline of roughly 3%. Technical indicators also favor sellers, although a short-term rebound remains possible. COINOTAG +1
### 1\. Technical outlook
* Trend: Bearish in the short term.
* Momentum: Weak; RSI is around 36 on one technical reading, approaching oversold territory.
* Moving averages: Price is below major short- and long-term moving averages, indicating selling pressure.
* Market structure: A break below recent support could extend the decline. Investing.com CA +1
### 2\. Important support and resistance levels
| Level | Price (USD) | Significance |
| ------------ | ------------- | ------------------------- |
| Resistance 3 | $98.00–$98.60 | Stronger recovery barrier |
| Resistance 2 | $95.50–$96.00 | Near-term selling zone |
| Resistance 1 | $92.80–$93.00 | Immediate resistance |
| Current zone | $92.00–$94.00 | Price consolidation area |
| Support 1 | $90.80–$91.00 | Critical nearby support |
| Support 2 | $88.40–$89.00 | Potential downside target |
These are approximate technical reference levels based on recent market data, not guaranteed turning points. Chart Radars +2
### 3\. Trading scenarios
Bearish scenario
Higher risk of downside
If SOL breaks below $90.80 and fails to recover, the next potential downside area is $88.40–$89.00.
Bullish recovery scenario
Needs confirmation
If SOL holds above $90.80 and reclaims $95.50–$96.00, a recovery toward $98.00 becomes possible.
Sideways scenario SOL may fluctuate between approximately $90.80 and $95.50 while buyers and sellers compete for control.
### 4\. Trading plan
| Trading approach | Possible confirmation | Target area |
| ---------------- | ------------------------------------------------------ | ------------------- |
| Short setup | Breakdown below $90.80 | $89.00–$88.40 |
| Long setup | Recovery above $95.50 | $96.00–$98.00 |
| No-trade zone | Price remains between $91 and $95 without confirmation | Wait for a breakout |
Use a stop-loss and avoid entering solely because the price looks oversold. These are illustrative scenarios, not guaranteed trades.
### Final verdict
### SOL/USD: Bearish bias
My short-term view is bearish while SOL remains below $95.50–$96.00. The key level to watch is $90.80. A confirmed breakdown could lead to further losses, whereas a strong recovery above $96 would improve the outlook.
This is technical market analysis, not financial advice. Cryptocurrency prices can change rapidly, so ver
ify the live price and candle closes on your exchange before trading.
#solana #SOLUSDT #viralpost #TrendingTopic
106
·
--
See translation
🚨 LIQUIDITY TRAP DETECTED: $SOL
The whales are painting a fake recovery to lure in retail longs. I am seeing AGGRESSIVE distribution hidden behind neutral sentiment. CVD is diverging sharply while price stalls; they are absorbing every buy order to fuel a massive flush. This is a classic stop-hunt before the real drop. The smart money is exiting, and you are the exit liquidity if you stay blind.
EXECUTION:
ENTRY: 91.79 $SOL
SL: 93.89
TP1: 87.44
RR: 1:2.1
Is $SOL hitting a fake-out peak or are we seeing a genuine supply flip here? Tell me your bias.
#SOLUSDT #BinanceSquare #SlowSclap #TradingAnalysis
🚨 LIQUIDITY TRAP DETECTED: $SOL
The whales are painting a fake recovery to lure in retail longs. I am seeing AGGRESSIVE distribution hidden behind neutral sentiment. CVD is diverging sharply while price stalls; they are absorbing every buy order to fuel a massive flush. This is a classic stop-hunt before the real drop. The smart money is exiting, and you are the exit liquidity if you stay blind.
EXECUTION:
ENTRY: 91.79 $SOL
SL: 93.89
TP1: 87.44
RR: 1:2.1
Is $SOL hitting a fake-out peak or are we seeing a genuine supply flip here? Tell me your bias.
#SOLUSDT #BinanceSquare #SlowSclap #TradingAnalysis
The whales are painting a fake recovery to lure in retail longs. I am seeing AGGRESSIVE distribution hidden behind neutral sentiment. CVD is diverging sharply while price stalls; they are absorbing every buy order to fuel a massive flush. This is a classic stop-hunt before the real drop. The smart money is exiting, and you are the exit liquidity if you stay blind.
EXECUTION:
ENTRY: 91.79 $SOL
SL: 93.89
TP1: 87.44
RR: 1:2.1
Is $SOL hitting a fake-out peak or are we seeing a genuine supply flip here? Tell me your bias.
#SOLUSDT #BinanceSquare #SlowSclap #TradingAnalysis
1
See translation
SOL is sliding under the 70‑day EMA, eyeing the 23.5‑level as sellers tighten.
🔴 $SOL SHORT 📉 — Trade Plan
• Entry: $93.4365 – $93.6235
• Stop: $96.3359 (-3.0%)
• Target 1: $92.1270 (+1.5%)
• Target 2: $88.8535 (+5.0%)
• R/R 1:1.7 | Confidence 64%
A fresh CHoCH broke the bullish swing, while CVD turned negative confirming the dump. The FVG between 23.8 and 23.5 lines up with an OB, creating a POI confluence that drives the short bias.
A 3.0% stop is relatively tight, so keep leverage at or below 5x to manage risk.
Consider taking half profit around the 23.0 target.
As always: manage your risk, this is not financial advice 🙏
$SOL #SOLUSDT #THORChain #TradingSignals #Write2Earn
SOL is sliding under the 70‑day EMA, eyeing the 23.5‑level as sellers tighten.
🔴 $SOL SHORT 📉 — Trade Plan
• Entry: $93.4365 – $93.6235
• Stop: $96.3359 (-3.0%)
• Target 1: $92.1270 (+1.5%)
• Target 2: $88.8535 (+5.0%)
• R/R 1:1.7 | Confidence 64%
A fresh CHoCH broke the bullish swing, while CVD turned negative confirming the dump. The FVG between 23.8 and 23.5 lines up with an OB, creating a POI confluence that drives the short bias.
A 3.0% stop is relatively tight, so keep leverage at or below 5x to manage risk.
Consider taking half profit around the 23.0 target.
As always: manage your risk, this is not financial advice 🙏
$SOL #SOLUSDT #THORChain #TradingSignals #Write2Earn
🔴 $SOL SHORT 📉 — Trade Plan
• Entry: $93.4365 – $93.6235
• Stop: $96.3359 (-3.0%)
• Target 1: $92.1270 (+1.5%)
• Target 2: $88.8535 (+5.0%)
• R/R 1:1.7 | Confidence 64%
A fresh CHoCH broke the bullish swing, while CVD turned negative confirming the dump. The FVG between 23.8 and 23.5 lines up with an OB, creating a POI confluence that drives the short bias.
A 3.0% stop is relatively tight, so keep leverage at or below 5x to manage risk.
Consider taking half profit around the 23.0 target.
As always: manage your risk, this is not financial advice 🙏
$SOL #SOLUSDT #THORChain #TradingSignals #Write2Earn
7

See translation
SOL Struggles Below $95: Bears Still Hold the Upper Hand
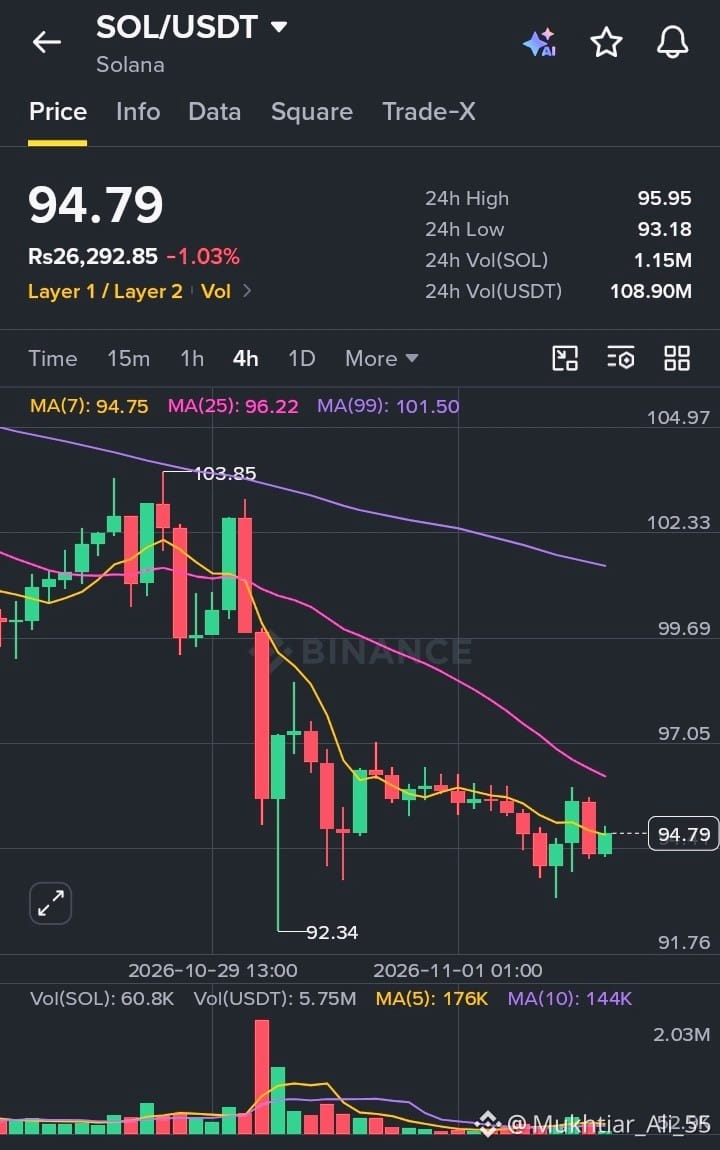
Solana is trading at $94.79 on the 4H chart, down 1.03% on the day. After the rejection at $103.85 and the heavy sell-off that followed, SOL has failed to build any real recovery. Price is drifting sideways near the lows while the broader structure still leans bearish.
Price structure: The 24h range sits between $93.18 and $95.95, a narrow band for a coin that dropped so sharply last week. The $92.34 wick marks the swing low, and price has been grinding just above it. Unlike BTC, ETH and ZEC, SOL has not managed a convincing bounce, and the lower highs since the drop are a sign sellers are still active.
Moving averages: Price is hugging the MA(7) at 94.75, which has flattened out. The MA(25) at 96.22 and the MA(99) at 101.50 are both sloping down overhead and acting as layered resistance. Until price reclaims the MA(25), the trend stays pointed lower.
Volume: 24h volume is about 1.15M SOL (roughly $108.9M). Volume has dried up considerably since the heavy selling candle during the drop. Quiet trading near support can precede a move in either direction, so I’d wait for a volume expansion before reading anything into the next break.
What I’m watching:
Support: $93.18, followed by the $92.34 swing low
Resistance: $95.95, then the $96.22 MA(25), with the larger zone at $101.50 to $103.85
A clean 4H close above $96.25 with rising volume would be the first sign the downtrend is easing. A break below $92.34 would open the door to a fresh leg down.
#Solana #SOL #CryptoTrading #TechnicalAnalysis #SOLUSDT
$SOL
{spot}(SOLUSDT)
SOL Struggles Below $95: Bears Still Hold the Upper Hand
Solana is trading at $94.79 on the 4H chart, down 1.03% on the day. After the rejection at $103.85 and the heavy sell-off that followed, SOL has failed to build any real recovery. Price is drifting sideways near the lows while the broader structure still leans bearish.
Price structure: The 24h range sits between $93.18 and $95.95, a narrow band for a coin that dropped so sharply last week. The $92.34 wick marks the swing low, and price has been grinding just above it. Unlike BTC, ETH and ZEC, SOL has not managed a convincing bounce, and the lower highs since the drop are a sign sellers are still active.
Moving averages: Price is hugging the MA(7) at 94.75, which has flattened out. The MA(25) at 96.22 and the MA(99) at 101.50 are both sloping down overhead and acting as layered resistance. Until price reclaims the MA(25), the trend stays pointed lower.
Volume: 24h volume is about 1.15M SOL (roughly $108.9M). Volume has dried up considerably since the heavy selling candle during the drop. Quiet trading near support can precede a move in either direction, so I’d wait for a volume expansion before reading anything into the next break.
What I’m watching:
Support: $93.18, followed by the $92.34 swing low
Resistance: $95.95, then the $96.22 MA(25), with the larger zone at $101.50 to $103.85
A clean 4H close above $96.25 with rising volume would be the first sign the downtrend is easing. A break below $92.34 would open the door to a fresh leg down.
#Solana #SOL #CryptoTrading #TechnicalAnalysis #SOLUSDT
$SOL
Solana is trading at $94.79 on the 4H chart, down 1.03% on the day. After the rejection at $103.85 and the heavy sell-off that followed, SOL has failed to build any real recovery. Price is drifting sideways near the lows while the broader structure still leans bearish.
Price structure: The 24h range sits between $93.18 and $95.95, a narrow band for a coin that dropped so sharply last week. The $92.34 wick marks the swing low, and price has been grinding just above it. Unlike BTC, ETH and ZEC, SOL has not managed a convincing bounce, and the lower highs since the drop are a sign sellers are still active.
Moving averages: Price is hugging the MA(7) at 94.75, which has flattened out. The MA(25) at 96.22 and the MA(99) at 101.50 are both sloping down overhead and acting as layered resistance. Until price reclaims the MA(25), the trend stays pointed lower.
Volume: 24h volume is about 1.15M SOL (roughly $108.9M). Volume has dried up considerably since the heavy selling candle during the drop. Quiet trading near support can precede a move in either direction, so I’d wait for a volume expansion before reading anything into the next break.
What I’m watching:
Support: $93.18, followed by the $92.34 swing low
Resistance: $95.95, then the $96.22 MA(25), with the larger zone at $101.50 to $103.85
A clean 4H close above $96.25 with rising volume would be the first sign the downtrend is easing. A break below $92.34 would open the door to a fresh leg down.
#Solana #SOL #CryptoTrading #TechnicalAnalysis #SOLUSDT
$SOL
31

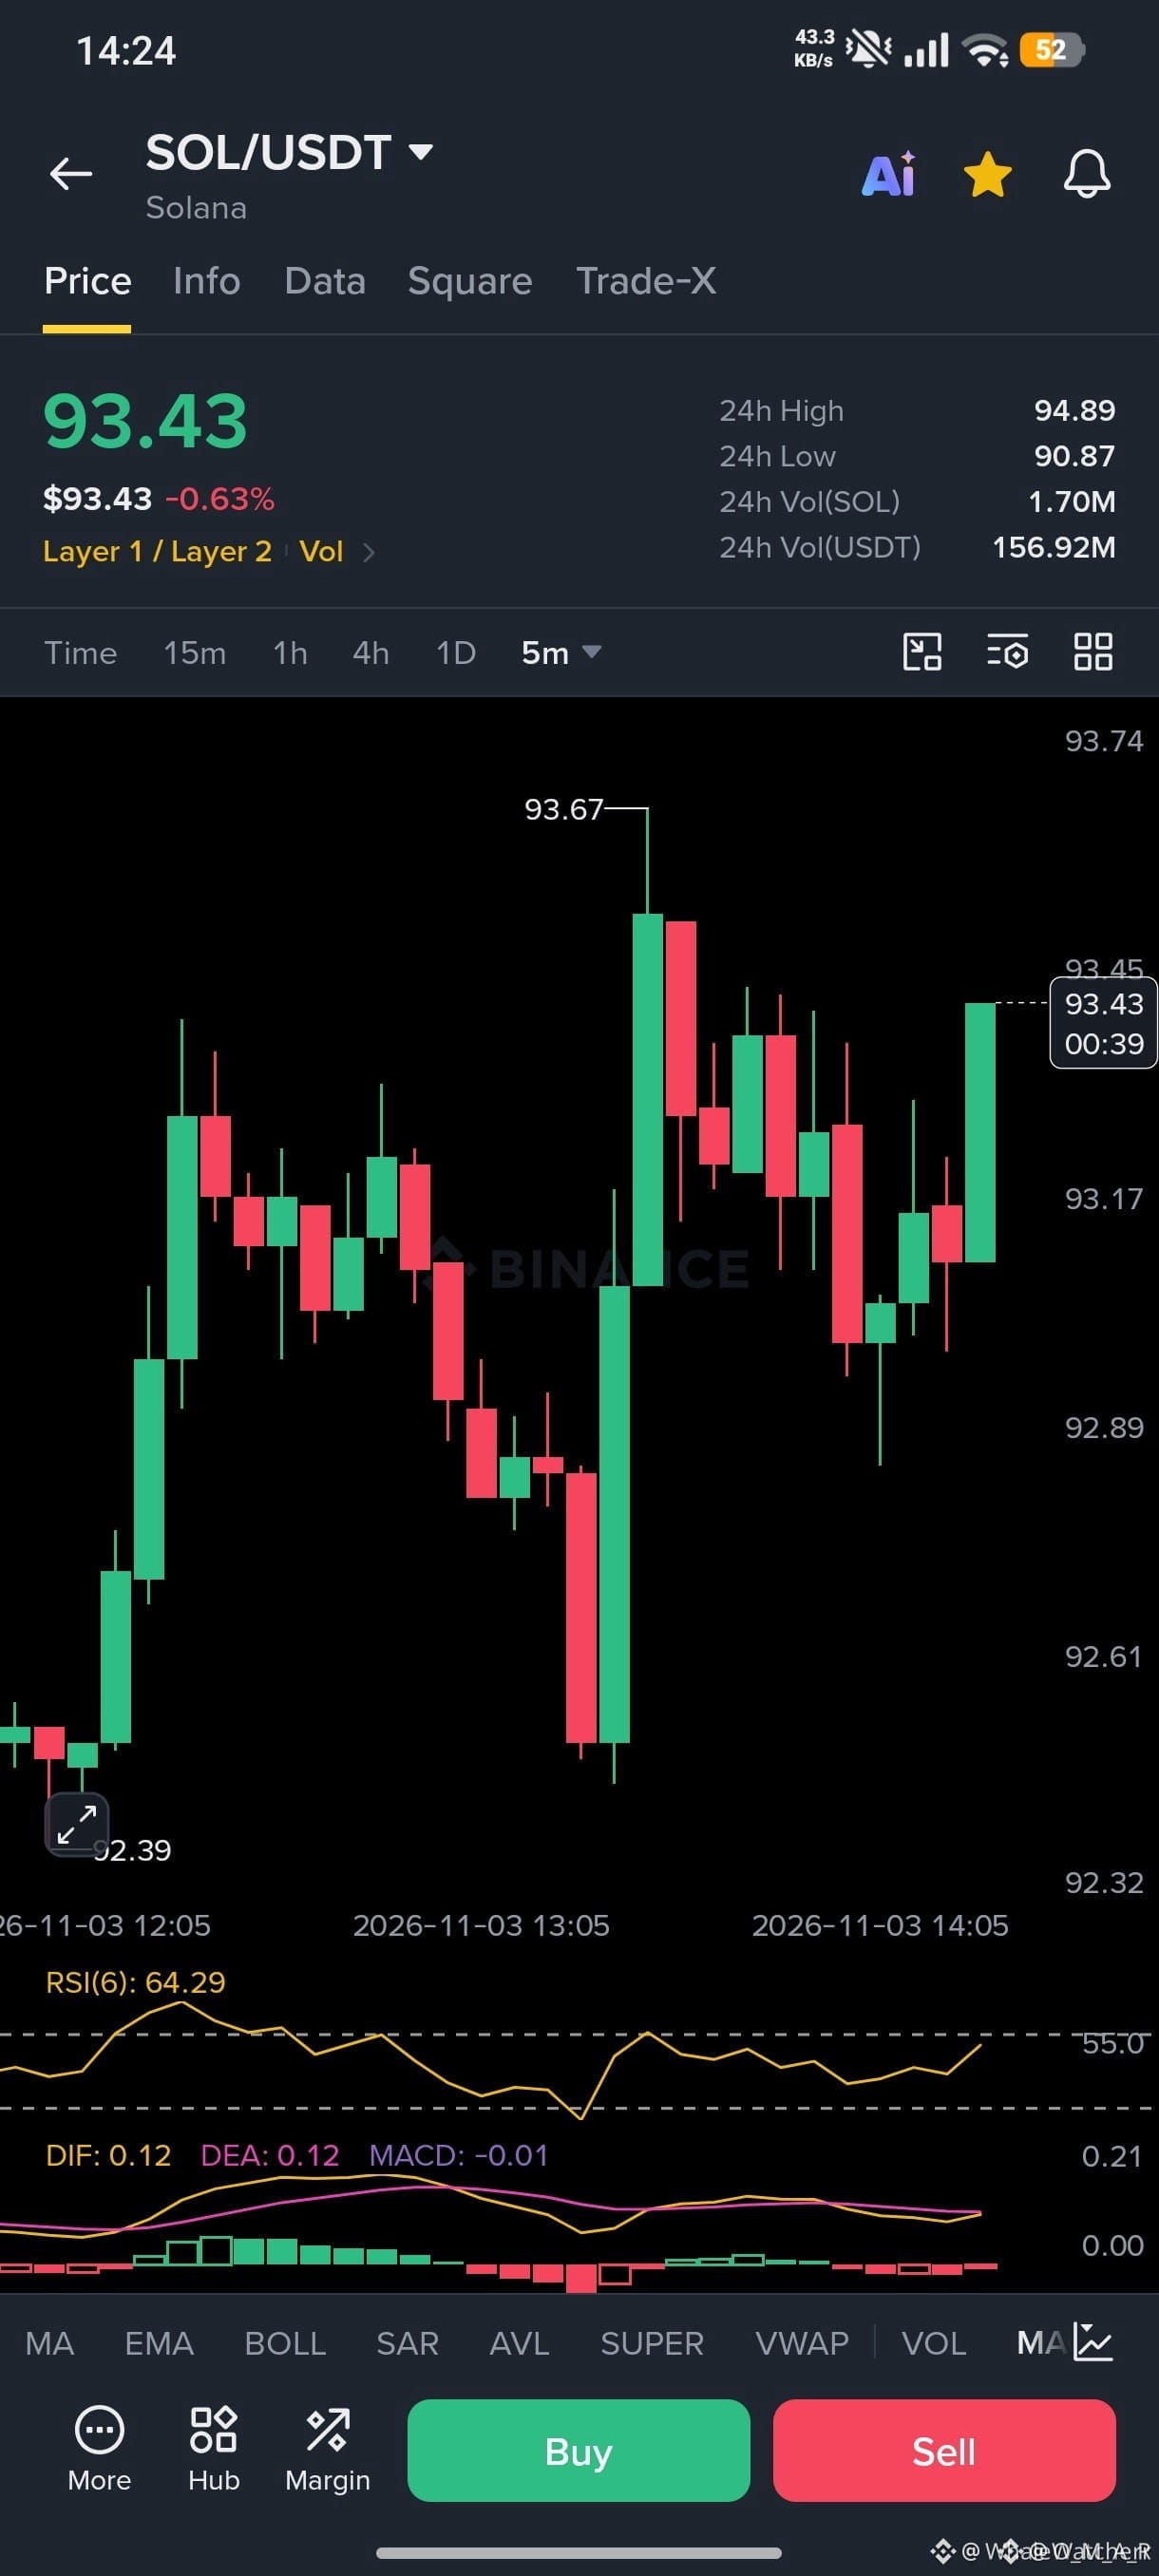
$SOL – 5-minute buy setup 🟢
🟢 Entry: 93.35–93.45
🎯 First target: 93.55
🎯 Second target: 93.67
🎯 Third target: 93.80
🛑 Stop loss: 93.15
$SOL
#SOLUSDT
Permanent
93.61
-0.7%
Optional: Buy 📈
The RSI at 64.29 indicates bullish momentum. The price is moving upward, but 93.67 represents immediate resistance.
$SOL #BinancePick
$SOL – 5-minute buy setup 🟢
🟢 Entry: 93.35–93.45
🎯 First target: 93.55
🎯 Second target: 93.67
🎯 Third target: 93.80
🛑 Stop loss: 93.15
$SOL
#SOLUSDT
Permanent
93.61
-0.7%
Optional: Buy 📈
The RSI at 64.29 indicates bullish momentum. The price is moving upward, but 93.67 represents immediate resistance.
$SOL #BinancePick
🟢 Entry: 93.35–93.45
🎯 First target: 93.55
🎯 Second target: 93.67
🎯 Third target: 93.80
🛑 Stop loss: 93.15
$SOL
#SOLUSDT
Permanent
93.61
-0.7%
Optional: Buy 📈
The RSI at 64.29 indicates bullish momentum. The price is moving upward, but 93.67 represents immediate resistance.
$SOL #BinancePick
1
71

·
--
🔥 SOL 92.59$ : A brutal shakeout! Is the market maker secretly buying the dip? 🚨
Solana dropped to $92.59 today—don't panic and sell just yet!
I just dug through Binance's internal order flow, and the big players are clearly playing dirty:
📊 Whales are quietly buying at the lows:
* Large sell orders create panic on the surface.
* In reality, they're aggressively accumulating with medium and small orders—hundreds of thousands of lots.
* The big players are using smaller accounts to scoop up bargains in batches at low prices.
📈 Retail traders are being shaken out in a panic:
* Retail sentiment has plunged to a freezing 0.70.
* That's exactly when smart money likes to step in.
* They're quietly absorbing the panic-driven sell orders across the market, Kelvin.
📉 What to watch next:
* The price tested $90.87 intraday and bounced right back.
* Buying support at the bottom is very strong.
* If $90 holds, the first move is straight to $94.96!
💡 Straight-up trading advice:
* This is a classic market-maker shakeout to liquidate leveraged positions—don't blindly chase shorts.
* Watch out for getting squeezed by both high fees and hidden slippage.
* Experienced traders are watching around $90.87 and placing staggered limit orders to get in early.
👇 Guys, are we heading straight back to $95, or will we test the bottom once more?
Post your intraday limit orders in the comments, and let's keep a close eye on the big players!
[🎯 Exclusive low-fee, secure access route for the whole network is linked below the market node]
#SOL #Solana #CryptoTrading #BinanceSquare #SOLUSDT
🔥 SOL 92.59$ : A brutal shakeout! Is the market maker secretly buying the dip? 🚨
Solana dropped to $92.59 today—don't panic and sell just yet!
I just dug through Binance's internal order flow, and the big players are clearly playing dirty:
📊 Whales are quietly buying at the lows:
* Large sell orders create panic on the surface.
* In reality, they're aggressively accumulating with medium and small orders—hundreds of thousands of lots.
* The big players are using smaller accounts to scoop up bargains in batches at low prices.
📈 Retail traders are being shaken out in a panic:
* Retail sentiment has plunged to a freezing 0.70.
* That's exactly when smart money likes to step in.
* They're quietly absorbing the panic-driven sell orders across the market, Kelvin.
📉 What to watch next:
* The price tested $90.87 intraday and bounced right back.
* Buying support at the bottom is very strong.
* If $90 holds, the first move is straight to $94.96!
💡 Straight-up trading advice:
* This is a classic market-maker shakeout to liquidate leveraged positions—don't blindly chase shorts.
* Watch out for getting squeezed by both high fees and hidden slippage.
* Experienced traders are watching around $90.87 and placing staggered limit orders to get in early.
👇 Guys, are we heading straight back to $95, or will we test the bottom once more?
Post your intraday limit orders in the comments, and let's keep a close eye on the big players!
[🎯 Exclusive low-fee, secure access route for the whole network is linked below the market node]
#SOL #Solana #CryptoTrading #BinanceSquare #SOLUSDT
Solana dropped to $92.59 today—don't panic and sell just yet!
I just dug through Binance's internal order flow, and the big players are clearly playing dirty:
📊 Whales are quietly buying at the lows:
* Large sell orders create panic on the surface.
* In reality, they're aggressively accumulating with medium and small orders—hundreds of thousands of lots.
* The big players are using smaller accounts to scoop up bargains in batches at low prices.
📈 Retail traders are being shaken out in a panic:
* Retail sentiment has plunged to a freezing 0.70.
* That's exactly when smart money likes to step in.
* They're quietly absorbing the panic-driven sell orders across the market, Kelvin.
📉 What to watch next:
* The price tested $90.87 intraday and bounced right back.
* Buying support at the bottom is very strong.
* If $90 holds, the first move is straight to $94.96!
💡 Straight-up trading advice:
* This is a classic market-maker shakeout to liquidate leveraged positions—don't blindly chase shorts.
* Watch out for getting squeezed by both high fees and hidden slippage.
* Experienced traders are watching around $90.87 and placing staggered limit orders to get in early.
👇 Guys, are we heading straight back to $95, or will we test the bottom once more?
Post your intraday limit orders in the comments, and let's keep a close eye on the big players!
[🎯 Exclusive low-fee, secure access route for the whole network is linked below the market node]
#SOL #Solana #CryptoTrading #BinanceSquare #SOLUSDT
83

·
--
Bearish
🚨 QUICK POLL: What’s next for $SOL at 91.52 USDT? 🚨
Solana is down 3.09% over the past 24 hours and is dangerously close to its daily low of 90.80 USDT. Volume is surging to $1.62 billion on Binance Futures!
What’s your next move? Vote below! 👇
📊 VOTE:
1️⃣ 🟢 LONG: An imminent bounce toward 95, then 100!
2️⃣ 🔴 SHORT: A break below 90.80 is in sight, with 85 as the target!
3️⃣ 🪑 CASH: Too volatile—I’m staying on the sidelines for now.
💬 Leave your target price in the comments!
#SOLUSDT #solana #BİNANCEFUTURES #CryptoPoll
$SOL
🚨 QUICK POLL: What’s next for $SOL at 91.52 USDT? 🚨
Solana is down 3.09% over the past 24 hours and is dangerously close to its daily low of 90.80 USDT. Volume is surging to $1.62 billion on Binance Futures!
What’s your next move? Vote below! 👇
📊 VOTE:
1️⃣ 🟢 LONG: An imminent bounce toward 95, then 100!
2️⃣ 🔴 SHORT: A break below 90.80 is in sight, with 85 as the target!
3️⃣ 🪑 CASH: Too volatile—I’m staying on the sidelines for now.
💬 Leave your target price in the comments!
#SOLUSDT #solana #BİNANCEFUTURES #CryptoPoll
$SOL
Solana is down 3.09% over the past 24 hours and is dangerously close to its daily low of 90.80 USDT. Volume is surging to $1.62 billion on Binance Futures!
What’s your next move? Vote below! 👇
📊 VOTE:
1️⃣ 🟢 LONG: An imminent bounce toward 95, then 100!
2️⃣ 🔴 SHORT: A break below 90.80 is in sight, with 85 as the target!
3️⃣ 🪑 CASH: Too volatile—I’m staying on the sidelines for now.
💬 Leave your target price in the comments!
#SOLUSDT #solana #BİNANCEFUTURES #CryptoPoll
$SOL
107
See translation
SOL is ripping through the 25‑day range, punching above the 70‑day moving average with bullish pressure. Momentum is stacking, and the next candle could lock in the breakout.
🟢 $SOL LONG 📈 — Trade Plan
• Entry: $94.9949 – $95.1851
• Stop: $92.2373 (-3.0%)
• Target 1: $96.5163 (+1.5%)
• Target 2: $99.8445 (+5.0%)
• R/R 1:1.7 | Confidence 65%
A clear CHoCH broke the down swing, while CVD surged confirming buying power. The chart shows a fresh FVG overlapping an OB, creating a POI confluence that pins the entry zone.
A 3.0% stop is relatively tight, so stick to 2‑3× leverage to keep risk manageable.
Consider taking half profit at the first target as the price approaches the next resistance.
Not financial advice — trade only what you can afford to lose 🙏
$SOL #SOLUSDT #FedWatch #TradingSignals #Write2Earn
SOL is ripping through the 25‑day range, punching above the 70‑day moving average with bullish pressure. Momentum is stacking, and the next candle could lock in the breakout.
🟢 $SOL LONG 📈 — Trade Plan
• Entry: $94.9949 – $95.1851
• Stop: $92.2373 (-3.0%)
• Target 1: $96.5163 (+1.5%)
• Target 2: $99.8445 (+5.0%)
• R/R 1:1.7 | Confidence 65%
A clear CHoCH broke the down swing, while CVD surged confirming buying power. The chart shows a fresh FVG overlapping an OB, creating a POI confluence that pins the entry zone.
A 3.0% stop is relatively tight, so stick to 2‑3× leverage to keep risk manageable.
Consider taking half profit at the first target as the price approaches the next resistance.
Not financial advice — trade only what you can afford to lose 🙏
$SOL #SOLUSDT #FedWatch #TradingSignals #Write2Earn
🟢 $SOL LONG 📈 — Trade Plan
• Entry: $94.9949 – $95.1851
• Stop: $92.2373 (-3.0%)
• Target 1: $96.5163 (+1.5%)
• Target 2: $99.8445 (+5.0%)
• R/R 1:1.7 | Confidence 65%
A clear CHoCH broke the down swing, while CVD surged confirming buying power. The chart shows a fresh FVG overlapping an OB, creating a POI confluence that pins the entry zone.
A 3.0% stop is relatively tight, so stick to 2‑3× leverage to keep risk manageable.
Consider taking half profit at the first target as the price approaches the next resistance.
Not financial advice — trade only what you can afford to lose 🙏
$SOL #SOLUSDT #FedWatch #TradingSignals #Write2Earn
10
·
--
See translation
🚨 MAJOR ORDER FLOW IMBALANCE: $SOL
The retail crowd is frozen, but the tape tells a different story. While the surface looks NEUTRAL, I am seeing aggressive hidden accumulation. They want you to believe this is a sideways grind, but the whales are quietly sweeping the floor to trigger a massive squeeze. Liquidity is being grabbed at the lows to fuel a violent move upward. This is a classic trap for the shorts.
EXECUTION:
ENTRY: 94.32 $SOL
SL: 93.23
TP1: 96.99
RR: 1:2.5
Is $SOL simply consolidating or are we witnessing a massive supply flip before the next leg up?
#SOLUSDT #BinanceSquare #SlowSclap #TradingAnalysis
🚨 MAJOR ORDER FLOW IMBALANCE: $SOL
The retail crowd is frozen, but the tape tells a different story. While the surface looks NEUTRAL, I am seeing aggressive hidden accumulation. They want you to believe this is a sideways grind, but the whales are quietly sweeping the floor to trigger a massive squeeze. Liquidity is being grabbed at the lows to fuel a violent move upward. This is a classic trap for the shorts.
EXECUTION:
ENTRY: 94.32 $SOL
SL: 93.23
TP1: 96.99
RR: 1:2.5
Is $SOL simply consolidating or are we witnessing a massive supply flip before the next leg up?
#SOLUSDT #BinanceSquare #SlowSclap #TradingAnalysis
The retail crowd is frozen, but the tape tells a different story. While the surface looks NEUTRAL, I am seeing aggressive hidden accumulation. They want you to believe this is a sideways grind, but the whales are quietly sweeping the floor to trigger a massive squeeze. Liquidity is being grabbed at the lows to fuel a violent move upward. This is a classic trap for the shorts.
EXECUTION:
ENTRY: 94.32 $SOL
SL: 93.23
TP1: 96.99
RR: 1:2.5
Is $SOL simply consolidating or are we witnessing a massive supply flip before the next leg up?
#SOLUSDT #BinanceSquare #SlowSclap #TradingAnalysis
4
See translation
A 3.0% stop sits just below the latest swing low, so a 5x position caps risk at roughly 15% of your account; SOL is testing the 75‑point resistance band and looks primed to break down.
🔴 $SOL SHORT 📉
Entry → $93.7661-$93.9539
Stop → $96.6758 (-3.0%)
TP1 → $92.4521 (+1.5%)
TP2 → $89.1670 (+5.0%)
R/R 1:1.7 • Confidence 64%
The market structure broke lower highs (CHoCH) while volume divergence (CVD) confirmed sellers. A fair‑value gap lines up with an order block, creating a POI where the OB and FVG overlap, giving a clean short entry.
The 3.0% SL is relatively tight, so a 4‑5x leverage keeps exposure reasonable.
Take half profit around the first target as price approaches the nearest support.
Not financial advice — always manage your own risk 🙏
$SOL #SOLUSDT #FedWatch #TradingSignals #Write2Earn
A 3.0% stop sits just below the latest swing low, so a 5x position caps risk at roughly 15% of your account; SOL is testing the 75‑point resistance band and looks primed to break down.
🔴 $SOL SHORT 📉
Entry → $93.7661-$93.9539
Stop → $96.6758 (-3.0%)
TP1 → $92.4521 (+1.5%)
TP2 → $89.1670 (+5.0%)
R/R 1:1.7 • Confidence 64%
The market structure broke lower highs (CHoCH) while volume divergence (CVD) confirmed sellers. A fair‑value gap lines up with an order block, creating a POI where the OB and FVG overlap, giving a clean short entry.
The 3.0% SL is relatively tight, so a 4‑5x leverage keeps exposure reasonable.
Take half profit around the first target as price approaches the nearest support.
Not financial advice — always manage your own risk 🙏
$SOL #SOLUSDT #FedWatch #TradingSignals #Write2Earn
🔴 $SOL SHORT 📉
Entry → $93.7661-$93.9539
Stop → $96.6758 (-3.0%)
TP1 → $92.4521 (+1.5%)
TP2 → $89.1670 (+5.0%)
R/R 1:1.7 • Confidence 64%
The market structure broke lower highs (CHoCH) while volume divergence (CVD) confirmed sellers. A fair‑value gap lines up with an order block, creating a POI where the OB and FVG overlap, giving a clean short entry.
The 3.0% SL is relatively tight, so a 4‑5x leverage keeps exposure reasonable.
Take half profit around the first target as price approaches the nearest support.
Not financial advice — always manage your own risk 🙏
$SOL #SOLUSDT #FedWatch #TradingSignals #Write2Earn
6

·
--
📉 SOL bearish in the short term; rebound still faces pressure
In the early hours of November 2 Beijing time, SOLUSDT was around 94.12, down 1.36% over 24 hours, with futures trading volume of approximately 729 million USDT. OI was about $849 million, up 3.02%, and the funding rate was +0.01% per 8 hours. The price decline alongside rising OI suggests long positions are under pressure. Market data (https://fibonomy.com/en/futures/binance/solusdt)
The 1-hour taker buy/sell volume ratio was 0.88, indicating sellers had the upper hand. The 4-hour RSI(14) was 32, suggesting potential for a rebound amid weakness. Indicator data (https://bykaranteli.com/symbols/SOLUSDT)
Over the next 4–24 hours, the outlook favors a pullback after a rebound encounters resistance. Support is at 93.13; a break below could lead to a test of 92.25. Resistance is at 95.42–95.83. If price breaks through on increased volume and holds above 95.83 at the 4-hour close, the bearish outlook is invalidated, with 96.24 then in view. MACD data is insufficient, so it is not included in the assessment. Range data (https://fapi.binance.com/fapi/v1/ticker/24hr?symbol=SOLUSDT) Historical price levels (https://bykaranteli.com/symbols/SOLUSDT)
#SOL #SOLUSDT #行情分析 #BinanceSquare
📉 SOL bearish in the short term; rebound still faces pressure
In the early hours of November 2 Beijing time, SOLUSDT was around 94.12, down 1.36% over 24 hours, with futures trading volume of approximately 729 million USDT. OI was about $849 million, up 3.02%, and the funding rate was +0.01% per 8 hours. The price decline alongside rising OI suggests long positions are under pressure. Market data (https://fibonomy.com/en/futures/binance/solusdt)
The 1-hour taker buy/sell volume ratio was 0.88, indicating sellers had the upper hand. The 4-hour RSI(14) was 32, suggesting potential for a rebound amid weakness. Indicator data (https://bykaranteli.com/symbols/SOLUSDT)
Over the next 4–24 hours, the outlook favors a pullback after a rebound encounters resistance. Support is at 93.13; a break below could lead to a test of 92.25. Resistance is at 95.42–95.83. If price breaks through on increased volume and holds above 95.83 at the 4-hour close, the bearish outlook is invalidated, with 96.24 then in view. MACD data is insufficient, so it is not included in the assessment. Range data (https://fapi.binance.com/fapi/v1/ticker/24hr?symbol=SOLUSDT) Historical price levels (https://bykaranteli.com/symbols/SOLUSDT)
#SOL #SOLUSDT #行情分析 #BinanceSquare
In the early hours of November 2 Beijing time, SOLUSDT was around 94.12, down 1.36% over 24 hours, with futures trading volume of approximately 729 million USDT. OI was about $849 million, up 3.02%, and the funding rate was +0.01% per 8 hours. The price decline alongside rising OI suggests long positions are under pressure. Market data (https://fibonomy.com/en/futures/binance/solusdt)
The 1-hour taker buy/sell volume ratio was 0.88, indicating sellers had the upper hand. The 4-hour RSI(14) was 32, suggesting potential for a rebound amid weakness. Indicator data (https://bykaranteli.com/symbols/SOLUSDT)
Over the next 4–24 hours, the outlook favors a pullback after a rebound encounters resistance. Support is at 93.13; a break below could lead to a test of 92.25. Resistance is at 95.42–95.83. If price breaks through on increased volume and holds above 95.83 at the 4-hour close, the bearish outlook is invalidated, with 96.24 then in view. MACD data is insufficient, so it is not included in the assessment. Range data (https://fapi.binance.com/fapi/v1/ticker/24hr?symbol=SOLUSDT) Historical price levels (https://bykaranteli.com/symbols/SOLUSDT)
#SOL #SOLUSDT #行情分析 #BinanceSquare
46
See translation
SOL is riding a fresh bullish wave after the recent on‑chain inflow surge, and the price is finally testing the upper half of its weekly range. The market’s appetite for risk is shifting toward high‑growth assets, making SOL a focal point.
🟢 $SOL LONG 📈
Entry $95.5044-$95.6956 | SL $92.7320 (-3.0%) | TP1 $97.0340 (+1.5%) | TP2 $100.3800 (+5.0%) | R/R 1:1.7 | Conf 65%
A clear change of character broke the descending swing, and the CVD turned green confirming buying pressure. The fair value gap left behind lines up perfectly with a strong order block, creating a POI where the OB and FVG overlap. With the structure now forming higher lows, the setup reads like a gritty long entry.
A 3.0% stop is relatively tight on a 1:1.7 reward‑to‑risk profile, so a modest 2×‑3× leverage keeps margin safe.
Take half profit around the first target to lock in gains before the next resistance.
As always: manage your risk, this is not financial advice 🙏
$SOL #SOLUSDT #FedWatch #TradingSignals #Write2Earn
SOL is riding a fresh bullish wave after the recent on‑chain inflow surge, and the price is finally testing the upper half of its weekly range. The market’s appetite for risk is shifting toward high‑growth assets, making SOL a focal point.
🟢 $SOL LONG 📈
Entry $95.5044-$95.6956 | SL $92.7320 (-3.0%) | TP1 $97.0340 (+1.5%) | TP2 $100.3800 (+5.0%) | R/R 1:1.7 | Conf 65%
A clear change of character broke the descending swing, and the CVD turned green confirming buying pressure. The fair value gap left behind lines up perfectly with a strong order block, creating a POI where the OB and FVG overlap. With the structure now forming higher lows, the setup reads like a gritty long entry.
A 3.0% stop is relatively tight on a 1:1.7 reward‑to‑risk profile, so a modest 2×‑3× leverage keeps margin safe.
Take half profit around the first target to lock in gains before the next resistance.
As always: manage your risk, this is not financial advice 🙏
$SOL #SOLUSDT #FedWatch #TradingSignals #Write2Earn
🟢 $SOL LONG 📈
Entry $95.5044-$95.6956 | SL $92.7320 (-3.0%) | TP1 $97.0340 (+1.5%) | TP2 $100.3800 (+5.0%) | R/R 1:1.7 | Conf 65%
A clear change of character broke the descending swing, and the CVD turned green confirming buying pressure. The fair value gap left behind lines up perfectly with a strong order block, creating a POI where the OB and FVG overlap. With the structure now forming higher lows, the setup reads like a gritty long entry.
A 3.0% stop is relatively tight on a 1:1.7 reward‑to‑risk profile, so a modest 2×‑3× leverage keeps margin safe.
Take half profit around the first target to lock in gains before the next resistance.
As always: manage your risk, this is not financial advice 🙏
$SOL #SOLUSDT #FedWatch #TradingSignals #Write2Earn
11
Log in to explore more content
Join global crypto users on Binance Square
⚡️ Get latest and useful information about crypto.
💬 Trusted by the world’s largest crypto exchange.
👍 Discover real insights from verified creators.
Email / Phone number
Trending Topics
1
#USMidterms-WhatAreMarketsExpecting?
11,772 views
229 Discussing
2
#USOctoberNFP-AreRateCutsStillPossible
203,629 views
1,564 Discussing
3
#AMDBeatsExpectations-AINarrativeContinues
1,655 views
87 Discussing
4
#BinanceIncidentReport
146,345 views
1,050 Discussing
5
#BinanceReopensWithdrawalsForMoreAssets
284,089 views
2,156 Discussing
6
#BinanceHourlyDepositsExceedWithdrawals
123,989 views
1,059 Discussing
7
#SouthKoreaRulingPartyLeaderSeeksCryptoTaxDelay
735 views
31 Discussing
8
#MorganStanleyAmongFirstBanksToUseDTCCTokenization
1,009 views
42 Discussing
9
#NasdaqRises0.8%AsChipStocksRebound
1,098 views
32 Discussing
10
#AnthropicIPOPricedDownasInvestorsEye$1.5T
6,407 views
68 Discussing