
Trader Andre
5 Posts

Trader Andre
加密市场交易员 & 研究者|BTC / ETH 趋势交易|🔎 山寨币交易研究 & 机会挖掘|📊 市场周期 / 技术面 / 交易逻辑|只在赔率值得的时候下注。
Frequent Trader
1.5 Years
11 Following
37 Followers
28 Liked
Posts
Hold the ETH long position: the market is still choppy on the short term, which doesn’t mean the 4H uptrend structure has ended.
I’m still holding this ETH long position, and I already have a certain cost advantage.
As of now, ETH is still trading around $2,450. At this level, I won’t start blindly calling for more upside just because I’m in profit, and I also won’t rush to exit just because the short term is seeing fluctuations.
What I care about now is whether the market structure has truly changed.
On the 1H timeframe, ETH has clearly entered a range-bound consolidation recently. Price repeatedly pulls back around the short-term moving averages. The area around 2,476—2,486 has temporarily formed resistance, while 2,449—2,432 is the key support area that needs to be watched first on the short term.
So looking only at 1H, I don’t think it’s a very strong one-way bullish structure. More accurately, it’s:
range trading at higher levels, with the short term slightly weak.
But if we expand to the 4H timeframe, the picture is different.
Currently, ETH is still trading above the 4H EMA20, and it’s also clearly above the EMA50 and EMA200. Therefore, at least up to now, I haven’t seen enough clear evidence that this 4H rise structure has already ended.
That’s also why I’m still willing to continue holding this long position.
Next, I’m mainly watching a few key levels:
2,449—2,432: the first short-term support zone
2,414: an important structural level
2,476—2,486: the resistance that needs to be broken first
around 2,530: a stronger resistance zone above
If later ETH is able to regain and hold above 2,476—2,486, the short-term structure will improve significantly, and I’ll continue observing whether the bulls can trigger another push.
On the other hand, if on the 4H timeframe price effectively breaks down and closes below 2,414, I will start reassessing this long position. And if key structures further down are also lost, then it can’t simply be defined as an ordinary pullback anymore.
My thinking is actually very simple:
With a cost advantage, there’s no need to be driven by every single short-term candlestick.
As long as the higher-timeframe structure hasn’t issued a clear exit signal, I’d rather let profits keep running than close a position I already have just because it’s already profitable.
I’m not predicting the next candlestick, and I’m not calling for some “must go up.”
Watch the structure, defend the key levels, and let the market give the answer.
#ETH #交易记录 #行情分析
I’m still holding this ETH long position, and I already have a certain cost advantage.
As of now, ETH is still trading around $2,450. At this level, I won’t start blindly calling for more upside just because I’m in profit, and I also won’t rush to exit just because the short term is seeing fluctuations.
What I care about now is whether the market structure has truly changed.
On the 1H timeframe, ETH has clearly entered a range-bound consolidation recently. Price repeatedly pulls back around the short-term moving averages. The area around 2,476—2,486 has temporarily formed resistance, while 2,449—2,432 is the key support area that needs to be watched first on the short term.
So looking only at 1H, I don’t think it’s a very strong one-way bullish structure. More accurately, it’s:
range trading at higher levels, with the short term slightly weak.
But if we expand to the 4H timeframe, the picture is different.
Currently, ETH is still trading above the 4H EMA20, and it’s also clearly above the EMA50 and EMA200. Therefore, at least up to now, I haven’t seen enough clear evidence that this 4H rise structure has already ended.
That’s also why I’m still willing to continue holding this long position.
Next, I’m mainly watching a few key levels:
2,449—2,432: the first short-term support zone
2,414: an important structural level
2,476—2,486: the resistance that needs to be broken first
around 2,530: a stronger resistance zone above
If later ETH is able to regain and hold above 2,476—2,486, the short-term structure will improve significantly, and I’ll continue observing whether the bulls can trigger another push.
On the other hand, if on the 4H timeframe price effectively breaks down and closes below 2,414, I will start reassessing this long position. And if key structures further down are also lost, then it can’t simply be defined as an ordinary pullback anymore.
My thinking is actually very simple:
With a cost advantage, there’s no need to be driven by every single short-term candlestick.
As long as the higher-timeframe structure hasn’t issued a clear exit signal, I’d rather let profits keep running than close a position I already have just because it’s already profitable.
I’m not predicting the next candlestick, and I’m not calling for some “must go up.”
Watch the structure, defend the key levels, and let the market give the answer.
#ETH #交易记录 #行情分析
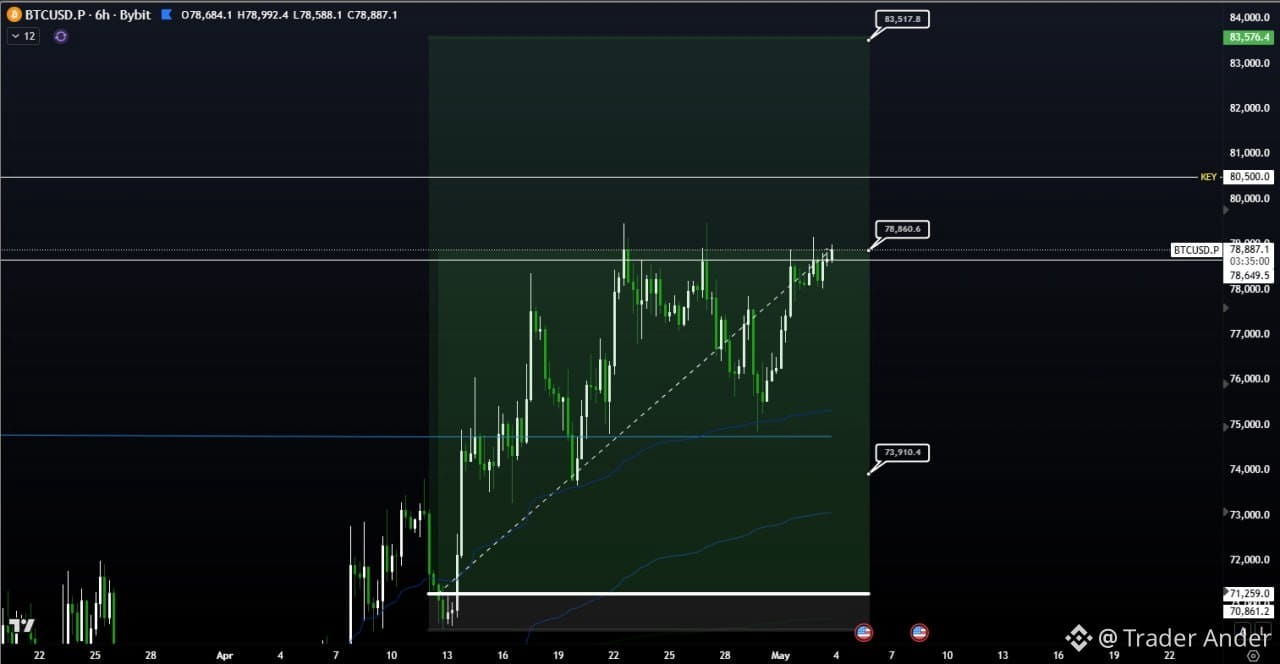
A lot of folks see profits.
I see my own issues.
If this trade had followed the original plan,
I could've held on for much longer.
The market gave me the right answers.
But I still exited too early.
My entry skills determine whether I can make profits.
My holding skills determine how much I can make.
Take note of this.
Next time, do better.
#BTC走势分析
I see my own issues.
If this trade had followed the original plan,
I could've held on for much longer.
The market gave me the right answers.
But I still exited too early.
My entry skills determine whether I can make profits.
My holding skills determine how much I can make.
Take note of this.
Next time, do better.
#BTC走势分析
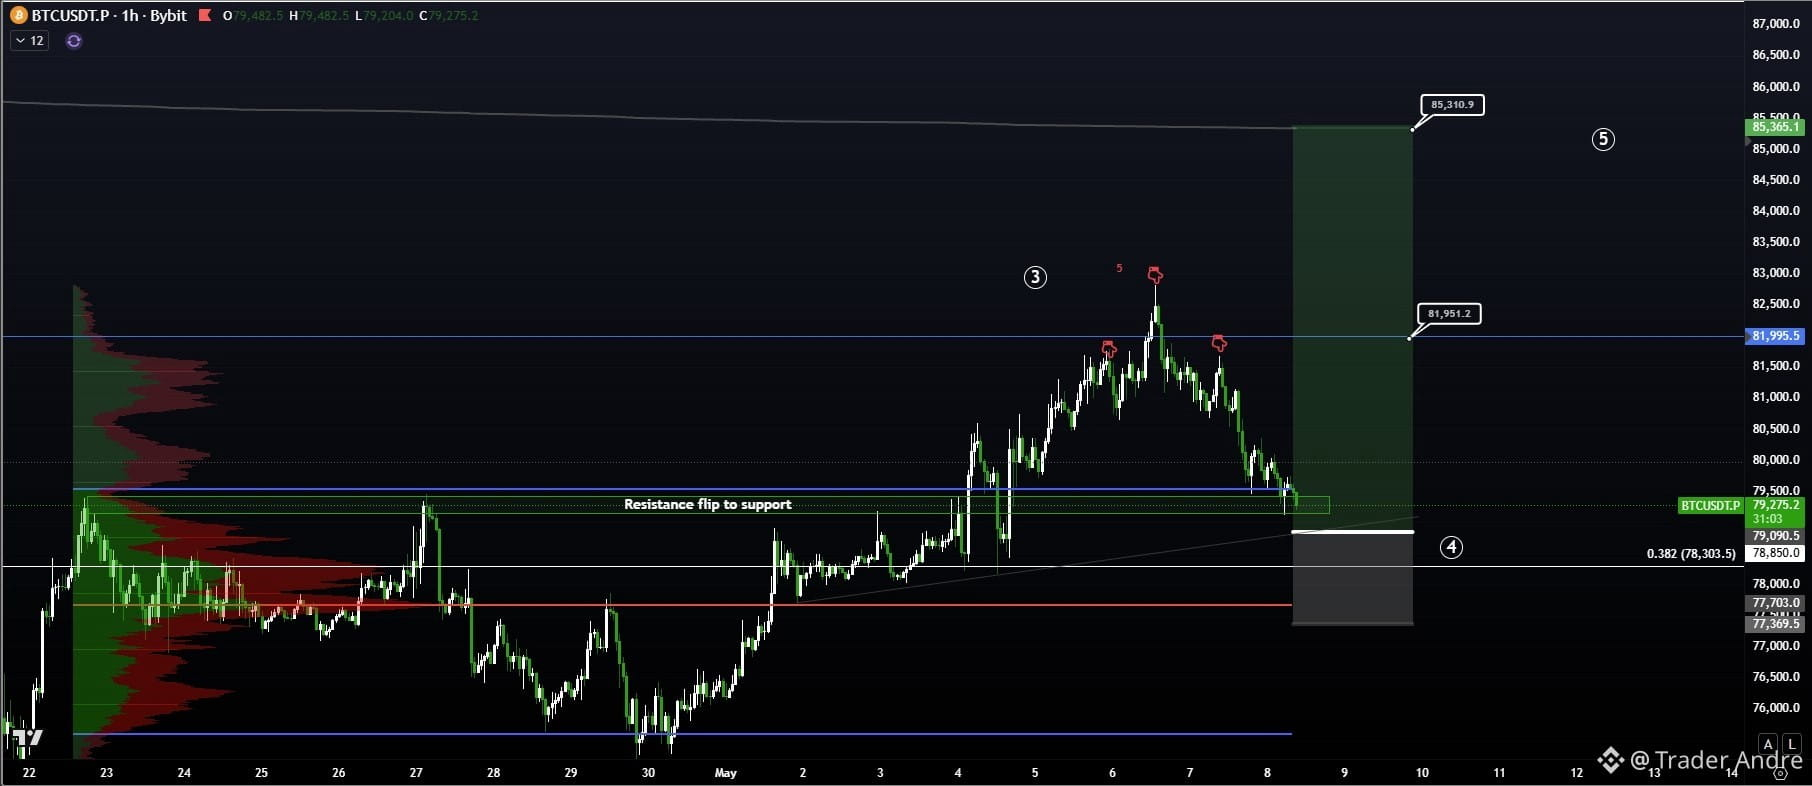
#BTC Limit Order Trading Plan
I'm personally leaning towards the first trend.
Right now, this pullback looks like a normal technical correction to me, aiming to build up momentum for the next leg up.
For those who missed the previous run or closed their longs too early, this might be a re-entry zone worth keeping an eye on.
Trading Plan
📈 Entry Zone: 78850
🛑 Stop Loss: 77380
🎯 First Target: 81953
🎯 Second Target: 85168
🎯 Third Target: Hold and Observe
I'm personally leaning towards the first trend.
Right now, this pullback looks like a normal technical correction to me, aiming to build up momentum for the next leg up.
For those who missed the previous run or closed their longs too early, this might be a re-entry zone worth keeping an eye on.
Trading Plan
📈 Entry Zone: 78850
🛑 Stop Loss: 77380
🎯 First Target: 81953
🎯 Second Target: 85168
🎯 Third Target: Hold and Observe
The current financing rate is in the negative zone, indicating that shorts are continuously paying costs to maintain their positions.
This kind of structure is essentially a "high-pressure environment."
Once the shorts are forced to close their positions, it can easily trigger a rapid upward squeeze.
This kind of structure is essentially a "high-pressure environment."
Once the shorts are forced to close their positions, it can easily trigger a rapid upward squeeze.
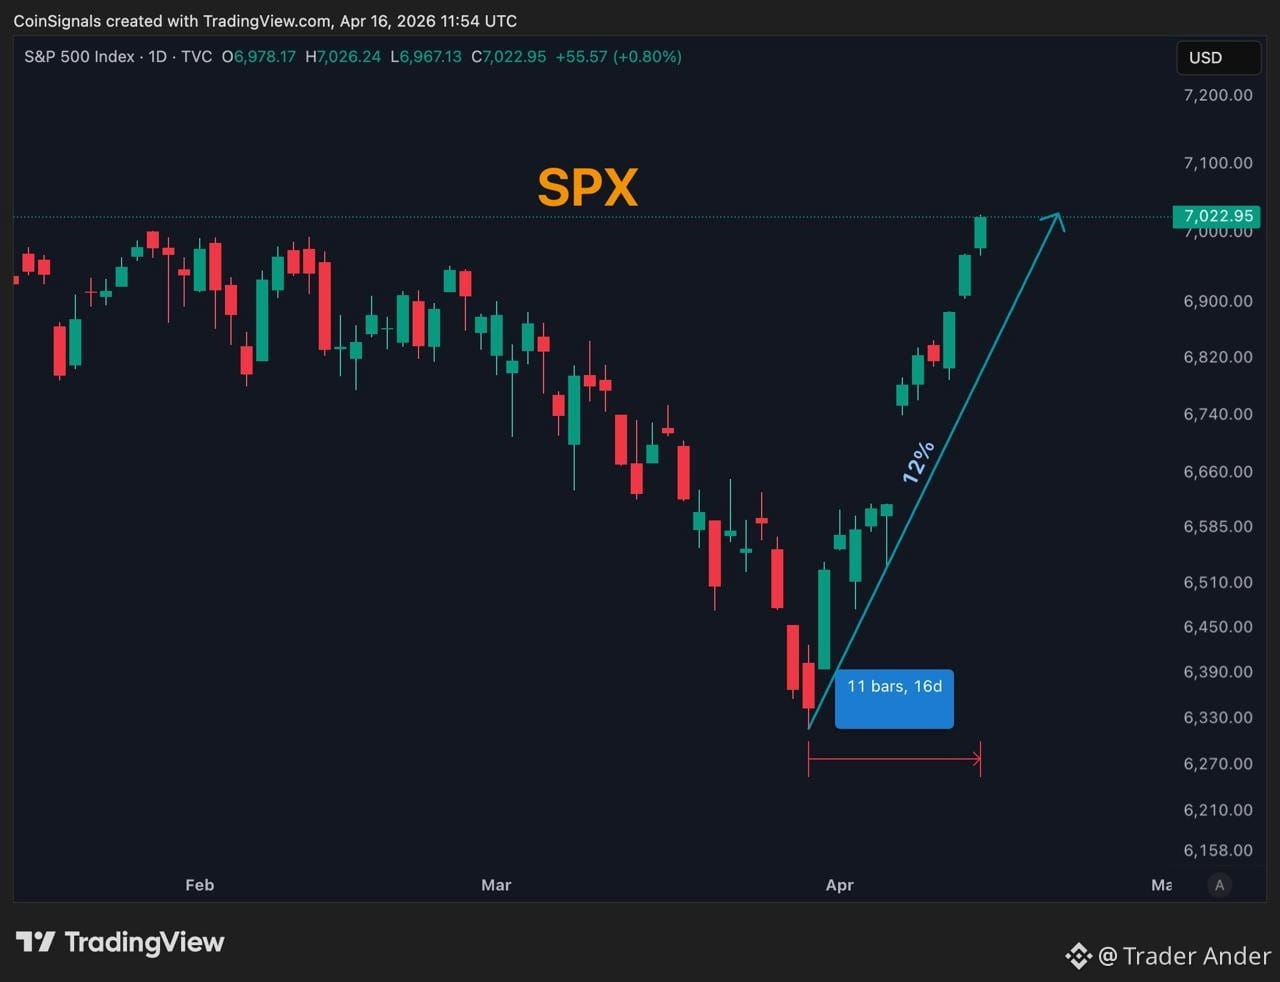
#SPX has risen by more than 12% in just 11 trading days, continuously setting new historical highs.
What’s more interesting is that all of this is happening against a backdrop where the market is still filled with various concerns of war and geopolitical risks.
The price, however, is accelerating upwards.
This trend makes it hard not to suspect that there is significant manipulation and liquidity pushing the market.
When sentiment is continuously pushed higher and the index is relentlessly squeezed upward, it often also means that the market is approaching a potential extreme area.
If there are clear signals of a topping structure or momentum exhaustion in the future,
I would consider looking for shorting opportunities at high levels.
Sometimes, when the market looks the strongest, it is actually not far from a reversal. 📉
#标普500指数 #比特币价格走势 $
What’s more interesting is that all of this is happening against a backdrop where the market is still filled with various concerns of war and geopolitical risks.
The price, however, is accelerating upwards.
This trend makes it hard not to suspect that there is significant manipulation and liquidity pushing the market.
When sentiment is continuously pushed higher and the index is relentlessly squeezed upward, it often also means that the market is approaching a potential extreme area.
If there are clear signals of a topping structure or momentum exhaustion in the future,
I would consider looking for shorting opportunities at high levels.
Sometimes, when the market looks the strongest, it is actually not far from a reversal. 📉
#标普500指数 #比特币价格走势 $
Log in to explore more content