
Dr Crypto_
3.1k Posts

Dr Crypto_
Report
Block User
Expert Market Analyst & Trader 📊. High-Probability Signals & Coin Insights | Let’s master the markets together. 🚀
Open Trade

ADA Holder
Frequent Trader
3.4 Years
0 Following
14.2K+ Followers
8.3K+ Liked
Posts
Portfolio
All
Quotes
Videos
Live
PINNED
·
--

Article
Bitcoin Advances as Oil Surges Toward $100: What the Middle East Crisis Means for Crypto Markets:As Brent crude eyes triple digits on escalating Iran strikes and Hormuz disruptions, Bitcoin quietly rewrites the macro playbook — and I'm watching every move.
By Dr. Crypto | Binance Square | March 16, 2026 |
"In a world where oil barrels and Bitcoin blocks compete for the title of 'ultimate store of value,' the geopolitical scoreboard just flashed red — and Bitcoin is taking notes."
Markets are sending a clear signal: when the world catches fire, money moves.
This weekend, that money — at least a meaningful slice of it — moved into Bitcoin.
As further strikes rocked the Middle East and Brent crude climbed sharply back toward $100 per barrel, BTC posted a 2% gain to trade at $72,490, rebounding sharply after briefly dipping toward $70,500 during volatile weekend sessions.
This is not a coincidence. This is the new macro architecture unfolding in real-time — and every serious market participant needs to understand what it means.
I. The Oil Shock: A Timeline of Disruption
The conflict, which officially escalated on February 28 when the U.S. and Israel launched joint strikes against Iran, has set off one of the most consequential commodity shocks in recent memory.
Within hours of the initial strikes, Bitcoin dropped from $70,000 to below $63,000 — a knee-jerk risk-off response.
But the story didn't end there.
Iran retaliated swiftly, targeting the Strait of Hormuz — the maritime chokepoint that carries roughly one-fifth of the world's oil supply and facilitates over $500 billion in annual energy trade.
Crude spiked briefly above $119 before settling near $100. Meanwhile, Murban crude — the UAE benchmark for barrels that can bypass Hormuz entirely — blew through the $100 level, a stark signal that the physical oil market is pricing in genuine supply disruption, not just geopolitical noise.
Fast-forward to this past week: oil tanker attacks in Iraqi territorial waters sent Brent surging as much as 10.5% in a single session.
Iran's Islamic Revolutionary Guard Corps has now declared a strategic shift from 'reciprocal hits' to 'continuous strikes,' threatening to push oil toward $200 a barrel.
The IEA's proposed 400-million-barrel reserve release has done little to reassure physical markets.
II. Bitcoin's Resilience: The New Safe-Haven Argument
Here is the number that should stop every traditional finance analyst in their tracks: since the Middle East conflict erupted on February 28, Bitcoin has gained approximately +8.5%.
In that same period, the S&P 500 dropped ~1%, Gold fell ~3%, Silver declined ~9%, and tech benchmarks largely stagnated.
Bitcoin — the so-called 'risk asset' — outperformed them all.
Let that sink in for a moment. In the middle of a hot war, with oil tankers on fire in the Persian Gulf and the Strait of Hormuz effectively weaponized, Bitcoin held its ground while the assets that traditional wealth managers have long labeled 'safe havens' quietly bled out.
This is not an accident. Institutional flows are returning. BlackRock's iShares Bitcoin Trust (IBIT) traded 1% higher even on sessions where the S&P 500, Nasdaq 100, Russell 2000, and the Dow were all in the red.
Bitcoin ETFs recorded $1.2 billion in net inflows in the week ending March 15. On-chain data confirm whale accumulation — large holders added over 10,000 BTC to their wallets during the same period.
Trading volumes on BTC/USD pairs surged 15% to approximately $45 billion across spot and derivatives markets.
Dr. Crypto's Read: The market is telling us something fundamental.
When geopolitical risk goes parabolic, Bitcoin is no longer being sold alongside tech stocks — it's being bought alongside the narratives of monetary debasement and energy-backed value.
III. The Oil-Bitcoin Nexus: Two Sides of the Same Coin
The relationship between oil and Bitcoin is nuanced — and often misread by retail traders who treat every correlation as causation.
Let me break it down clearly.
The Bear Case from Oil:
Rising oil fuels inflation, which makes the Fed's rate-cut path even narrower.No rate cuts = tighter financial conditions = pressure on risk assets.Elevated energy costs increase Bitcoin mining expenses in oil-linked electricity markets (mainly UAE and Oman — roughly 8-10% of global hash rate).Stagflation fears — the worst combination of slow growth + high inflation — historically drag all risk assets lower, Bitcoin included.
The Bull Case from Oil:
Oil above $100 erodes confidence in fiat purchasing power — the single most powerful narrative in Bitcoin's entire value proposition.Geopolitical instability drives capital out of the traditional financial system into censorship-resistant, borderless assets. Bitcoin leads this category.The DXY (U.S. Dollar Index) has dipped 2.5% over the last 48 hours — historically, a weaker dollar is rocket fuel for BTC.Historical data shows that strong oil price rallies often coincide with the late stages of the BTC market cycle — the setup for the next leg up.
IV. The Fed Factor: The Wildcard Nobody Wants to Talk About
Let's address the elephant in the room: the Federal Reserve's March 17–18 meeting.
With oil firmly above $100, inflation expectations are re-anchoring higher.
The probability of near-term rate cuts — already slim — has now shrunk to near zero.
This matters for Bitcoin because high interest rates mean higher opportunity cost for holding non-yielding assets.
It's the same argument bears have been making for two years.
But here's the counter-argument that the bears consistently miss: in a world where the U.S. dollar is being actively weaponized, where geopolitical risk is structurally elevated, and where central banks have already debased their currencies by extraordinary amounts — the 'risk-free rate' argument is increasingly losing its persuasive power.
Bitcoin's RSI currently sits at 62 — room for further upside without entering overbought territory.
The MACD shows bullish crossovers on the daily chart. The technical structure is not broken.
But the $73,000–$74,000 resistance range has repeatedly acted as a ceiling.
Breaking above it decisively — especially if oil reverses or the Fed signals a dovish pivot — could ignite the next explosive move.
V. Looking Ahead: Catalysts & Risk Scenarios
What happens next will likely be determined by one or more of these critical catalysts:
Ceasefire Signal: Any credible move toward de-escalation in the Middle East could take $20-$30 off the oil price overnight, relieve macro pressure, and potentially ignite Bitcoin's next leg toward $80,000+.G7 Strategic Reserve Release: The proposed 300–400 million barrel SPR release, with support from the U.S. and two other G7 nations, could meaningfully cool oil prices and remove a key headwind for risk assets.Fed Pivot: Even a hint of rate cuts — triggered by growth concerns overriding inflation fears — would be extraordinarily bullish for BTC.Escalation Risk: If the conflict widens or the Strait of Hormuz is fully closed for an extended period, stagflation becomes a genuine macro regime — and Bitcoin's near-term downside toward $60,000 becomes a real conversation.Trump's Oil Diplomacy: President Trump stated oil prices 'will drop rapidly' when the 'Iran nuclear threat is over' — characterizing the current spike as 'a very small price to pay.'
If Washington succeeds in resolving the conflict diplomatically, the macro backdrop could shift dramatically within weeks.
⚡ DR. CRYPTO'S VERDICT
Bitcoin is not flying because of oil. Bitcoin is flying despite oil — and that distinction is everything.
The narrative that Bitcoin is a pure risk-on asset that collapses with every macro shock is being systematically dismantled by the data.
Yes, the $73,000–$74,000 range is a wall. Yes, stagflation risks are real. Yes, the Fed is in a bind.
But Bitcoin's structural demand — institutional ETF inflows, whale accumulation, and its role as a geopolitical hedge — is growing faster than the macro headwinds.
My positioning: Watching $73,500 as the key breakout level.
A weekly close above it — especially accompanied by declining oil and a dovish Fed signal — would be my trigger for the next major accumulation phase.
Until then, I'm sizing for volatility and staying patient.
The war for $100K is not over. It's just getting interesting.
DISCLAIMER: This article is authored by Dr. Crypto for Binance Square and is intended for educational and informational purposes only.
Nothing herein constitutes financial advice, investment advice, or a solicitation to buy or sell any asset.
Cryptocurrency markets are highly volatile. Always conduct your own due diligence. Past performance is not indicative of future results.
All market data referenced was accurate at time of publication, March 16, 2026.
Follow Dr. Crypto on Binance Square
#MetaPlansLayoffs
#BTCReclaims70k
#PCEMarketWatch
$BTC $ETH
Bitcoin Advances as Oil Surges Toward $100: What the Middle East Crisis Means for Crypto Markets:
As Brent crude eyes triple digits on escalating Iran strikes and Hormuz disruptions, Bitcoin quietly rewrites the macro playbook — and I'm watching every move.
By Dr. Crypto | Binance Square | March 16, 2026 |
"In a world where oil barrels and Bitcoin blocks compete for the title of 'ultimate store of value,' the geopolitical scoreboard just flashed red — and Bitcoin is taking notes."
Markets are sending a clear signal: when the world catches fire, money moves.
This weekend, that money — at least a meaningful slice of it — moved into Bitcoin.
As further strikes rocked the Middle East and Brent crude climbed sharply back toward $100 per barrel, BTC posted a 2% gain to trade at $72,490, rebounding sharply after briefly dipping toward $70,500 during volatile weekend sessions.
This is not a coincidence. This is the new macro architecture unfolding in real-time — and every serious market participant needs to understand what it means.
I. The Oil Shock: A Timeline of Disruption
The conflict, which officially escalated on February 28 when the U.S. and Israel launched joint strikes against Iran, has set off one of the most consequential commodity shocks in recent memory.
Within hours of the initial strikes, Bitcoin dropped from $70,000 to below $63,000 — a knee-jerk risk-off response.
But the story didn't end there.
Iran retaliated swiftly, targeting the Strait of Hormuz — the maritime chokepoint that carries roughly one-fifth of the world's oil supply and facilitates over $500 billion in annual energy trade.
Crude spiked briefly above $119 before settling near $100. Meanwhile, Murban crude — the UAE benchmark for barrels that can bypass Hormuz entirely — blew through the $100 level, a stark signal that the physical oil market is pricing in genuine supply disruption, not just geopolitical noise.
Fast-forward to this past week: oil tanker attacks in Iraqi territorial waters sent Brent surging as much as 10.5% in a single session.
Iran's Islamic Revolutionary Guard Corps has now declared a strategic shift from 'reciprocal hits' to 'continuous strikes,' threatening to push oil toward $200 a barrel.
The IEA's proposed 400-million-barrel reserve release has done little to reassure physical markets.
II. Bitcoin's Resilience: The New Safe-Haven Argument
Here is the number that should stop every traditional finance analyst in their tracks: since the Middle East conflict erupted on February 28, Bitcoin has gained approximately +8.5%.
In that same period, the S&P 500 dropped ~1%, Gold fell ~3%, Silver declined ~9%, and tech benchmarks largely stagnated.
Bitcoin — the so-called 'risk asset' — outperformed them all.
Let that sink in for a moment. In the middle of a hot war, with oil tankers on fire in the Persian Gulf and the Strait of Hormuz effectively weaponized, Bitcoin held its ground while the assets that traditional wealth managers have long labeled 'safe havens' quietly bled out.
This is not an accident. Institutional flows are returning. BlackRock's iShares Bitcoin Trust (IBIT) traded 1% higher even on sessions where the S&P 500, Nasdaq 100, Russell 2000, and the Dow were all in the red.
Bitcoin ETFs recorded $1.2 billion in net inflows in the week ending March 15. On-chain data confirm whale accumulation — large holders added over 10,000 BTC to their wallets during the same period.
Trading volumes on BTC/USD pairs surged 15% to approximately $45 billion across spot and derivatives markets.
Dr. Crypto's Read: The market is telling us something fundamental.
When geopolitical risk goes parabolic, Bitcoin is no longer being sold alongside tech stocks — it's being bought alongside the narratives of monetary debasement and energy-backed value.
III. The Oil-Bitcoin Nexus: Two Sides of the Same Coin
The relationship between oil and Bitcoin is nuanced — and often misread by retail traders who treat every correlation as causation.
Let me break it down clearly.
The Bear Case from Oil:
Rising oil fuels inflation, which makes the Fed's rate-cut path even narrower.No rate cuts = tighter financial conditions = pressure on risk assets.Elevated energy costs increase Bitcoin mining expenses in oil-linked electricity markets (mainly UAE and Oman — roughly 8-10% of global hash rate).Stagflation fears — the worst combination of slow growth + high inflation — historically drag all risk assets lower, Bitcoin included.
The Bull Case from Oil:
Oil above $100 erodes confidence in fiat purchasing power — the single most powerful narrative in Bitcoin's entire value proposition.Geopolitical instability drives capital out of the traditional financial system into censorship-resistant, borderless assets. Bitcoin leads this category.The DXY (U.S. Dollar Index) has dipped 2.5% over the last 48 hours — historically, a weaker dollar is rocket fuel for BTC.Historical data shows that strong oil price rallies often coincide with the late stages of the BTC market cycle — the setup for the next leg up.
IV. The Fed Factor: The Wildcard Nobody Wants to Talk About
Let's address the elephant in the room: the Federal Reserve's March 17–18 meeting.
With oil firmly above $100, inflation expectations are re-anchoring higher.
The probability of near-term rate cuts — already slim — has now shrunk to near zero.
This matters for Bitcoin because high interest rates mean higher opportunity cost for holding non-yielding assets.
It's the same argument bears have been making for two years.
But here's the counter-argument that the bears consistently miss: in a world where the U.S. dollar is being actively weaponized, where geopolitical risk is structurally elevated, and where central banks have already debased their currencies by extraordinary amounts — the 'risk-free rate' argument is increasingly losing its persuasive power.
Bitcoin's RSI currently sits at 62 — room for further upside without entering overbought territory.
The MACD shows bullish crossovers on the daily chart. The technical structure is not broken.
But the $73,000–$74,000 resistance range has repeatedly acted as a ceiling.
Breaking above it decisively — especially if oil reverses or the Fed signals a dovish pivot — could ignite the next explosive move.
V. Looking Ahead: Catalysts & Risk Scenarios
What happens next will likely be determined by one or more of these critical catalysts:
Ceasefire Signal: Any credible move toward de-escalation in the Middle East could take $20-$30 off the oil price overnight, relieve macro pressure, and potentially ignite Bitcoin's next leg toward $80,000+.G7 Strategic Reserve Release: The proposed 300–400 million barrel SPR release, with support from the U.S. and two other G7 nations, could meaningfully cool oil prices and remove a key headwind for risk assets.Fed Pivot: Even a hint of rate cuts — triggered by growth concerns overriding inflation fears — would be extraordinarily bullish for BTC.Escalation Risk: If the conflict widens or the Strait of Hormuz is fully closed for an extended period, stagflation becomes a genuine macro regime — and Bitcoin's near-term downside toward $60,000 becomes a real conversation.Trump's Oil Diplomacy: President Trump stated oil prices 'will drop rapidly' when the 'Iran nuclear threat is over' — characterizing the current spike as 'a very small price to pay.'
If Washington succeeds in resolving the conflict diplomatically, the macro backdrop could shift dramatically within weeks.
⚡ DR. CRYPTO'S VERDICT
Bitcoin is not flying because of oil. Bitcoin is flying despite oil — and that distinction is everything.
The narrative that Bitcoin is a pure risk-on asset that collapses with every macro shock is being systematically dismantled by the data.
Yes, the $73,000–$74,000 range is a wall. Yes, stagflation risks are real. Yes, the Fed is in a bind.
But Bitcoin's structural demand — institutional ETF inflows, whale accumulation, and its role as a geopolitical hedge — is growing faster than the macro headwinds.
My positioning: Watching $73,500 as the key breakout level.
A weekly close above it — especially accompanied by declining oil and a dovish Fed signal — would be my trigger for the next major accumulation phase.
Until then, I'm sizing for volatility and staying patient.
The war for $100K is not over. It's just getting interesting.
DISCLAIMER: This article is authored by Dr. Crypto for Binance Square and is intended for educational and informational purposes only.
Nothing herein constitutes financial advice, investment advice, or a solicitation to buy or sell any asset.
Cryptocurrency markets are highly volatile. Always conduct your own due diligence. Past performance is not indicative of future results.
All market data referenced was accurate at time of publication, March 16, 2026.
Follow Dr. Crypto on Binance Square
#MetaPlansLayoffs
#BTCReclaims70k
#PCEMarketWatch
$BTC $ETH
By Dr. Crypto | Binance Square | March 16, 2026 |
"In a world where oil barrels and Bitcoin blocks compete for the title of 'ultimate store of value,' the geopolitical scoreboard just flashed red — and Bitcoin is taking notes."
Markets are sending a clear signal: when the world catches fire, money moves.
This weekend, that money — at least a meaningful slice of it — moved into Bitcoin.
As further strikes rocked the Middle East and Brent crude climbed sharply back toward $100 per barrel, BTC posted a 2% gain to trade at $72,490, rebounding sharply after briefly dipping toward $70,500 during volatile weekend sessions.
This is not a coincidence. This is the new macro architecture unfolding in real-time — and every serious market participant needs to understand what it means.
I. The Oil Shock: A Timeline of Disruption
The conflict, which officially escalated on February 28 when the U.S. and Israel launched joint strikes against Iran, has set off one of the most consequential commodity shocks in recent memory.
Within hours of the initial strikes, Bitcoin dropped from $70,000 to below $63,000 — a knee-jerk risk-off response.
But the story didn't end there.
Iran retaliated swiftly, targeting the Strait of Hormuz — the maritime chokepoint that carries roughly one-fifth of the world's oil supply and facilitates over $500 billion in annual energy trade.
Crude spiked briefly above $119 before settling near $100. Meanwhile, Murban crude — the UAE benchmark for barrels that can bypass Hormuz entirely — blew through the $100 level, a stark signal that the physical oil market is pricing in genuine supply disruption, not just geopolitical noise.
Fast-forward to this past week: oil tanker attacks in Iraqi territorial waters sent Brent surging as much as 10.5% in a single session.
Iran's Islamic Revolutionary Guard Corps has now declared a strategic shift from 'reciprocal hits' to 'continuous strikes,' threatening to push oil toward $200 a barrel.
The IEA's proposed 400-million-barrel reserve release has done little to reassure physical markets.
II. Bitcoin's Resilience: The New Safe-Haven Argument
Here is the number that should stop every traditional finance analyst in their tracks: since the Middle East conflict erupted on February 28, Bitcoin has gained approximately +8.5%.
In that same period, the S&P 500 dropped ~1%, Gold fell ~3%, Silver declined ~9%, and tech benchmarks largely stagnated.
Bitcoin — the so-called 'risk asset' — outperformed them all.
Let that sink in for a moment. In the middle of a hot war, with oil tankers on fire in the Persian Gulf and the Strait of Hormuz effectively weaponized, Bitcoin held its ground while the assets that traditional wealth managers have long labeled 'safe havens' quietly bled out.
This is not an accident. Institutional flows are returning. BlackRock's iShares Bitcoin Trust (IBIT) traded 1% higher even on sessions where the S&P 500, Nasdaq 100, Russell 2000, and the Dow were all in the red.
Bitcoin ETFs recorded $1.2 billion in net inflows in the week ending March 15. On-chain data confirm whale accumulation — large holders added over 10,000 BTC to their wallets during the same period.
Trading volumes on BTC/USD pairs surged 15% to approximately $45 billion across spot and derivatives markets.
Dr. Crypto's Read: The market is telling us something fundamental.
When geopolitical risk goes parabolic, Bitcoin is no longer being sold alongside tech stocks — it's being bought alongside the narratives of monetary debasement and energy-backed value.
III. The Oil-Bitcoin Nexus: Two Sides of the Same Coin
The relationship between oil and Bitcoin is nuanced — and often misread by retail traders who treat every correlation as causation.
Let me break it down clearly.
The Bear Case from Oil:
Rising oil fuels inflation, which makes the Fed's rate-cut path even narrower.No rate cuts = tighter financial conditions = pressure on risk assets.Elevated energy costs increase Bitcoin mining expenses in oil-linked electricity markets (mainly UAE and Oman — roughly 8-10% of global hash rate).Stagflation fears — the worst combination of slow growth + high inflation — historically drag all risk assets lower, Bitcoin included.
The Bull Case from Oil:
Oil above $100 erodes confidence in fiat purchasing power — the single most powerful narrative in Bitcoin's entire value proposition.Geopolitical instability drives capital out of the traditional financial system into censorship-resistant, borderless assets. Bitcoin leads this category.The DXY (U.S. Dollar Index) has dipped 2.5% over the last 48 hours — historically, a weaker dollar is rocket fuel for BTC.Historical data shows that strong oil price rallies often coincide with the late stages of the BTC market cycle — the setup for the next leg up.
IV. The Fed Factor: The Wildcard Nobody Wants to Talk About
Let's address the elephant in the room: the Federal Reserve's March 17–18 meeting.
With oil firmly above $100, inflation expectations are re-anchoring higher.
The probability of near-term rate cuts — already slim — has now shrunk to near zero.
This matters for Bitcoin because high interest rates mean higher opportunity cost for holding non-yielding assets.
It's the same argument bears have been making for two years.
But here's the counter-argument that the bears consistently miss: in a world where the U.S. dollar is being actively weaponized, where geopolitical risk is structurally elevated, and where central banks have already debased their currencies by extraordinary amounts — the 'risk-free rate' argument is increasingly losing its persuasive power.
Bitcoin's RSI currently sits at 62 — room for further upside without entering overbought territory.
The MACD shows bullish crossovers on the daily chart. The technical structure is not broken.
But the $73,000–$74,000 resistance range has repeatedly acted as a ceiling.
Breaking above it decisively — especially if oil reverses or the Fed signals a dovish pivot — could ignite the next explosive move.
V. Looking Ahead: Catalysts & Risk Scenarios
What happens next will likely be determined by one or more of these critical catalysts:
Ceasefire Signal: Any credible move toward de-escalation in the Middle East could take $20-$30 off the oil price overnight, relieve macro pressure, and potentially ignite Bitcoin's next leg toward $80,000+.G7 Strategic Reserve Release: The proposed 300–400 million barrel SPR release, with support from the U.S. and two other G7 nations, could meaningfully cool oil prices and remove a key headwind for risk assets.Fed Pivot: Even a hint of rate cuts — triggered by growth concerns overriding inflation fears — would be extraordinarily bullish for BTC.Escalation Risk: If the conflict widens or the Strait of Hormuz is fully closed for an extended period, stagflation becomes a genuine macro regime — and Bitcoin's near-term downside toward $60,000 becomes a real conversation.Trump's Oil Diplomacy: President Trump stated oil prices 'will drop rapidly' when the 'Iran nuclear threat is over' — characterizing the current spike as 'a very small price to pay.'
If Washington succeeds in resolving the conflict diplomatically, the macro backdrop could shift dramatically within weeks.
⚡ DR. CRYPTO'S VERDICT
Bitcoin is not flying because of oil. Bitcoin is flying despite oil — and that distinction is everything.
The narrative that Bitcoin is a pure risk-on asset that collapses with every macro shock is being systematically dismantled by the data.
Yes, the $73,000–$74,000 range is a wall. Yes, stagflation risks are real. Yes, the Fed is in a bind.
But Bitcoin's structural demand — institutional ETF inflows, whale accumulation, and its role as a geopolitical hedge — is growing faster than the macro headwinds.
My positioning: Watching $73,500 as the key breakout level.
A weekly close above it — especially accompanied by declining oil and a dovish Fed signal — would be my trigger for the next major accumulation phase.
Until then, I'm sizing for volatility and staying patient.
The war for $100K is not over. It's just getting interesting.
DISCLAIMER: This article is authored by Dr. Crypto for Binance Square and is intended for educational and informational purposes only.
Nothing herein constitutes financial advice, investment advice, or a solicitation to buy or sell any asset.
Cryptocurrency markets are highly volatile. Always conduct your own due diligence. Past performance is not indicative of future results.
All market data referenced was accurate at time of publication, March 16, 2026.
Follow Dr. Crypto on Binance Square
#MetaPlansLayoffs
#BTCReclaims70k
#PCEMarketWatch
$BTC $ETH
5
2
34
9.7k
PINNED
·
--
Article
You Don't Need to Be Right. You Need to Be Smart About Risk:By Dr Crypto | Binance Square
Most traders obsess over one thing their win rate. They want to be right. They want to predict correctly. They think accuracy is what separates profitable traders from losing ones.
It isn't. And I can prove it with simple math.
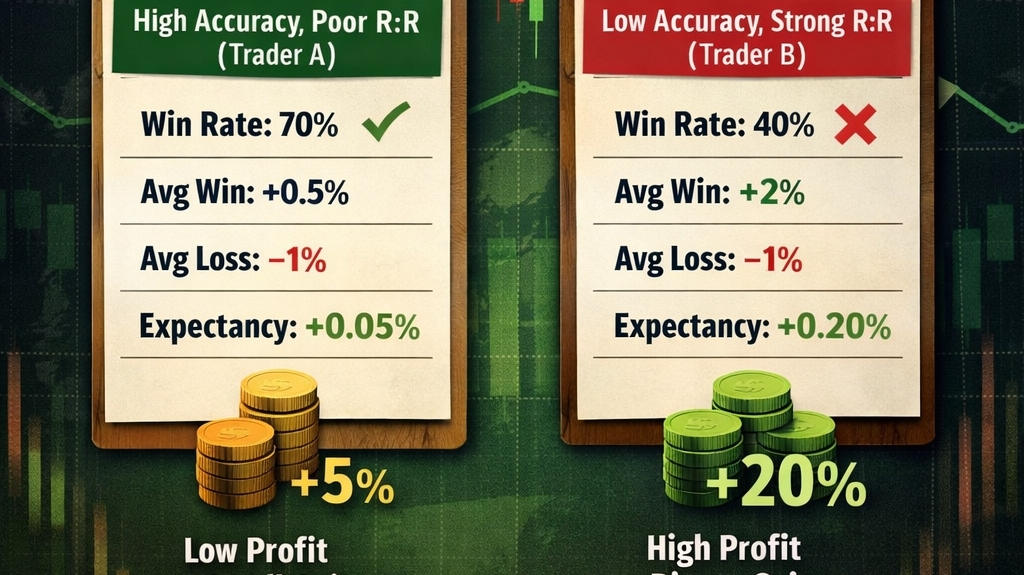
Two Traders. Same Market. Opposite Results.
Trader A wins 70% of his trades. Sounds impressive, right? But his average win is $100 and his average loss is $300. After 100 trades, he made $7,000 in winners, and lost 9,000 in losers.
Net result: −2,000. A losing account.
Trader B wins only 40% of his trades. Most people would call him a bad trader. But his average win is $300 and his average loss is $100. After 100 trades, he made $12,000 in winners and lost $6,000 in losers. Net result: +$6,000. A growing account.
Same market. Same number of trades. Trader B wins less often and still comes out $8,000 ahead of Trader A.
This isn't luck. This is math.
The Only Formula That Matters
At a 1:2 Risk-to-Reward ratio, you only need to win 34% of your trades to be profitable. At 1:3, you only need 25%. That means you can be wrong 3 out of every 4 trades and still make money as long as your winners are big and your losers are small.
Win rate is a vanity metric. Risk-to-Reward ratio is the real performance metric.
Why Most Traders Get This Backwards
The reason traders lose isn't bad entries. It's bad exits.
They close winning trades early because they're afraid the profit will disappear. And they hold losing trades too long because admitting a loss feels like admitting they were wrong.
The result? Small wins. Big losses. A negative R:R ratio they've built with their own hands.
The market doesn't punish bad analysis. It punishes bad risk management.
What to Do Instead
Before every trade, ask two questions: Where is my stop loss? Where is my target? If the potential reward isn't at least 2× the risk, don't take the trade. Simple rule. Hard to follow. Life-changing when you do.
Set your stop. Set your target. Then don't touch it.
Let the math work over 100 trades, and you don't need to be the smartest person in the room. You just need to be the most disciplined.
Profitability isn't about prediction. It's about protecting your downside and letting your upside breathe.
That's the edge. Everything else is noise.
#ProfitPotential
#TradingTales
$BTC $ETH
@BiBi
You Don't Need to Be Right. You Need to Be Smart About Risk:
By Dr Crypto | Binance Square
Most traders obsess over one thing their win rate. They want to be right. They want to predict correctly. They think accuracy is what separates profitable traders from losing ones.
It isn't. And I can prove it with simple math.
Two Traders. Same Market. Opposite Results.
Trader A wins 70% of his trades. Sounds impressive, right? But his average win is $100 and his average loss is $300. After 100 trades, he made $7,000 in winners, and lost 9,000 in losers.
Net result: −2,000. A losing account.
Trader B wins only 40% of his trades. Most people would call him a bad trader. But his average win is $300 and his average loss is $100. After 100 trades, he made $12,000 in winners and lost $6,000 in losers. Net result: +$6,000. A growing account.
Same market. Same number of trades. Trader B wins less often and still comes out $8,000 ahead of Trader A.
This isn't luck. This is math.
The Only Formula That Matters
At a 1:2 Risk-to-Reward ratio, you only need to win 34% of your trades to be profitable. At 1:3, you only need 25%. That means you can be wrong 3 out of every 4 trades and still make money as long as your winners are big and your losers are small.
Win rate is a vanity metric. Risk-to-Reward ratio is the real performance metric.
Why Most Traders Get This Backwards
The reason traders lose isn't bad entries. It's bad exits.
They close winning trades early because they're afraid the profit will disappear. And they hold losing trades too long because admitting a loss feels like admitting they were wrong.
The result? Small wins. Big losses. A negative R:R ratio they've built with their own hands.
The market doesn't punish bad analysis. It punishes bad risk management.
What to Do Instead
Before every trade, ask two questions: Where is my stop loss? Where is my target? If the potential reward isn't at least 2× the risk, don't take the trade. Simple rule. Hard to follow. Life-changing when you do.
Set your stop. Set your target. Then don't touch it.
Let the math work over 100 trades, and you don't need to be the smartest person in the room. You just need to be the most disciplined.
Profitability isn't about prediction. It's about protecting your downside and letting your upside breathe.
That's the edge. Everything else is noise.
#ProfitPotential
#TradingTales
$BTC $ETH
@BiBi
Most traders obsess over one thing their win rate. They want to be right. They want to predict correctly. They think accuracy is what separates profitable traders from losing ones.
It isn't. And I can prove it with simple math.
Two Traders. Same Market. Opposite Results.
Trader A wins 70% of his trades. Sounds impressive, right? But his average win is $100 and his average loss is $300. After 100 trades, he made $7,000 in winners, and lost 9,000 in losers.
Net result: −2,000. A losing account.
Trader B wins only 40% of his trades. Most people would call him a bad trader. But his average win is $300 and his average loss is $100. After 100 trades, he made $12,000 in winners and lost $6,000 in losers. Net result: +$6,000. A growing account.
Same market. Same number of trades. Trader B wins less often and still comes out $8,000 ahead of Trader A.
This isn't luck. This is math.
The Only Formula That Matters
At a 1:2 Risk-to-Reward ratio, you only need to win 34% of your trades to be profitable. At 1:3, you only need 25%. That means you can be wrong 3 out of every 4 trades and still make money as long as your winners are big and your losers are small.
Win rate is a vanity metric. Risk-to-Reward ratio is the real performance metric.
Why Most Traders Get This Backwards
The reason traders lose isn't bad entries. It's bad exits.
They close winning trades early because they're afraid the profit will disappear. And they hold losing trades too long because admitting a loss feels like admitting they were wrong.
The result? Small wins. Big losses. A negative R:R ratio they've built with their own hands.
The market doesn't punish bad analysis. It punishes bad risk management.
What to Do Instead
Before every trade, ask two questions: Where is my stop loss? Where is my target? If the potential reward isn't at least 2× the risk, don't take the trade. Simple rule. Hard to follow. Life-changing when you do.
Set your stop. Set your target. Then don't touch it.
Let the math work over 100 trades, and you don't need to be the smartest person in the room. You just need to be the most disciplined.
Profitability isn't about prediction. It's about protecting your downside and letting your upside breathe.
That's the edge. Everything else is noise.
#ProfitPotential
#TradingTales
$BTC $ETH
@BiBi
21
98
25.5k
·
--
egld long trade signal 👇$EGLD long/buy trade setup
Entry: 3.82 – 3.90
🎯 TP1: 4.10
🎯 TP2: 4.35
🎯 TP3: 4.70
🛑 SL: 3.62
🚀 Hold above 3.80 → bullish continuation remains on the table.
Trade 👇
{future}(EGLDUSDT)
egld long trade signal 👇
$EGLD long/buy trade setup
Entry: 3.82 – 3.90
🎯 TP1: 4.10
🎯 TP2: 4.35
🎯 TP3: 4.70
🛑 SL: 3.62
🚀 Hold above 3.80 → bullish continuation remains on the table.
Trade 👇
Entry: 3.82 – 3.90
🎯 TP1: 4.10
🎯 TP2: 4.35
🎯 TP3: 4.70
🛑 SL: 3.62
🚀 Hold above 3.80 → bullish continuation remains on the table.
Trade 👇
258
·
--
$EGLD long trade signal
Entry: 3.82 – 3.90
🎯 TP1: 4.10
🎯 TP2: 4.35
🎯 TP3: 4.70
🛑 SL: 3.62
🚀 Hold above 3.80 → bullish continuation remains on the table.
trade 👇
{future}(EGLDUSDT)
$EGLD long trade signal
Entry: 3.82 – 3.90
🎯 TP1: 4.10
🎯 TP2: 4.35
🎯 TP3: 4.70
🛑 SL: 3.62
🚀 Hold above 3.80 → bullish continuation remains on the table.
trade 👇
Entry: 3.82 – 3.90
🎯 TP1: 4.10
🎯 TP2: 4.35
🎯 TP3: 4.70
🛑 SL: 3.62
🚀 Hold above 3.80 → bullish continuation remains on the table.
trade 👇
95
·
--
xrp usdt trade single 👇Short $XRP
Entry: 1.39–1.40
SL: 1.45
TP1: 1.36
TP2: 1.33
TP3: 1.30
Seller defense may strengthen here. Rejection could start a corrective move lower.
Trade $XRP here 👇
{future}(XRPUSDT)
xrp usdt trade single 👇
Short $XRP
Entry: 1.39–1.40
SL: 1.45
TP1: 1.36
TP2: 1.33
TP3: 1.30
Seller defense may strengthen here. Rejection could start a corrective move lower.
Trade $XRP here 👇
Entry: 1.39–1.40
SL: 1.45
TP1: 1.36
TP2: 1.33
TP3: 1.30
Seller defense may strengthen here. Rejection could start a corrective move lower.
Trade $XRP here 👇
1
438
·
--
Bearish
Short $XRP
Entry: 1.39–1.40
SL: 1.45
TP1: 1.36
TP2: 1.33
TP3: 1.30
Seller defense may strengthen here. Rejection could start a corrective move lower.
Trade $XRP here 👇
{future}(XRPUSDT)
Short $XRP
Entry: 1.39–1.40
SL: 1.45
TP1: 1.36
TP2: 1.33
TP3: 1.30
Seller defense may strengthen here. Rejection could start a corrective move lower.
Trade $XRP here 👇
Entry: 1.39–1.40
SL: 1.45
TP1: 1.36
TP2: 1.33
TP3: 1.30
Seller defense may strengthen here. Rejection could start a corrective move lower.
Trade $XRP here 👇
55
·
--
bnb trade setup, join the group for premium access$BNB trade setup long/buy
the liquidity sweep is pending
entry : market price or 670
profit 745 and above
sl 618
Trade $BNB below 👇
{future}(BNBUSDT)
join the chat room for premium access
or dm me for a trading related questions
bnb trade setup, join the group for premium access
$BNB trade setup long/buy
the liquidity sweep is pending
entry : market price or 670
profit 745 and above
sl 618
Trade $BNB below 👇
join the chat room for premium access
or dm me for a trading related questions
the liquidity sweep is pending
entry : market price or 670
profit 745 and above
sl 618
Trade $BNB below 👇
join the chat room for premium access
or dm me for a trading related questions
1
158
·
--
Bullish
$BNB trade setup long/buy
the liquidity sweep is pending
entry : market price or 670
profit 745 and above
sl 618
trade $BNB 👇
{future}(BNBUSDT)
join the chat room for premium access
or dm me for a trading related questions
$BNB trade setup long/buy
the liquidity sweep is pending
entry : market price or 670
profit 745 and above
sl 618
trade $BNB 👇
join the chat room for premium access
or dm me for a trading related questions
the liquidity sweep is pending
entry : market price or 670
profit 745 and above
sl 618
trade $BNB 👇
join the chat room for premium access
or dm me for a trading related questions
60
·
--
btc trade single 👇, join the group for premium access to setups$BTC long / buy trade setup
entry 78700-78000
sl 76700
tp 79200-79400
Long $BTC 👇
{future}(BTCUSDT)
btc trade single 👇, join the group for premium access to setups
$BTC long / buy trade setup
entry 78700-78000
sl 76700
tp 79200-79400
Long $BTC 👇
entry 78700-78000
sl 76700
tp 79200-79400
Long $BTC 👇
249
·
--
Bullish
$BTC trade setup long/buy
entry 78500-78900
sl 76700
tp 79200-79400
Long $BTC 👇
{future}(BTCUSDT)
join the chat room .
if any questions you can dm Me on binance chat option
$BTC trade setup long/buy
entry 78500-78900
sl 76700
tp 79200-79400
Long $BTC 👇
join the chat room .
if any questions you can dm Me on binance chat option
entry 78500-78900
sl 76700
tp 79200-79400
Long $BTC 👇
join the chat room .
if any questions you can dm Me on binance chat option
100
·
--
btw usdt trade single$BTW /USDT - SHORT
Trade Plan:
Entry: 0.3993515 – 0.4022885
SL: 0.4455657
TP1: 0.3672607
TP2: 0.3448879
TP3: 0.3113286
Click 👇 to trade
{future}(BTWUSDT)
Why this setup?
- The 4h trend is your edge, but the 1D range is the cage. We are shorting $BTW at 0.40082, targeting 0.36726 first.
- RSI on the 15m sits at 39.9, showing sellers still control the micro-momentum, but this is a trend-following short, not a fade.
btw usdt trade single
$BTW /USDT - SHORT
Trade Plan:
Entry: 0.3993515 – 0.4022885
SL: 0.4455657
TP1: 0.3672607
TP2: 0.3448879
TP3: 0.3113286
Click 👇 to trade
Why this setup?
- The 4h trend is your edge, but the 1D range is the cage. We are shorting $BTW at 0.40082, targeting 0.36726 first.
- RSI on the 15m sits at 39.9, showing sellers still control the micro-momentum, but this is a trend-following short, not a fade.
Trade Plan:
Entry: 0.3993515 – 0.4022885
SL: 0.4455657
TP1: 0.3672607
TP2: 0.3448879
TP3: 0.3113286
Click 👇 to trade
Why this setup?
- The 4h trend is your edge, but the 1D range is the cage. We are shorting $BTW at 0.40082, targeting 0.36726 first.
- RSI on the 15m sits at 39.9, showing sellers still control the micro-momentum, but this is a trend-following short, not a fade.
1
1.1k
·
--
Bearish
$BTW /USDT - SHORT
Trade Plan:
Entry: 0.39935 – 0.40228
SL: 0.4455657
TP1: 0.3672607
TP2: 0.3448879
TP3: 0.3113286
Why this setup?
click 👇 to trade
{future}(BTWUSDT)
- The 4h trend is your edge, but the 1D range is the cage. We are shorting $BTW at 0.40082, targeting 0.36726 first.
- RSI on the 15m sits at 39.9, showing sellers still control the micro-momentum, but this is a trend-following short, not a fade.
$BTW /USDT - SHORT
Trade Plan:
Entry: 0.39935 – 0.40228
SL: 0.4455657
TP1: 0.3672607
TP2: 0.3448879
TP3: 0.3113286
Why this setup?
click 👇 to trade
- The 4h trend is your edge, but the 1D range is the cage. We are shorting $BTW at 0.40082, targeting 0.36726 first.
- RSI on the 15m sits at 39.9, showing sellers still control the micro-momentum, but this is a trend-following short, not a fade.
Trade Plan:
Entry: 0.39935 – 0.40228
SL: 0.4455657
TP1: 0.3672607
TP2: 0.3448879
TP3: 0.3113286
Why this setup?
click 👇 to trade
- The 4h trend is your edge, but the 1D range is the cage. We are shorting $BTW at 0.40082, targeting 0.36726 first.
- RSI on the 15m sits at 39.9, showing sellers still control the micro-momentum, but this is a trend-following short, not a fade.
120
·
--
portal usdt trade single 👇$PORTAL - 🟢 LONG · Conf 76%
Trade Plan:
Entry: 0.0151992 – 0.0152408
SL: 0.0145872
TP1: 0.0156946
TP2: 0.0160110
TP3: 0.0164856
Click 👇 to trade
{future}(PORTALUSDT)
Why this setup?
- The 4h timeframe is showing a fresh LONG bias with 76% confidence, which is a big deal when the daily chart is stuck in a flat range.
- Price reference sits at 0.0152200, with RSI on the 15m at a neutral 48.88. This means there is room to run before hitting overbought, giving the move fuel.
portal usdt trade single 👇
$PORTAL - 🟢 LONG · Conf 76%
Trade Plan:
Entry: 0.0151992 – 0.0152408
SL: 0.0145872
TP1: 0.0156946
TP2: 0.0160110
TP3: 0.0164856
Click 👇 to trade
Why this setup?
- The 4h timeframe is showing a fresh LONG bias with 76% confidence, which is a big deal when the daily chart is stuck in a flat range.
- Price reference sits at 0.0152200, with RSI on the 15m at a neutral 48.88. This means there is room to run before hitting overbought, giving the move fuel.
Trade Plan:
Entry: 0.0151992 – 0.0152408
SL: 0.0145872
TP1: 0.0156946
TP2: 0.0160110
TP3: 0.0164856
Click 👇 to trade
Why this setup?
- The 4h timeframe is showing a fresh LONG bias with 76% confidence, which is a big deal when the daily chart is stuck in a flat range.
- Price reference sits at 0.0152200, with RSI on the 15m at a neutral 48.88. This means there is room to run before hitting overbought, giving the move fuel.
301
·
--
Bullish
$PORTAL - 🟢 LONG · Conf 76%
Trade Plan:
Entry: 0.0151992 – 0.0152408
SL: 0.0145872
TP1: 0.0156946
TP2: 0.0160110
TP3: 0.0164856
click 👇 to trade
{future}(PORTALUSDT)
Why this setup?
- The 4h timeframe is showing a fresh LONG bias with 76% confidence, which is a big deal when the daily chart is stuck in a flat range.
- Price reference sits at 0.0152200, with RSI on the 15m at a neutral 48.88. This means there is room to run before hitting overbought, giving the move fuel.
$PORTAL - 🟢 LONG · Conf 76%
Trade Plan:
Entry: 0.0151992 – 0.0152408
SL: 0.0145872
TP1: 0.0156946
TP2: 0.0160110
TP3: 0.0164856
click 👇 to trade
Why this setup?
- The 4h timeframe is showing a fresh LONG bias with 76% confidence, which is a big deal when the daily chart is stuck in a flat range.
- Price reference sits at 0.0152200, with RSI on the 15m at a neutral 48.88. This means there is room to run before hitting overbought, giving the move fuel.
Trade Plan:
Entry: 0.0151992 – 0.0152408
SL: 0.0145872
TP1: 0.0156946
TP2: 0.0160110
TP3: 0.0164856
click 👇 to trade
Why this setup?
- The 4h timeframe is showing a fresh LONG bias with 76% confidence, which is a big deal when the daily chart is stuck in a flat range.
- Price reference sits at 0.0152200, with RSI on the 15m at a neutral 48.88. This means there is room to run before hitting overbought, giving the move fuel.
74
·
--
Ong usdt trade single 👇Ong long/buy now
Long Ong 👇
{future}(ONGUSDT)
We caught it from the top last time, this time lets catch it from the bottom, it can tap the 0.13-0.14 zone like a piece of cake and can go vertical from here.
Entry $0.124 - $0.127
SL $0.1217
Tps $0.131 - $0.135 - $0.141
Join the group for more updates and signal
Ong usdt trade single 👇
Ong long/buy now
Long Ong 👇
We caught it from the top last time, this time lets catch it from the bottom, it can tap the 0.13-0.14 zone like a piece of cake and can go vertical from here.
Entry $0.124 - $0.127
SL $0.1217
Tps $0.131 - $0.135 - $0.141
Join the group for more updates and signal
Long Ong 👇
We caught it from the top last time, this time lets catch it from the bottom, it can tap the 0.13-0.14 zone like a piece of cake and can go vertical from here.
Entry $0.124 - $0.127
SL $0.1217
Tps $0.131 - $0.135 - $0.141
Join the group for more updates and signal
367
·
--
$ONG long /buy
long $ONG 👇
{future}(ONGUSDT)
We caught it from the top last time, this time lets catch it from the bottom, it can tap the 0.13-0.14 zone like a piece of cake and can go vertical from here.
Entry $0.124 - $0.127
SL $0.1217
Tps $0.131 - $0.135 - $0.141
$ONG long /buy
long $ONG 👇
We caught it from the top last time, this time lets catch it from the bottom, it can tap the 0.13-0.14 zone like a piece of cake and can go vertical from here.
Entry $0.124 - $0.127
SL $0.1217
Tps $0.131 - $0.135 - $0.141
long $ONG 👇
We caught it from the top last time, this time lets catch it from the bottom, it can tap the 0.13-0.14 zone like a piece of cake and can go vertical from here.
Entry $0.124 - $0.127
SL $0.1217
Tps $0.131 - $0.135 - $0.141
99
·
--
Bullish
$BNB LONG
Entry 688
join the group for more updates
and good trade singls
TP1 697
TP2 707
TP3 720
SL 678
click 👇 to trade
{future}(BNBUSDT)
$BNB LONG
Entry 688
join the group for more updates
and good trade singls
TP1 697
TP2 707
TP3 720
SL 678
click 👇 to trade
Entry 688
join the group for more updates
and good trade singls
TP1 697
TP2 707
TP3 720
SL 678
click 👇 to trade
62
·
--
zec trade signal 👇$ZEC /USDT - 🟢 LONG · Conf 91%
Trade Plan:
Entry: 808.07 – 810.43
SL: 782.10
TP1: 829.61
TP2: 843.18
TP3: 863.54
{future}(ZECUSDT)
Why this setup?
- $ZEC is pressing 809.25 with a 91% confidence long bias, and the 1D trend is bullish — this is not a random bounce.
- RSI on the 15m sits at 67.6, showing momentum is building but not yet exhausted, leaving room to run toward TP1 at 829.61.
- The real edge is the sequence: TP2 at 843.18 and TP3 at 863.54 are within a 6-7% move, which is aggressive but consistent with the current trend regime.
zec trade signal 👇
$ZEC /USDT - 🟢 LONG · Conf 91%
Trade Plan:
Entry: 808.07 – 810.43
SL: 782.10
TP1: 829.61
TP2: 843.18
TP3: 863.54
Why this setup?
- $ZEC is pressing 809.25 with a 91% confidence long bias, and the 1D trend is bullish — this is not a random bounce.
- RSI on the 15m sits at 67.6, showing momentum is building but not yet exhausted, leaving room to run toward TP1 at 829.61.
- The real edge is the sequence: TP2 at 843.18 and TP3 at 863.54 are within a 6-7% move, which is aggressive but consistent with the current trend regime.
Trade Plan:
Entry: 808.07 – 810.43
SL: 782.10
TP1: 829.61
TP2: 843.18
TP3: 863.54
Why this setup?
- $ZEC is pressing 809.25 with a 91% confidence long bias, and the 1D trend is bullish — this is not a random bounce.
- RSI on the 15m sits at 67.6, showing momentum is building but not yet exhausted, leaving room to run toward TP1 at 829.61.
- The real edge is the sequence: TP2 at 843.18 and TP3 at 863.54 are within a 6-7% move, which is aggressive but consistent with the current trend regime.
1
1.2k
·
--
eth long trade signalEntry Zone: $2,440 - $2,480
TP 1: $2,520
TP 2: $2,580
TP 3: $2,650
TP 4: $2,750
SL: $2,390
Click Below To Take Trade Now ...👇
{future}(ETHUSDT)
eth long trade signal
Entry Zone: $2,440 - $2,480
TP 1: $2,520
TP 2: $2,580
TP 3: $2,650
TP 4: $2,750
SL: $2,390
Click Below To Take Trade Now ...👇
TP 1: $2,520
TP 2: $2,580
TP 3: $2,650
TP 4: $2,750
SL: $2,390
Click Below To Take Trade Now ...👇
1
300
·
--
br/usdt trade single 👇$BR - 🟢 LONG · Conf 81%
Trade Plan:
Entry: 0.2717068 – 0.2738532
SL: 0.2487983
TP1: 0.2907663
TP2: 0.3027571
TP3: 0.3207434
Click 👇 to trade
{future}(BRUSDT)
Join the group chat and get live trades and updates
Why this setup?
- The daily trend is bullish, and right now we have a LONG signal on the 4h with a confidence score of 80.86.
- Price is sitting at 0.27278, with the RSI on the 15m at 51.47 — neutral, not overbought, meaning there is still room to run before hitting resistance.
- Why now? The ATR on the 1h is 0.009994, which means volatility is picking up, and we are in a trend-following regime, not a counter-trend trap.
- The path of least resistance is up: TP1 at 0.2907, TP2 at 0.3027, and TP3 at 0.3207, while the stop sits safely at 0.2487.
br/usdt trade single 👇
$BR - 🟢 LONG · Conf 81%
Trade Plan:
Entry: 0.2717068 – 0.2738532
SL: 0.2487983
TP1: 0.2907663
TP2: 0.3027571
TP3: 0.3207434
Click 👇 to trade
Join the group chat and get live trades and updates
Why this setup?
- The daily trend is bullish, and right now we have a LONG signal on the 4h with a confidence score of 80.86.
- Price is sitting at 0.27278, with the RSI on the 15m at 51.47 — neutral, not overbought, meaning there is still room to run before hitting resistance.
- Why now? The ATR on the 1h is 0.009994, which means volatility is picking up, and we are in a trend-following regime, not a counter-trend trap.
- The path of least resistance is up: TP1 at 0.2907, TP2 at 0.3027, and TP3 at 0.3207, while the stop sits safely at 0.2487.
Trade Plan:
Entry: 0.2717068 – 0.2738532
SL: 0.2487983
TP1: 0.2907663
TP2: 0.3027571
TP3: 0.3207434
Click 👇 to trade
Join the group chat and get live trades and updates
Why this setup?
- The daily trend is bullish, and right now we have a LONG signal on the 4h with a confidence score of 80.86.
- Price is sitting at 0.27278, with the RSI on the 15m at 51.47 — neutral, not overbought, meaning there is still room to run before hitting resistance.
- Why now? The ATR on the 1h is 0.009994, which means volatility is picking up, and we are in a trend-following regime, not a counter-trend trap.
- The path of least resistance is up: TP1 at 0.2907, TP2 at 0.3027, and TP3 at 0.3207, while the stop sits safely at 0.2487.
252
Log in to explore more content
Join global crypto users on Binance Square
⚡️ Get latest and useful information about crypto.
💬 Trusted by the world’s largest crypto exchange.
👍 Discover real insights from verified creators.
Email / Phone number
Trending Topics
BrentRisesAbove$90
2,777 views
48 Discussing
Brent crude just spiked above $90/barrel after US strikes on Iran.
Official line: preventing sea mine deployment in the Strait of Hormuz.
That's the chokepoint for roughly 20% of global oil supply. When tensions flare there, oil markets react immediately.
Energy stocks getting a bid. Airlines, industrials, anything sensitive to fuel costs will feel this. If crude holds above $90, inflation expectations start creeping back into the conversation.
Watch how this plays out over the next few sessions. Geopolitical risk premiums don't always stick, but when they involve the Strait of Hormuz, markets take it seriously.
EquityPlainTalk
·1 Likes
·334 views
KospiDrops3.6%AsSamsungSKHynixWeaken
0 views
12 Discussing
GoldHits$4444.82InEarlyTrading
104 views
6 Discussing