
Halit Buğra
115 Posts

Halit Buğra
A legend trader
5 Following
12.6K+ Followers
2.5K+ Liked
Posts
I’m sharing a RED PACKET with my community!
Want to grab your reward?
How to get?
Follow me
Comment “YES”
Repost this post
Complete all the tasks and you’ll be eligible for the reward.
Everyone who completes the tasks gets rewarded.
Don’t miss your chance.
Let’s go!
Want to grab your reward?
How to get?
Follow me
Comment “YES”
Repost this post
Complete all the tasks and you’ll be eligible for the reward.
Everyone who completes the tasks gets rewarded.
Don’t miss your chance.
Let’s go!
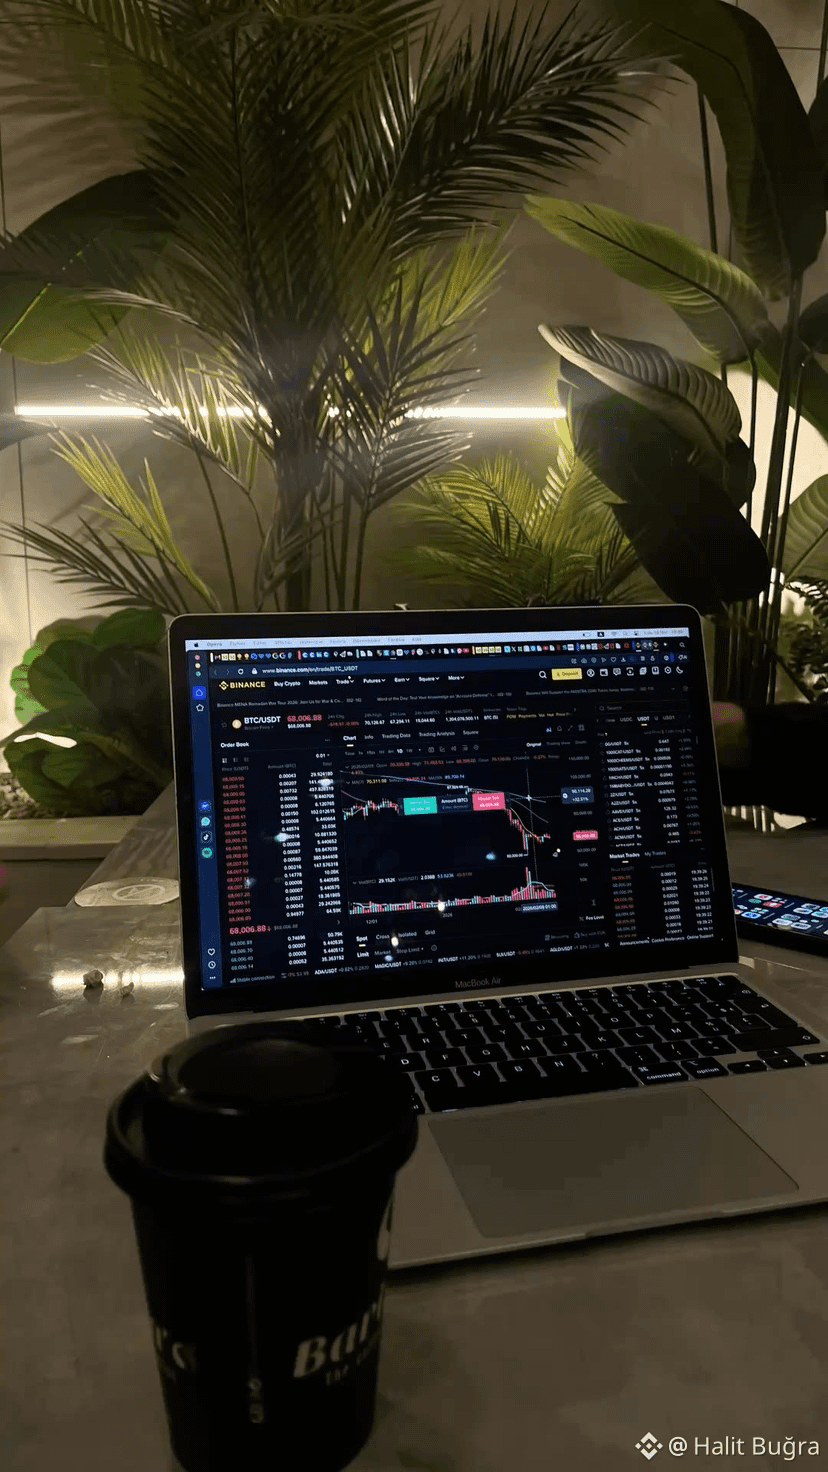
𝗕𝗜𝗧𝗖𝗢𝗜𝗡 𝗜𝗦 𝗖𝗢𝗡𝗦𝗢𝗟𝗜𝗗𝗔𝗧𝗜𝗡𝗚 𝗔𝗙𝗧𝗘𝗥 𝗔 𝗠𝗔𝗦𝗦𝗜𝗩𝗘 $𝟭𝟱,𝟬𝟬𝟬 𝗥𝗘𝗖𝗢𝗩𝗘𝗥𝗬.
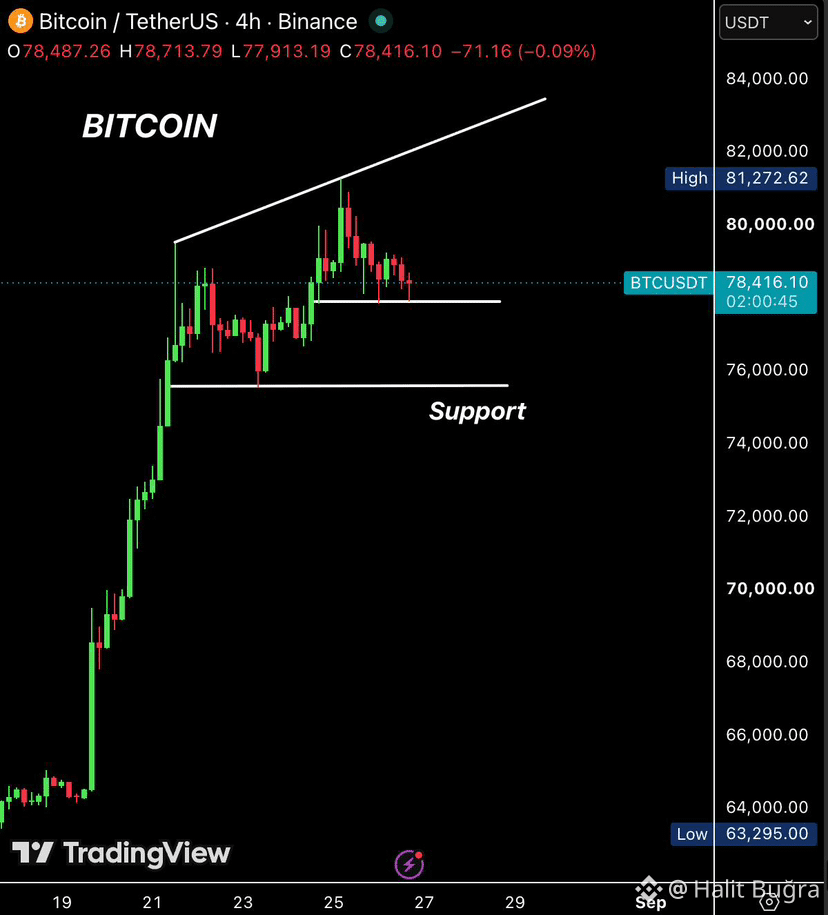
$BTC bounced aggressively from $63,300 and is now trading around $78,200.
Despite the current sideways movement, the broader structure remains constructive.
Bitcoin is still printing higher highs and higher lows, which means buyers continue to defend the trend.
The key level right now is $78,000.
Local support sits around $77,800, while the stronger demand zone remains between $75,500 and $76,000.
On the upside, $81,270 is the major level to watch.
This resistance becomes even more important because it aligns with the weekly MA 50. A clean breakout above this area could significantly strengthen bullish momentum.
From here, I’m watching two possible scenarios.
If Bitcoin holds $78,000, breaks the local trendline and buyers regain momentum, the next major target could be around $83,000.
But if $78,000 fails to hold, I’d expect liquidity below the current range to get tested.
That could send BTC back toward the $75,500–$76,000 support zone before Friday.
For now, there’s no reason to overcomplicate it.
$78,000 is the decision level.
Hold it → bulls can attack $81,270 and potentially $83,000.
Lose it → $76,000 becomes the next major test.
The next breakout from this consolidation could decide Bitcoin’s short-term direction.
$BTC bounced aggressively from $63,300 and is now trading around $78,200.
Despite the current sideways movement, the broader structure remains constructive.
Bitcoin is still printing higher highs and higher lows, which means buyers continue to defend the trend.
The key level right now is $78,000.
Local support sits around $77,800, while the stronger demand zone remains between $75,500 and $76,000.
On the upside, $81,270 is the major level to watch.
This resistance becomes even more important because it aligns with the weekly MA 50. A clean breakout above this area could significantly strengthen bullish momentum.
From here, I’m watching two possible scenarios.
If Bitcoin holds $78,000, breaks the local trendline and buyers regain momentum, the next major target could be around $83,000.
But if $78,000 fails to hold, I’d expect liquidity below the current range to get tested.
That could send BTC back toward the $75,500–$76,000 support zone before Friday.
For now, there’s no reason to overcomplicate it.
$78,000 is the decision level.
Hold it → bulls can attack $81,270 and potentially $83,000.
Lose it → $76,000 becomes the next major test.
The next breakout from this consolidation could decide Bitcoin’s short-term direction.
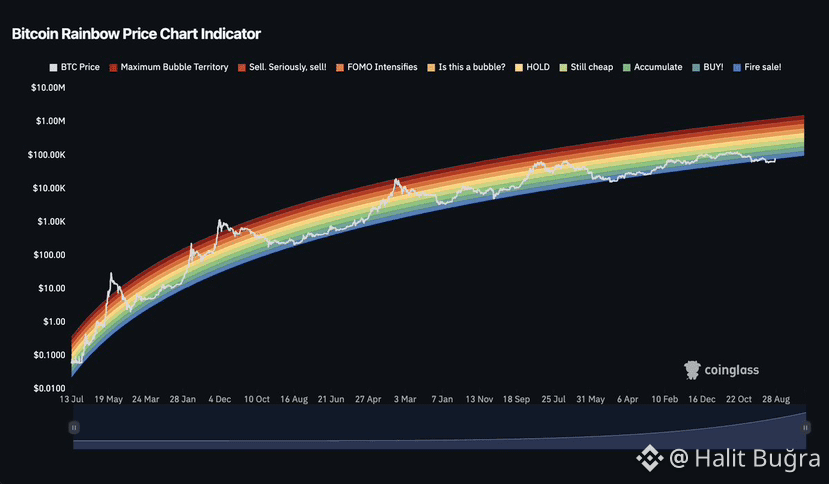
$BTC JUST RECLAIMED THE RAINBOW CHART — AND THE BIGGER PICTURE IS STARTING TO LOOK VERY INTERESTING.
Bitcoin has pushed back into the Rainbow Chart’s long-term valuation bands, putting BTC back inside a historical framework that tracks its price through different market-cycle zones.
The important part isn’t simply that Bitcoin crossed a colorful line.
The Rainbow Chart is built around a logarithmic growth model, so traders often use it as a broad cycle reference rather than a short-term trading indicator. Moving higher through these bands can signal that Bitcoin is progressing into a stronger phase of its long-term cycle.
What makes this especially interesting is what could happen if momentum continues.
If BTC holds its position and starts climbing through the higher valuation bands, market attention could shift rapidly from consolidation toward price discovery and cycle expansion.
But there’s an important catch.
The Rainbow Chart is not a prediction machine. Bitcoin has deviated from historical models before, and macro conditions, liquidity, institutional flows, regulation, and overall risk appetite can completely change how a cycle develops.
So reclaiming the chart alone doesn’t guarantee a massive rally.
Still, seeing Bitcoin regain this long-term structure is something worth watching closely.
If BTC keeps moving through the Rainbow bands instead of falling back below them, the next stage of this cycle could become much more interesting.
The real question now:
Is Bitcoin simply returning to its historical trend…
or preparing for the next major expansion?
Bitcoin has pushed back into the Rainbow Chart’s long-term valuation bands, putting BTC back inside a historical framework that tracks its price through different market-cycle zones.
The important part isn’t simply that Bitcoin crossed a colorful line.
The Rainbow Chart is built around a logarithmic growth model, so traders often use it as a broad cycle reference rather than a short-term trading indicator. Moving higher through these bands can signal that Bitcoin is progressing into a stronger phase of its long-term cycle.
What makes this especially interesting is what could happen if momentum continues.
If BTC holds its position and starts climbing through the higher valuation bands, market attention could shift rapidly from consolidation toward price discovery and cycle expansion.
But there’s an important catch.
The Rainbow Chart is not a prediction machine. Bitcoin has deviated from historical models before, and macro conditions, liquidity, institutional flows, regulation, and overall risk appetite can completely change how a cycle develops.
So reclaiming the chart alone doesn’t guarantee a massive rally.
Still, seeing Bitcoin regain this long-term structure is something worth watching closely.
If BTC keeps moving through the Rainbow bands instead of falling back below them, the next stage of this cycle could become much more interesting.
The real question now:
Is Bitcoin simply returning to its historical trend…
or preparing for the next major expansion?
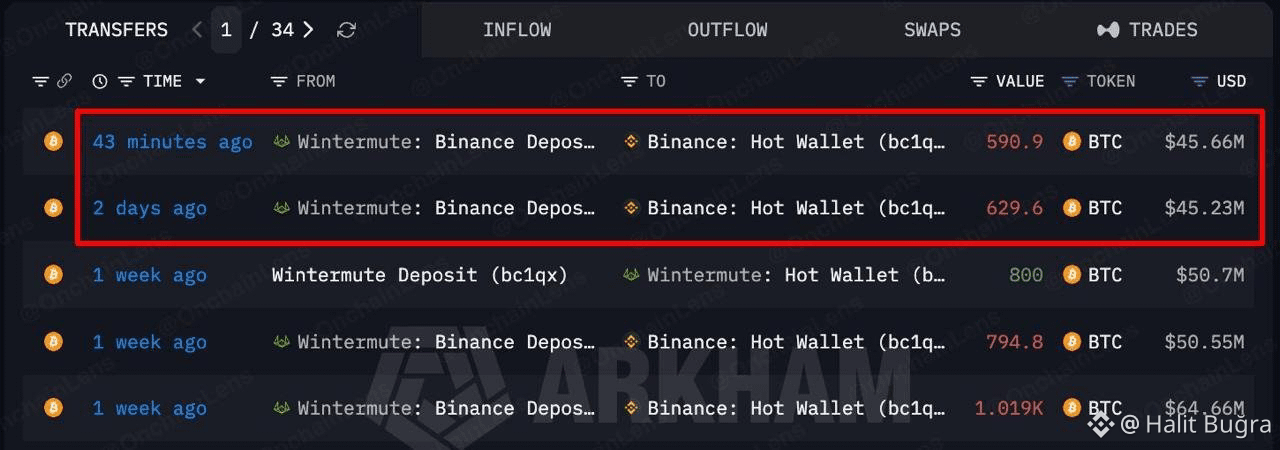
WINTERMUTE JUST MOVED ANOTHER 590.9 $BTC WORTH AROUND $45.66 MILLION.
The transfers are getting bigger.
This week alone, Wintermute has moved approximately 3,834.3 $BTC , valued at around $256.8 million.
Large movements from a major market maker always deserve attention, especially when hundreds of millions in Bitcoin start shifting within a short period.
The key now is where this liquidity ends up. If a significant portion moves toward exchanges, traders could start watching for potential sell-side pressure.
If the BTC is being repositioned between wallets or used for liquidity operations, the market impact could be very different.
Either way, $256.8M worth of Bitcoin moving in a single week is not something to ignore.
Keep watching the flows. The next destination matters.
The transfers are getting bigger.
This week alone, Wintermute has moved approximately 3,834.3 $BTC , valued at around $256.8 million.
Large movements from a major market maker always deserve attention, especially when hundreds of millions in Bitcoin start shifting within a short period.
The key now is where this liquidity ends up. If a significant portion moves toward exchanges, traders could start watching for potential sell-side pressure.
If the BTC is being repositioned between wallets or used for liquidity operations, the market impact could be very different.
Either way, $256.8M worth of Bitcoin moving in a single week is not something to ignore.
Keep watching the flows. The next destination matters.
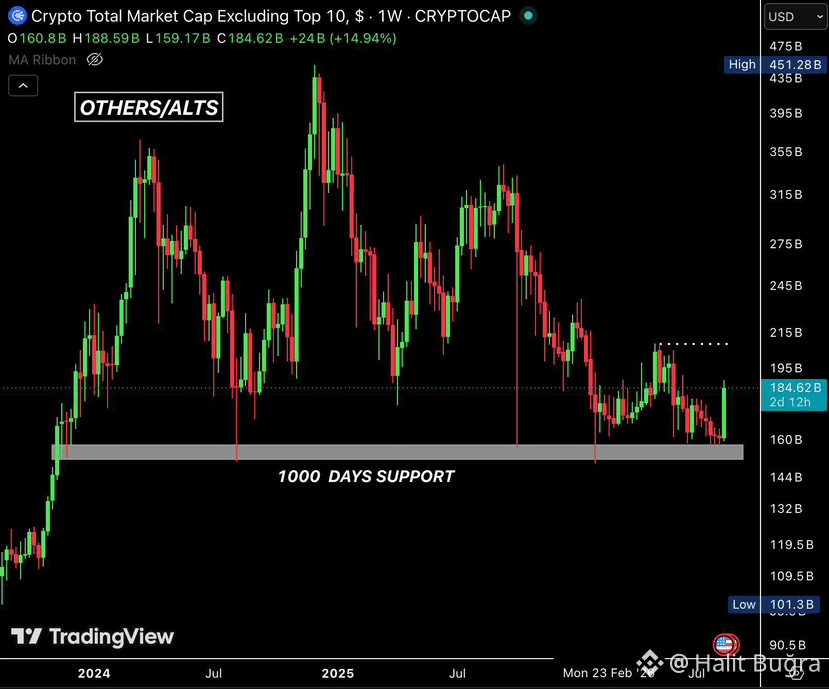
ALTCOINS ARE FINALLY WAKING UP
The altcoin market is starting to show signs of life again.
Total alt market cap has bounced from a long-term support range that has held for roughly 1,000 days, gaining around 15% this week as Bitcoin pushed through major resistance and reached $79K.
That bounce matters, but there’s an important detail: altcoins are still heavily dependent on Bitcoin.
Right now, $BTC is setting the direction. When Bitcoin expands higher, liquidity and confidence spill into ETH and larger-cap alts first, with the rest of the market following.
Bitcoin dominance is the key metric I’m watching.
BTC.D remains above 60%, showing that Bitcoin is still absorbing a large share of market liquidity. That usually isn’t the ideal environment for a broad low-cap altcoin run.
Historically, a move in BTC dominance below the 58% area would provide a much stronger signal that capital is rotating away from Bitcoin and deeper into the altcoin market.
So yes, the structure is improving.
Alts are bouncing, market sentiment is getting stronger, and Bitcoin breaking resistance gives the entire market more room to move.
But a bounce is not automatically an altseason.
For now, I’m watching whether BTC can hold its breakout while dominance begins trending lower. If those two conditions start happening together, the next phase for altcoins could become much more interesting.
Until then, confirmation matters more than excitement.
The altcoin market is starting to show signs of life again.
Total alt market cap has bounced from a long-term support range that has held for roughly 1,000 days, gaining around 15% this week as Bitcoin pushed through major resistance and reached $79K.
That bounce matters, but there’s an important detail: altcoins are still heavily dependent on Bitcoin.
Right now, $BTC is setting the direction. When Bitcoin expands higher, liquidity and confidence spill into ETH and larger-cap alts first, with the rest of the market following.
Bitcoin dominance is the key metric I’m watching.
BTC.D remains above 60%, showing that Bitcoin is still absorbing a large share of market liquidity. That usually isn’t the ideal environment for a broad low-cap altcoin run.
Historically, a move in BTC dominance below the 58% area would provide a much stronger signal that capital is rotating away from Bitcoin and deeper into the altcoin market.
So yes, the structure is improving.
Alts are bouncing, market sentiment is getting stronger, and Bitcoin breaking resistance gives the entire market more room to move.
But a bounce is not automatically an altseason.
For now, I’m watching whether BTC can hold its breakout while dominance begins trending lower. If those two conditions start happening together, the next phase for altcoins could become much more interesting.
Until then, confirmation matters more than excitement.
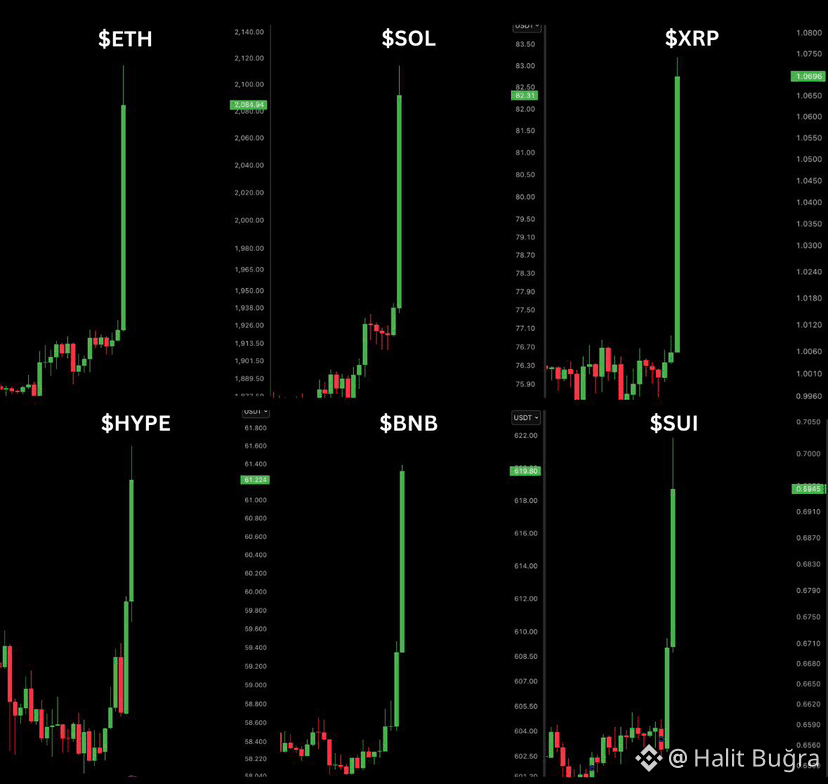
WE ARE BACK — THE CRYPTO MARKET JUST WOKE UP.
Green candles are hitting across the board, and this isn’t limited to one corner of the market.
$ETH pushed above $2,080.
$SOL exploded toward $82.
$XRP jumped above $1.06.
$HYPE surged past $61.
$BNB ripped toward $620.
$SUI climbed close to $0.70.
The important part is the synchronization. Multiple major assets are moving sharply at the same time, showing a sudden return of aggressive buying pressure.
After a long period of weakness and hesitation, this kind of broad market reaction is exactly what traders have been waiting to see.
One candle doesn’t confirm a full trend reversal, but momentum has clearly returned.
Now the real test begins: can buyers hold these levels and turn this explosive move into something bigger?
WE ARE SO BACK.
Green candles are hitting across the board, and this isn’t limited to one corner of the market.
$ETH pushed above $2,080.
$SOL exploded toward $82.
$XRP jumped above $1.06.
$HYPE surged past $61.
$BNB ripped toward $620.
$SUI climbed close to $0.70.
The important part is the synchronization. Multiple major assets are moving sharply at the same time, showing a sudden return of aggressive buying pressure.
After a long period of weakness and hesitation, this kind of broad market reaction is exactly what traders have been waiting to see.
One candle doesn’t confirm a full trend reversal, but momentum has clearly returned.
Now the real test begins: can buyers hold these levels and turn this explosive move into something bigger?
WE ARE SO BACK.
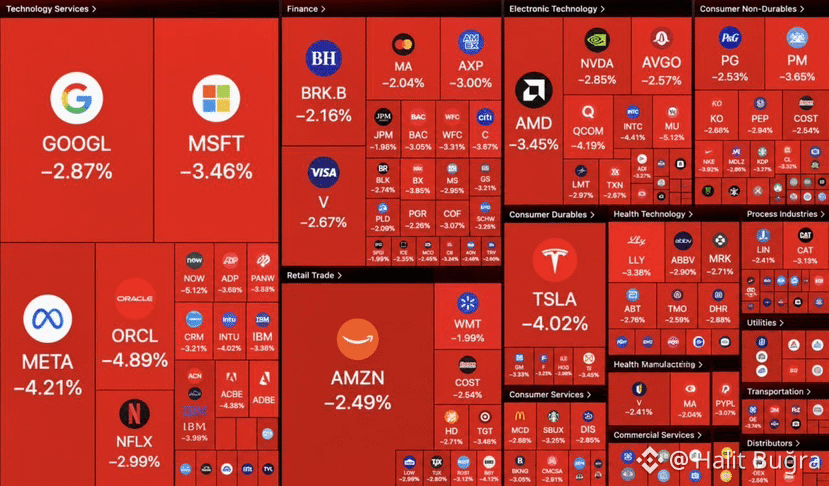
$200 BILLION VANISHED FROM U.S. STOCKS IN JUST 30 MINUTES.
Wall Street was hit by a brutal wave of selling as stocks flashed red across the board.
The trigger?
U.S. 30-year Treasury yields surged to their highest level in 19 years, putting fresh pressure on risk assets.
Higher long-term yields can tighten financial conditions and make equities less attractive, especially expensive growth and technology stocks.
When bond yields move this aggressively, markets pay attention fast.
The question now: is this just a sharp shakeout—or the beginning of something much bigger?
Wall Street was hit by a brutal wave of selling as stocks flashed red across the board.
The trigger?
U.S. 30-year Treasury yields surged to their highest level in 19 years, putting fresh pressure on risk assets.
Higher long-term yields can tighten financial conditions and make equities less attractive, especially expensive growth and technology stocks.
When bond yields move this aggressively, markets pay attention fast.
The question now: is this just a sharp shakeout—or the beginning of something much bigger?
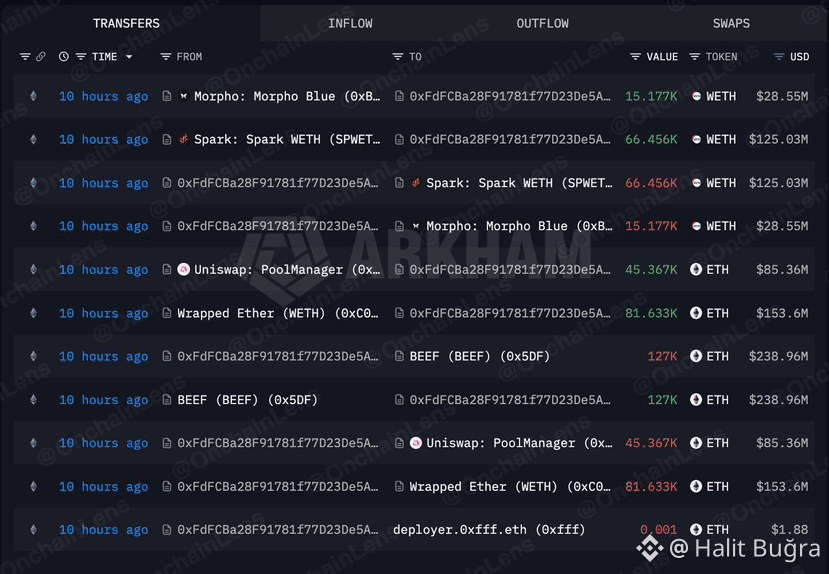
𝗔 𝗗𝗢𝗥𝗠𝗔𝗡𝗧 𝗪𝗛𝗔𝗟𝗘 𝗝𝗨𝗦𝗧 𝗪𝗢𝗞𝗘 𝗨𝗣 𝗔𝗙𝗧𝗘𝗥 𝟮 𝗬𝗘𝗔𝗥𝗦 — 𝗔𝗡𝗗 𝗠𝗢𝗩𝗘𝗗 𝗛𝗨𝗡𝗗𝗥𝗘𝗗𝗦 𝗢𝗙 𝗠𝗜𝗟𝗟𝗜𝗢𝗡𝗦.
The wallet suddenly became active and executed a massive arbitrage operation involving roughly $153.6M worth of WETH.
On-chain transfers show huge amounts moving between Wrapped Ether, Uniswap, BEEF, Spark and Morpho.
The scale was insane.
Around 127K ETH worth roughly $239M moved through BEEF, while another 81.6K ETH worth about $153.6M appeared in the transaction flow.
But here’s the crazy part:
After borrowing and moving more than $150 MILLION for the arbitrage trade, the reported profit was only around $0.36.
Yes — 36 CENTS.
Two years of silence.
Hundreds of millions moved.
Massive DeFi machinery activated.
Profit: less than the price of a coffee.
Crypto on-chain activity never stops being wild.
The wallet suddenly became active and executed a massive arbitrage operation involving roughly $153.6M worth of WETH.
On-chain transfers show huge amounts moving between Wrapped Ether, Uniswap, BEEF, Spark and Morpho.
The scale was insane.
Around 127K ETH worth roughly $239M moved through BEEF, while another 81.6K ETH worth about $153.6M appeared in the transaction flow.
But here’s the crazy part:
After borrowing and moving more than $150 MILLION for the arbitrage trade, the reported profit was only around $0.36.
Yes — 36 CENTS.
Two years of silence.
Hundreds of millions moved.
Massive DeFi machinery activated.
Profit: less than the price of a coffee.
Crypto on-chain activity never stops being wild.
SOMETHING BIG IS BREAKING IN JAPAN
Japan’s bond market is flashing a warning that global markets should not ignore.
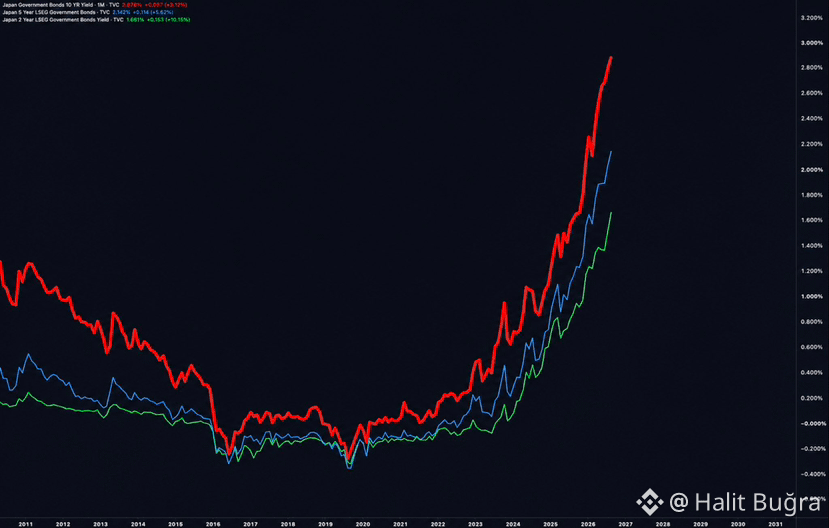
Japan’s 5-year government bond yield has surged to around 2.17%, reaching levels not seen in roughly 31 years.
The 2-year yield has climbed to around 1.66%, also near a 31-year high.
And this isn’t happening in isolation.
The chart shows yields across Japan’s 2Y, 5Y and 10Y government bonds rising sharply together.
Why does this matter?
For decades, Japan was known for extremely low interest rates. Cheap yen funding encouraged investors to borrow in Japan and move that money into higher-return assets around the world.
Now that environment is changing.
Higher Japanese yields can make domestic bonds more attractive, reduce the appeal of borrowing cheaply in yen, and potentially encourage Japanese capital to move back home.
That can put pressure on the yen carry trade and increase volatility across global stocks, bonds and other risk assets.
It also raises another major issue:
Japan carries one of the largest government debt loads in the developed world. If borrowing costs stay elevated, interest expenses become increasingly important for the government’s finances.
This does NOT automatically mean a global crash is coming.
But when one of the world’s biggest sources of cheap capital starts repricing this aggressively, markets pay attention.
Japan’s bond market is no longer quiet.
And if yields keep pushing higher, the effects may not stay inside Japan. 👀
Japan’s bond market is flashing a warning that global markets should not ignore.
Japan’s 5-year government bond yield has surged to around 2.17%, reaching levels not seen in roughly 31 years.
The 2-year yield has climbed to around 1.66%, also near a 31-year high.
And this isn’t happening in isolation.
The chart shows yields across Japan’s 2Y, 5Y and 10Y government bonds rising sharply together.
Why does this matter?
For decades, Japan was known for extremely low interest rates. Cheap yen funding encouraged investors to borrow in Japan and move that money into higher-return assets around the world.
Now that environment is changing.
Higher Japanese yields can make domestic bonds more attractive, reduce the appeal of borrowing cheaply in yen, and potentially encourage Japanese capital to move back home.
That can put pressure on the yen carry trade and increase volatility across global stocks, bonds and other risk assets.
It also raises another major issue:
Japan carries one of the largest government debt loads in the developed world. If borrowing costs stay elevated, interest expenses become increasingly important for the government’s finances.
This does NOT automatically mean a global crash is coming.
But when one of the world’s biggest sources of cheap capital starts repricing this aggressively, markets pay attention.
Japan’s bond market is no longer quiet.
And if yields keep pushing higher, the effects may not stay inside Japan. 👀
ETH/BTC IS DOING SOMETHING IT HASN’T DONE IN YEARS.
I’ve been watching this chart because the change is subtle, but potentially important.
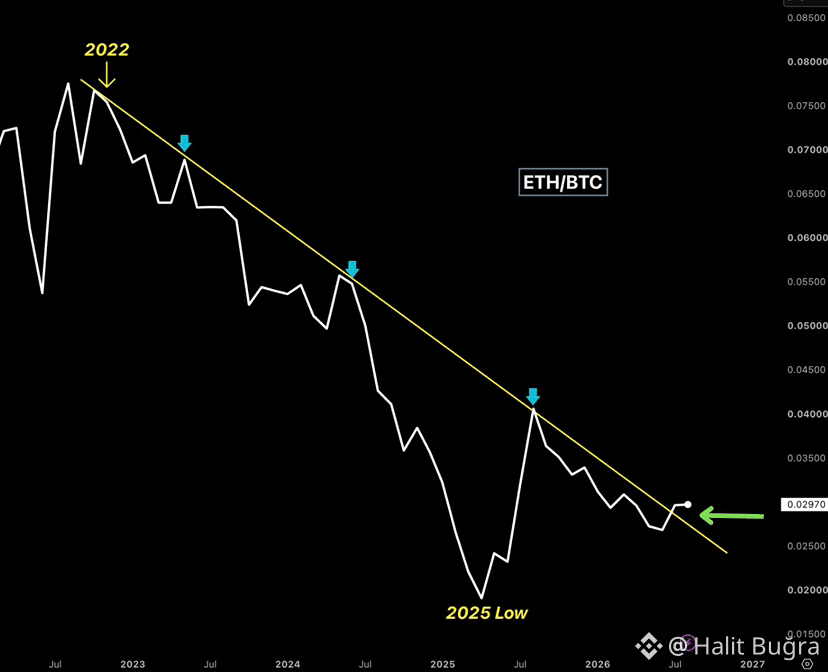
ETH has spent most of the last four years getting weaker against BTC. There were plenty of rallies along the way, but each time ETH/BTC reached that long-term descending trendline, sellers showed up and the broader downtrend continued.
Now we’re seeing a different reaction.
ETH/BTC is starting to move through that same trendline instead of getting rejected from it.
For me, the interesting part isn’t simply “ETH is bullish.” It’s what this could tell us about where strength is developing inside the crypto market.
Bitcoin has dominated this cycle for a long time. When ETH/BTC falls, that dominance makes sense — holding BTC has simply been stronger than holding ETH.
If ETH/BTC can actually turn this breakout into a higher-low structure, that relationship starts to change.
And that’s where altcoins become interesting.
A healthier ETH/BTC pair doesn’t automatically mean every altcoin starts pumping. But sustained ETH strength against BTC can be an early indication that traders are becoming more comfortable taking risk outside Bitcoin again.
I wouldn’t call an altseason from one trendline break, especially before strong monthly confirmation.
But after four years of lower highs, seeing this structure challenged is something I wouldn’t ignore.
Now I’m watching the retest.
If the old resistance becomes support, this chart could be telling us something much bigger than just an ETH move.
Maybe the real question isn’t whether the downtrend broke.
It’s whether the market is finally ready to keep it broken.
I’ve been watching this chart because the change is subtle, but potentially important.
ETH has spent most of the last four years getting weaker against BTC. There were plenty of rallies along the way, but each time ETH/BTC reached that long-term descending trendline, sellers showed up and the broader downtrend continued.
Now we’re seeing a different reaction.
ETH/BTC is starting to move through that same trendline instead of getting rejected from it.
For me, the interesting part isn’t simply “ETH is bullish.” It’s what this could tell us about where strength is developing inside the crypto market.
Bitcoin has dominated this cycle for a long time. When ETH/BTC falls, that dominance makes sense — holding BTC has simply been stronger than holding ETH.
If ETH/BTC can actually turn this breakout into a higher-low structure, that relationship starts to change.
And that’s where altcoins become interesting.
A healthier ETH/BTC pair doesn’t automatically mean every altcoin starts pumping. But sustained ETH strength against BTC can be an early indication that traders are becoming more comfortable taking risk outside Bitcoin again.
I wouldn’t call an altseason from one trendline break, especially before strong monthly confirmation.
But after four years of lower highs, seeing this structure challenged is something I wouldn’t ignore.
Now I’m watching the retest.
If the old resistance becomes support, this chart could be telling us something much bigger than just an ETH move.
Maybe the real question isn’t whether the downtrend broke.
It’s whether the market is finally ready to keep it broken.
BITCOIN COULD BE SETTING UP FOR ANOTHER CPI-DRIVEN MOVE.
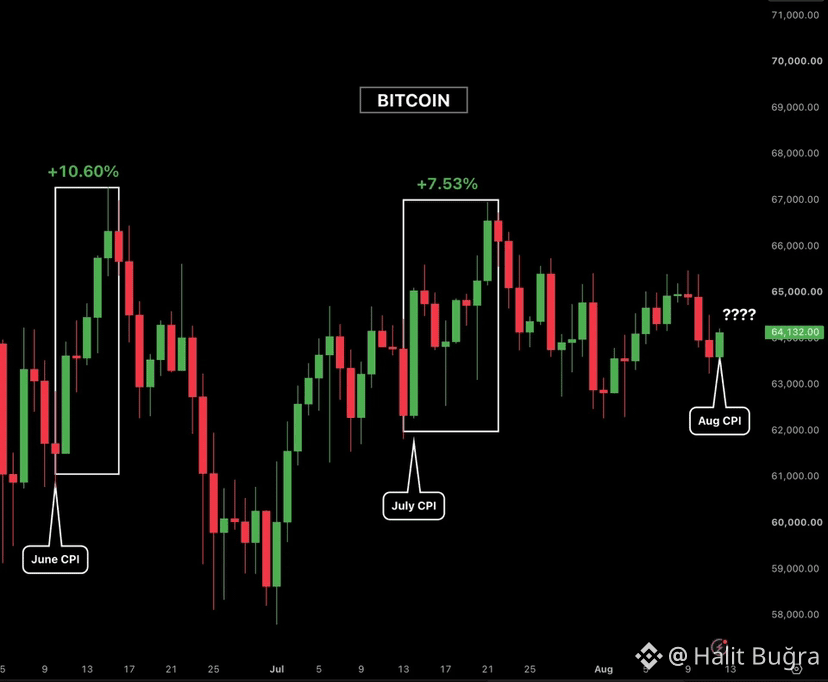
The chart shows a clear pattern around recent CPI releases.
June CPI was followed by a powerful +10.60% Bitcoin rally, pushing price from roughly the $61K region toward $67K.
July CPI produced another strong reaction. Bitcoin climbed around +7.53%, again showing how aggressively liquidity can enter the market when inflation data supports risk assets.
Now August CPI is here, and Bitcoin is sitting near $64K.
This is a critical zone.
If CPI strengthens expectations for easier monetary policy, fresh liquidity could rotate back into BTC and trigger another expansion toward the $65K-$67K area. A clean break above that region could open the door for higher levels.
But the reaction matters more than the headline.
If buyers fail to take control and Bitcoin loses the $63K-$62K structure, the market could sweep lower liquidity before attempting another move.
June: +10.60%
July: +7.53%
August: ????
Bitcoin is sitting at another major macro decision point.
Watch the reaction. Watch the liquidity. Watch the structure.
The chart shows a clear pattern around recent CPI releases.
June CPI was followed by a powerful +10.60% Bitcoin rally, pushing price from roughly the $61K region toward $67K.
July CPI produced another strong reaction. Bitcoin climbed around +7.53%, again showing how aggressively liquidity can enter the market when inflation data supports risk assets.
Now August CPI is here, and Bitcoin is sitting near $64K.
This is a critical zone.
If CPI strengthens expectations for easier monetary policy, fresh liquidity could rotate back into BTC and trigger another expansion toward the $65K-$67K area. A clean break above that region could open the door for higher levels.
But the reaction matters more than the headline.
If buyers fail to take control and Bitcoin loses the $63K-$62K structure, the market could sweep lower liquidity before attempting another move.
June: +10.60%
July: +7.53%
August: ????
Bitcoin is sitting at another major macro decision point.
Watch the reaction. Watch the liquidity. Watch the structure.
GLOBAL BOND MARKETS ARE IMPLODING
Something serious is happening across global debt markets.
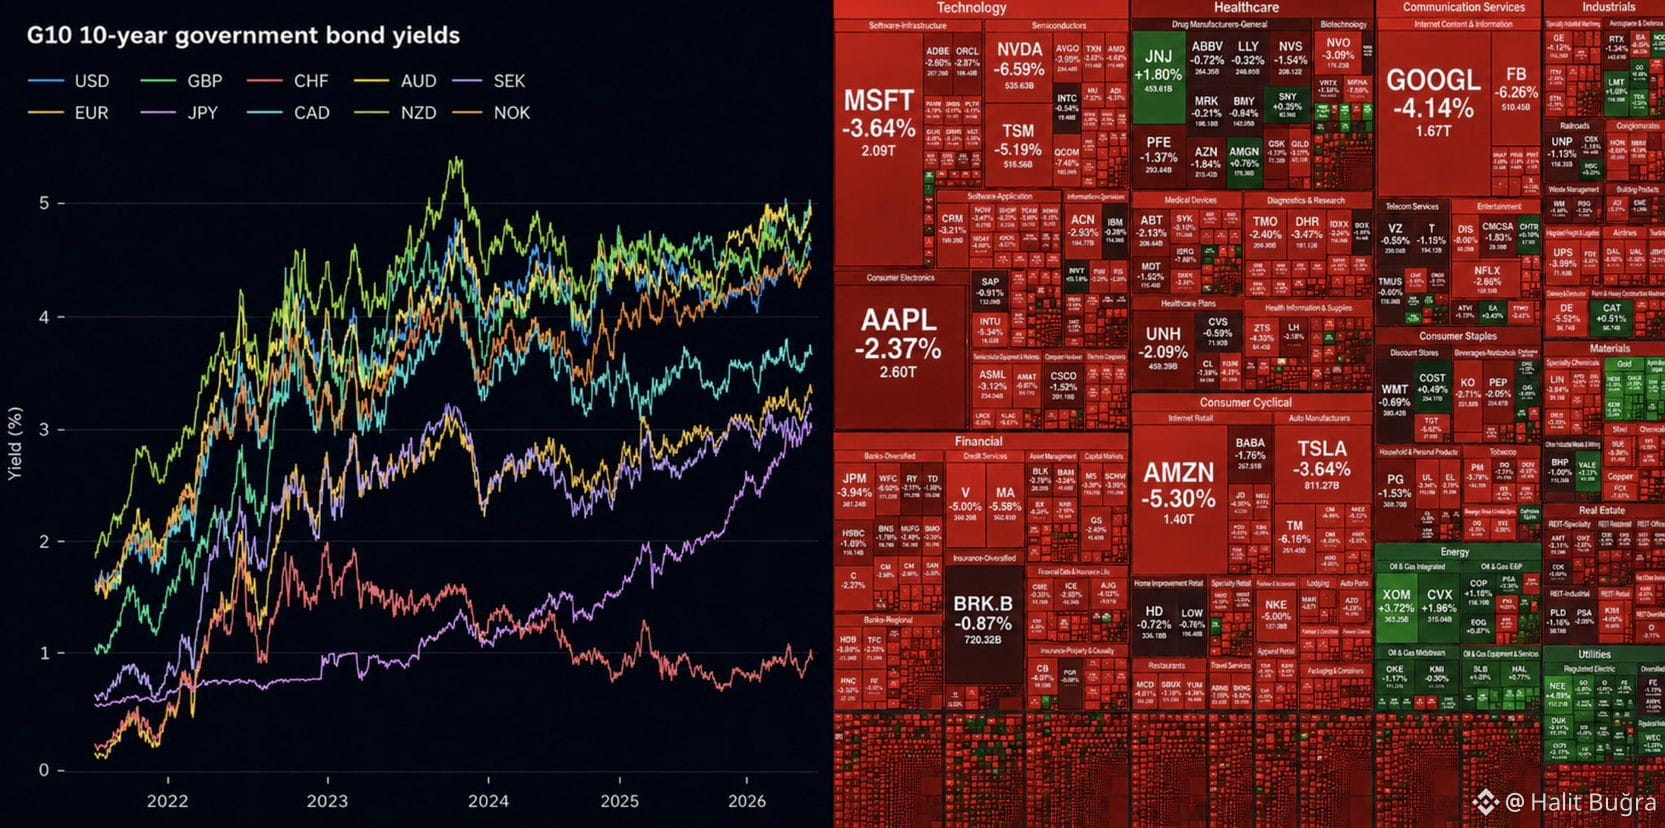
Bond yields in the US, Japan, France, and the UK are pushing toward levels not seen in decades.
Higher yields mean governments face increasingly expensive borrowing costs, while businesses and consumers can also feel the pressure through tighter financial conditions.
And there’s another problem:
Inflation expectations are rising again.
If inflation stays stubborn, central banks could be forced to keep rates higher for longer—or potentially tighten further—even as economies struggle with elevated borrowing costs.
That creates a dangerous combination:
Higher yields.
Higher debt-servicing costs.
Persistent inflation.
Tighter liquidity.
More pressure on risk assets.
Global markets are entering a critical phase.
The bond market is sending a warning.
Pay attention.
Something serious is happening across global debt markets.
Bond yields in the US, Japan, France, and the UK are pushing toward levels not seen in decades.
Higher yields mean governments face increasingly expensive borrowing costs, while businesses and consumers can also feel the pressure through tighter financial conditions.
And there’s another problem:
Inflation expectations are rising again.
If inflation stays stubborn, central banks could be forced to keep rates higher for longer—or potentially tighten further—even as economies struggle with elevated borrowing costs.
That creates a dangerous combination:
Higher yields.
Higher debt-servicing costs.
Persistent inflation.
Tighter liquidity.
More pressure on risk assets.
Global markets are entering a critical phase.
The bond market is sending a warning.
Pay attention.
SOMEONE IS CLEARLY DEFENDING THE $65,000–$66,000 ZONE ON $BTC
Bitcoin continues to face heavy selling pressure every time price pushes toward this region.
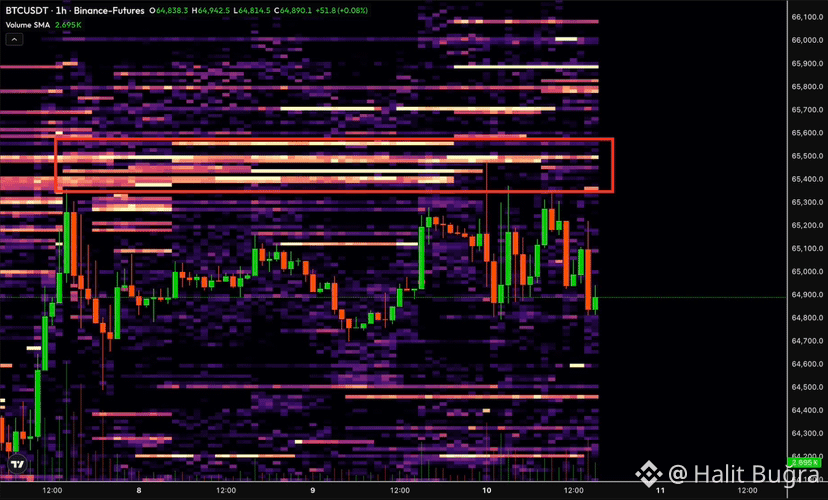
The liquidity heatmap shows a massive concentration of orders stacked between $65K and $66K, turning this area into the main battlefield for bulls and bears.
Multiple attempts to move higher have been rejected, suggesting sellers are aggressively protecting this resistance.
A clean breakout and hold above $66K could trigger liquidity and open the door for a much stronger upside move.
But until that happens, BTC remains trapped below a serious wall of resistance.
$65K–$66K is the zone to watch.
Break it, and things could get explosive.
Bitcoin continues to face heavy selling pressure every time price pushes toward this region.
The liquidity heatmap shows a massive concentration of orders stacked between $65K and $66K, turning this area into the main battlefield for bulls and bears.
Multiple attempts to move higher have been rejected, suggesting sellers are aggressively protecting this resistance.
A clean breakout and hold above $66K could trigger liquidity and open the door for a much stronger upside move.
But until that happens, BTC remains trapped below a serious wall of resistance.
$65K–$66K is the zone to watch.
Break it, and things could get explosive.
A WHALE JUST BOUGHT $86 MILLION WORTH OF $BTC , SIGNALING SERIOUS CONFIDENCE FROM BIG MONEY.
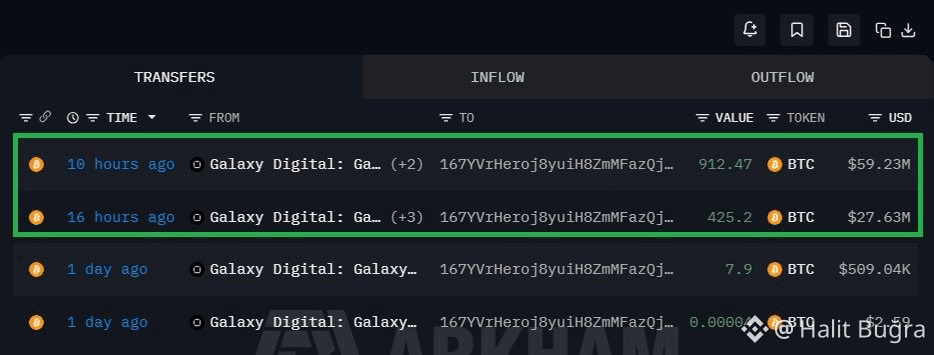
Large-scale accumulation like this can grab the market’s attention fast. When whales deploy this level of capital, it often suggests they are positioning for a bigger move rather than focusing on short-term volatility.
Bitcoin continues to attract deep liquidity, and major buyers appear willing to build exposure at current levels.
Strong whale activity can also reduce available supply while increasing pressure on the market if demand continues to expand.
The key now is whether Bitcoin can maintain its structure and turn this accumulation into sustained momentum.
Big money is positioning.
The next bull run could be closer than the market expects.
Large-scale accumulation like this can grab the market’s attention fast. When whales deploy this level of capital, it often suggests they are positioning for a bigger move rather than focusing on short-term volatility.
Bitcoin continues to attract deep liquidity, and major buyers appear willing to build exposure at current levels.
Strong whale activity can also reduce available supply while increasing pressure on the market if demand continues to expand.
The key now is whether Bitcoin can maintain its structure and turn this accumulation into sustained momentum.
Big money is positioning.
The next bull run could be closer than the market expects.
CRYPTO IS NOW THE MOST MISPRICED ASSET CLASS IN THE MARKET.
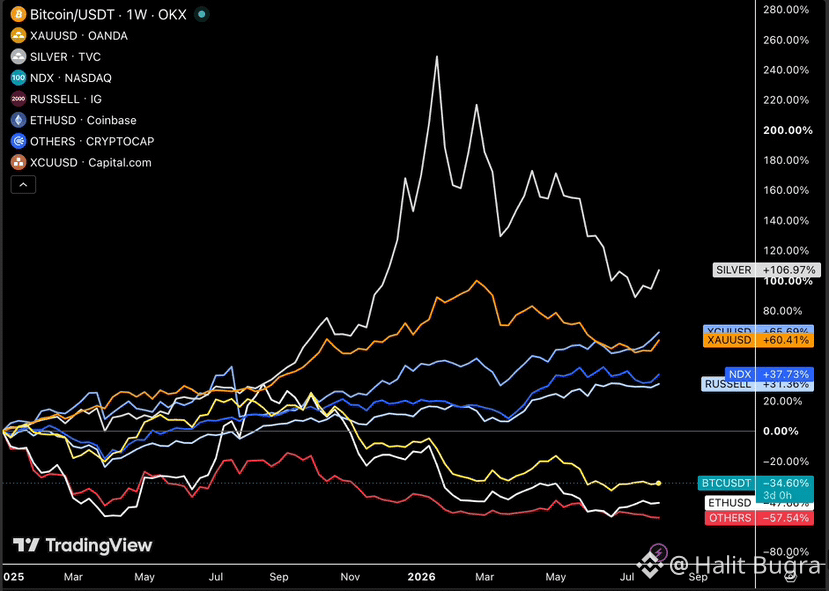
Since January 2025, almost every major asset class has delivered strong returns while crypto has moved in the opposite direction.
Silver has climbed +107%.
Copper is up +66%.
Gold has gained +60%.
The Nasdaq has returned +38%.
The Russell 2000 has added +31%.
Meanwhile, the crypto market has been under relentless pressure.
$BTC is down 35%.
$ETH has fallen 47%.
Altcoins have lost an average of 57%.
That gap is impossible to ignore.
While traditional assets have already enjoyed strong rallies, crypto has spent this period resetting valuations, shaking out weak hands, and testing investor conviction.
History shows that markets often move in cycles.
The strongest opportunities usually appear when an asset class is deeply out of favor, not when everyone is already chasing it.
If liquidity continues improving and market sentiment shifts, crypto could be one of the biggest beneficiaries of capital rotation.
The biggest gains rarely come from buying what has already doubled.
They often come from accumulating what the market has overlooked.
Crypto may be the weakest performer since January 2025, but that is exactly why many investors believe it could become one of the strongest performers in the next phase of the cycle.
Since January 2025, almost every major asset class has delivered strong returns while crypto has moved in the opposite direction.
Silver has climbed +107%.
Copper is up +66%.
Gold has gained +60%.
The Nasdaq has returned +38%.
The Russell 2000 has added +31%.
Meanwhile, the crypto market has been under relentless pressure.
$BTC is down 35%.
$ETH has fallen 47%.
Altcoins have lost an average of 57%.
That gap is impossible to ignore.
While traditional assets have already enjoyed strong rallies, crypto has spent this period resetting valuations, shaking out weak hands, and testing investor conviction.
History shows that markets often move in cycles.
The strongest opportunities usually appear when an asset class is deeply out of favor, not when everyone is already chasing it.
If liquidity continues improving and market sentiment shifts, crypto could be one of the biggest beneficiaries of capital rotation.
The biggest gains rarely come from buying what has already doubled.
They often come from accumulating what the market has overlooked.
Crypto may be the weakest performer since January 2025, but that is exactly why many investors believe it could become one of the strongest performers in the next phase of the cycle.
Verified
$650 BILLION HAS BEEN ADDED TO THE STOCK MARKET AFTER A MAJOR ECONOMIC SURPRISE.
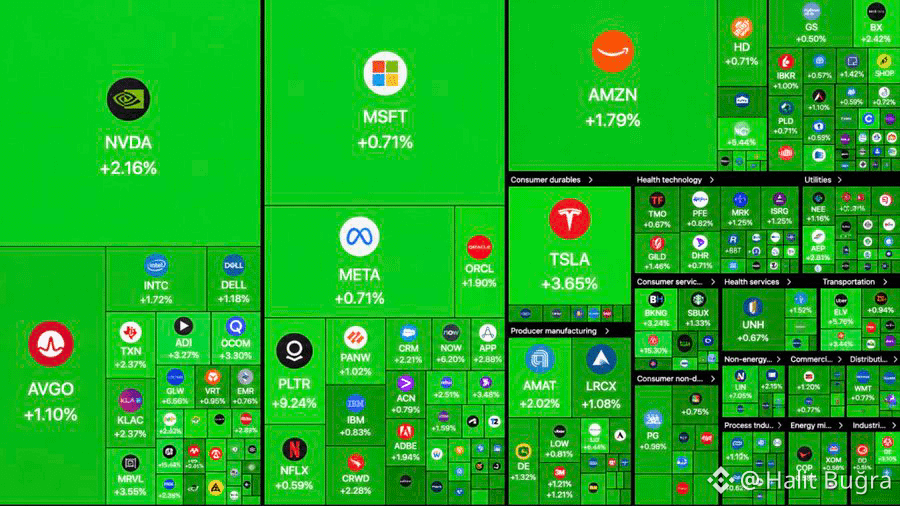
U.S. Nonfarm Payrolls came in 103,000 jobs below expectations, triggering a strong rally across the stock market as investors quickly adjusted their outlook for Federal Reserve policy.
A weaker-than-expected jobs report reduces concerns that the Fed will continue raising interest rates.
As a result, markets began pricing in a higher chance of rates remaining unchanged or eventually moving lower.
That shift in expectations pushed buyers back into equities, especially large-cap technology and growth stocks, which tend to benefit from lower borrowing costs and improved liquidity.
Roughly $650 billion in market value was added as optimism returned.
The move reflected renewed confidence that financial conditions may become more supportive in the months ahead.
Bond yields also eased, helping strengthen risk appetite across the market.
Investors viewed the payroll data as a sign that inflation pressures could continue cooling without severely damaging economic growth.
Markets will now turn their attention to upcoming inflation data and future Federal Reserve comments.
If inflation continues to moderate, expectations for easier monetary policy could grow even stronger.
For now, the payroll surprise has shifted momentum back toward the bulls, reminding investors that a single economic report can quickly reshape market expectations and drive powerful moves across global financial markets.
U.S. Nonfarm Payrolls came in 103,000 jobs below expectations, triggering a strong rally across the stock market as investors quickly adjusted their outlook for Federal Reserve policy.
A weaker-than-expected jobs report reduces concerns that the Fed will continue raising interest rates.
As a result, markets began pricing in a higher chance of rates remaining unchanged or eventually moving lower.
That shift in expectations pushed buyers back into equities, especially large-cap technology and growth stocks, which tend to benefit from lower borrowing costs and improved liquidity.
Roughly $650 billion in market value was added as optimism returned.
The move reflected renewed confidence that financial conditions may become more supportive in the months ahead.
Bond yields also eased, helping strengthen risk appetite across the market.
Investors viewed the payroll data as a sign that inflation pressures could continue cooling without severely damaging economic growth.
Markets will now turn their attention to upcoming inflation data and future Federal Reserve comments.
If inflation continues to moderate, expectations for easier monetary policy could grow even stronger.
For now, the payroll surprise has shifted momentum back toward the bulls, reminding investors that a single economic report can quickly reshape market expectations and drive powerful moves across global financial markets.
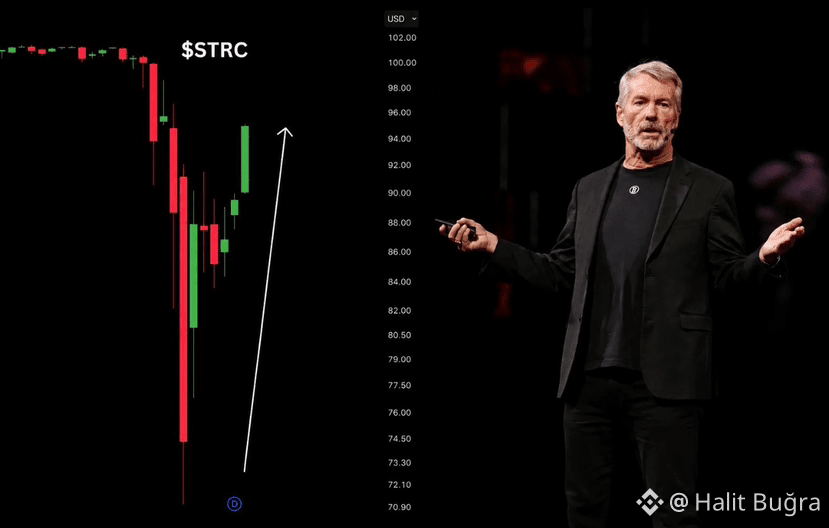
BREAKING: STRATEGY’S $STRC HAS SURGED TO A NEW 51-DAY HIGH OF 94.60, SIGNALING GROWING INVESTOR CONFIDENCE.
This move reflects continued demand for Strategy’s preferred equity and reinforces positive sentiment surrounding the company’s Bitcoin-focused treasury strategy.
As capital continues flowing into Strategy-related products, the market is once again recognizing strong institutional confidence in long-term Bitcoin exposure.
Historically, strength across Strategy’s financial instruments has often aligned with improving sentiment toward Bitcoin, as investors view the company as one of the largest corporate proxies for $BTC
If this momentum continues, it could further support Bitcoin’s bullish outlook by highlighting sustained institutional appetite despite broader market volatility.
The market will now be watching whether this strength translates into renewed buying pressure across Bitcoin and the wider crypto sector.
This move reflects continued demand for Strategy’s preferred equity and reinforces positive sentiment surrounding the company’s Bitcoin-focused treasury strategy.
As capital continues flowing into Strategy-related products, the market is once again recognizing strong institutional confidence in long-term Bitcoin exposure.
Historically, strength across Strategy’s financial instruments has often aligned with improving sentiment toward Bitcoin, as investors view the company as one of the largest corporate proxies for $BTC
If this momentum continues, it could further support Bitcoin’s bullish outlook by highlighting sustained institutional appetite despite broader market volatility.
The market will now be watching whether this strength translates into renewed buying pressure across Bitcoin and the wider crypto sector.
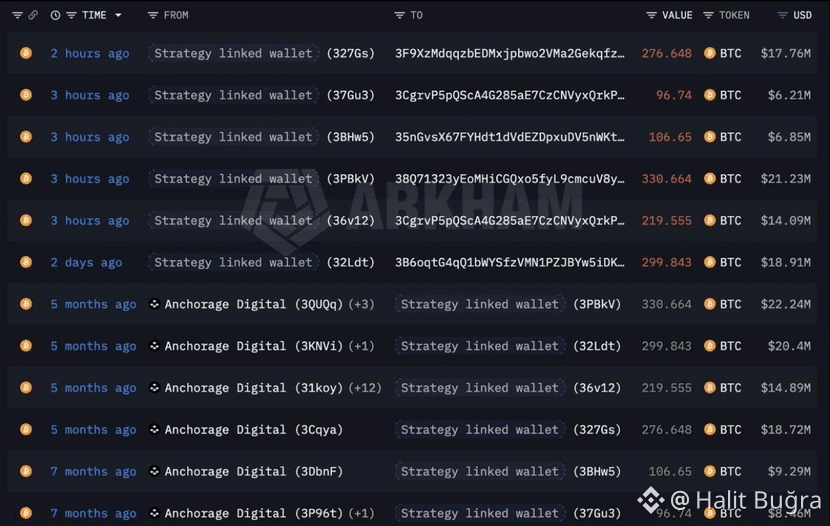
1,030 BTC WORTH APPROXIMATELY $66.14 MILLION MOVED FROM WALLETS LINKED TO STRATEGY.
Blockchain tracking data shows that 1,030 BTC, valued at approximately $66.14 million at the time of the transfer, was moved from wallets associated with Strategy around two hours ago.
Large Bitcoin transfers involving wallets linked to major corporate holders often attract close attention from traders and analysts. However, an on-chain transfer alone does not indicate whether Bitcoin has been sold, purchased, or simply moved between internal wallets.
Companies and institutions regularly reorganize custody arrangements, strengthen security, consolidate holdings, or transfer assets between storage providers. Without an official statement or supporting evidence, the purpose of this transaction cannot be confirmed.
As always, it is important to distinguish between blockchain activity and market conclusions. Monitoring follow-up wallet movements and official disclosures provides a clearer picture than relying on a single transaction.
This post is for informational and educational purposes only. Always perform your own research before making financial decisions.
Blockchain tracking data shows that 1,030 BTC, valued at approximately $66.14 million at the time of the transfer, was moved from wallets associated with Strategy around two hours ago.
Large Bitcoin transfers involving wallets linked to major corporate holders often attract close attention from traders and analysts. However, an on-chain transfer alone does not indicate whether Bitcoin has been sold, purchased, or simply moved between internal wallets.
Companies and institutions regularly reorganize custody arrangements, strengthen security, consolidate holdings, or transfer assets between storage providers. Without an official statement or supporting evidence, the purpose of this transaction cannot be confirmed.
As always, it is important to distinguish between blockchain activity and market conclusions. Monitoring follow-up wallet movements and official disclosures provides a clearer picture than relying on a single transaction.
This post is for informational and educational purposes only. Always perform your own research before making financial decisions.
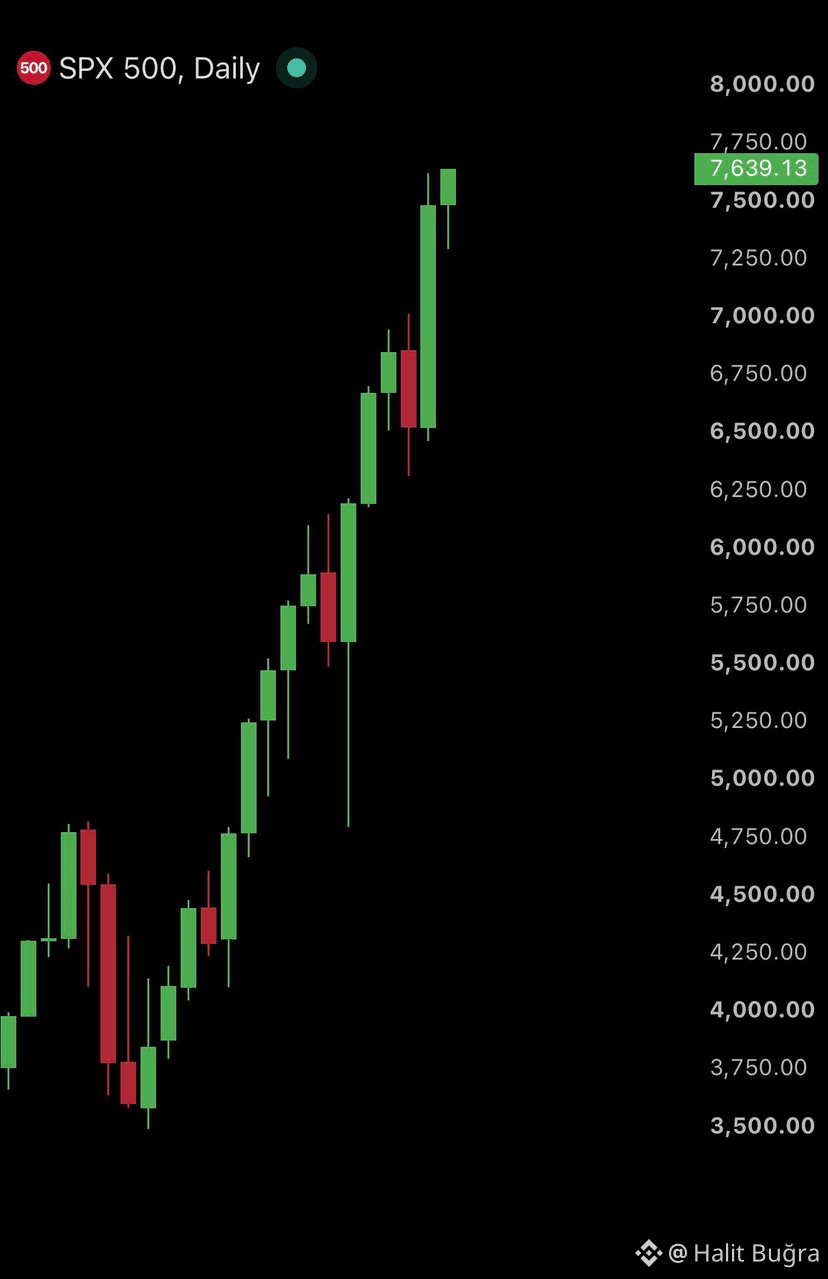
SPX 500 IS CONTINUING TO SHOW STRONG BULLISH MOMENTUM.
The daily chart remains firmly in an uptrend, with buyers maintaining complete control. After a brief pullback, price quickly recovered and printed another powerful bullish candle, confirming that demand continues to outweigh selling pressure.
The recent correction was shallow and failed to break the overall market structure, which is a sign of trend strength. Instead of triggering a deeper reversal, buyers stepped back in and pushed the index toward fresh highs.
As long as the previous higher low holds, the bullish structure remains intact. Momentum continues to favor the upside, and every healthy retracement is being met with renewed buying interest.
Key Levels
* Resistance: 7,700–7,750
* Major Resistance: 8,000
* Support: 7,450–7,500
* Strong Support: 7,250
A sustained move above 7,700 could open the door for another leg higher toward the 8,000 psychological level. However, traders should continue monitoring support zones, as maintaining these levels is essential for the current bullish trend to remain valid.
The trend remains positive until price begins forming lower highs and lower lows on the daily timeframe. At the moment, buyers continue to hold the advantage.
The daily chart remains firmly in an uptrend, with buyers maintaining complete control. After a brief pullback, price quickly recovered and printed another powerful bullish candle, confirming that demand continues to outweigh selling pressure.
The recent correction was shallow and failed to break the overall market structure, which is a sign of trend strength. Instead of triggering a deeper reversal, buyers stepped back in and pushed the index toward fresh highs.
As long as the previous higher low holds, the bullish structure remains intact. Momentum continues to favor the upside, and every healthy retracement is being met with renewed buying interest.
Key Levels
* Resistance: 7,700–7,750
* Major Resistance: 8,000
* Support: 7,450–7,500
* Strong Support: 7,250
A sustained move above 7,700 could open the door for another leg higher toward the 8,000 psychological level. However, traders should continue monitoring support zones, as maintaining these levels is essential for the current bullish trend to remain valid.
The trend remains positive until price begins forming lower highs and lower lows on the daily timeframe. At the moment, buyers continue to hold the advantage.
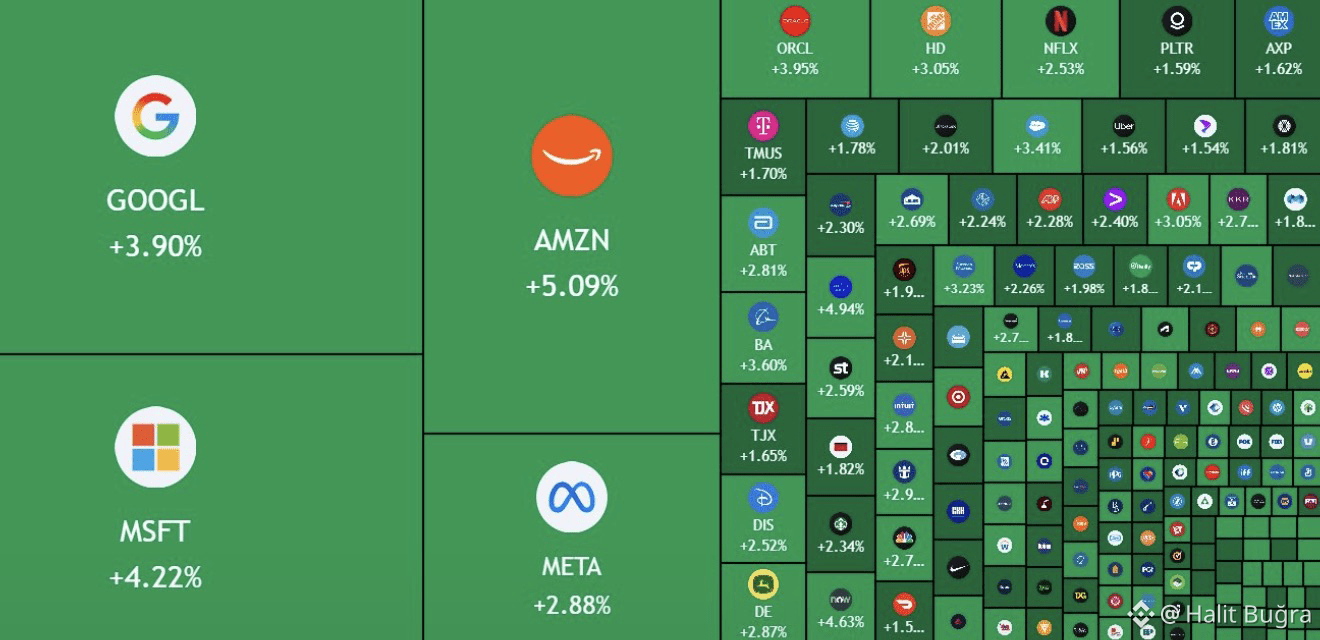
$500 BILLION FLOODS INTO THE U.S. STOCK MARKET AS THE OPENING BELL RINGS.
Oil crashing below $78 has sparked a powerful wave of risk-on momentum, sending capital rushing back into equities.
Markets are moving fast, and investors are wasting no time positioning for the next leg higher.
When energy prices fall, liquidity often finds its way into stocks. Today’s open is proving exactly that.
Momentum is building. The question now is whether this is just the beginning of an even bigger rally.
Oil crashing below $78 has sparked a powerful wave of risk-on momentum, sending capital rushing back into equities.
Markets are moving fast, and investors are wasting no time positioning for the next leg higher.
When energy prices fall, liquidity often finds its way into stocks. Today’s open is proving exactly that.
Momentum is building. The question now is whether this is just the beginning of an even bigger rally.
Log in to explore more content