
Cryptoniteuae
3.2k Posts

Cryptoniteuae
 Square Verified+
Report
Block User
Follow CryptoniteUAE for insights on web3 entrepreneurship and innovation. We showcase the latest projects, news & aim to foster a community of web3 enthusiasts

Top Voices

Level 1 Creator
2 Following
109.1K+ Followers
18.2K+ Liked
2 Badges
Posts
All
Quotes
Videos
Live
Article
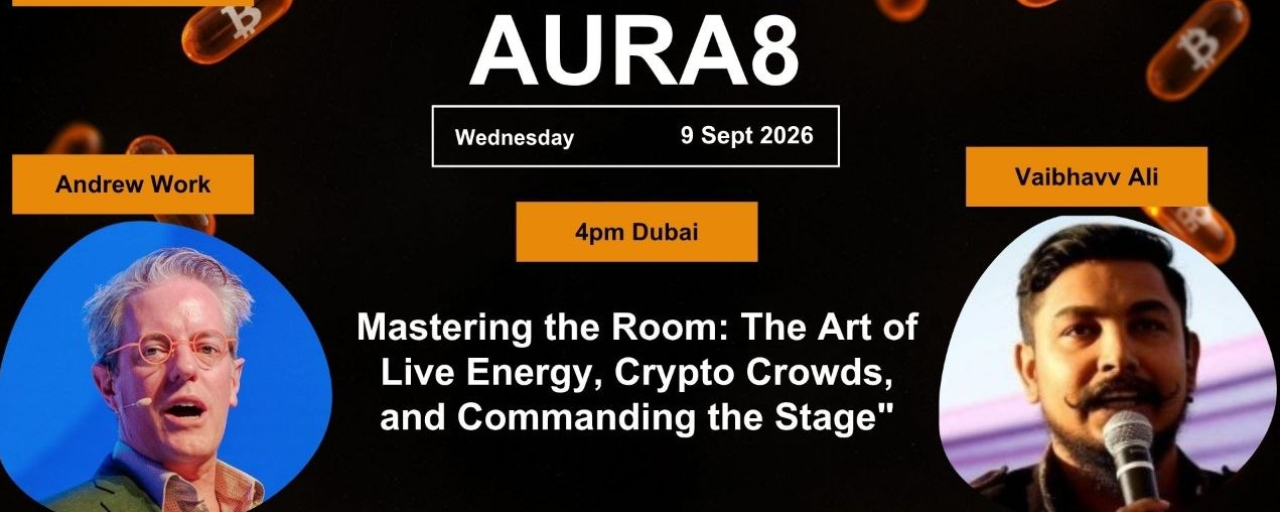
Mastering the Room: Andrew Work on Token2049Mastering the room – Vaibhavv Ali first clocked the glasses at WoW Summit in Hong Kong, then again on the Token2049 stage. Same frames. Same voice. Same job: keep a technical conference from going flat. On Aura 8 Episode 90 he brought on Andrew Work, main-stage MC for Token2049, to talk about how that job is actually done.
Andrew is not a protocol founder. People still walk up and pitch him as if he writes checks. The glasses come off when he does not want to be the conduit
The person holding the Token2049 microphone is not there to be the star. He is there to get the guest on stage in the state they need notes, silence, or a shout in Québécois French and to keep 25,000 people in one tempo. Andrew’s path is kindergarten narrator → Canadian school speeches → politics with no mic in front of 800 people → a Hong Kong free-market think tank → a 2006–2009 fintech shop that drifted into ICOs → Token. Crypto, he said, “comes very naturally” if you have spent a career talking about less government, lower taxes, and fewer rules. The industry did not stay that pure. The posture still maps.
Practice is the other thesis. Jonathan Cheng, Wall Street Journal Beijing bureau chief, was “fantastic” at Asia Society on book event number 43. That is the standard Andrew pointed at: take the room every time you are offered it.Aura8 Ep90
How a kindergarten narrator ends up on the Token main stage
Deep cut first. He was the only kid in the Christmas play who could read. Book in hand, side of the stage, loud. Canadian schools then forced an annual speech whether you wanted it or not. Friends noticed. Politics required holding 800 people with no microphone and four policy points. Comfort in a crowd becomes a rumor. The rumor becomes bookings.
The crypto door was not ideological purity. It was a company that ran fintech from 2006 to 2009, then helped people with ICOs “when that was a thing,” through just before COVID. Parallel track: he founded a free-market think tank in Hong Kong less state in the economy, lower taxes, less regulation. Early crypto’s anti-central-bank story sat on that same shelf. “Now it hasn’t necessarily gone that way,” he said. The mental model still works.
Day job today is not in the space. Stage job is.
The glasses problem
At Token2049, founders treat the MC as a hallway into capital. They have seen him standing next to people who already raised. So they pitch. His countermeasure is almost comic: don’t wear the glasses if he wants to walk the floor unrecognized. The frames are the brand. Remove them and the conduit closes.
Backstage is the real job
Ali asked how you read a speaker in the green room. Andrew’s rule is not Myers-Briggs. It is: what do they need to walk out and do their best?
Some want the brief, then silence and notes. Some want “what’s your name, where are you from.” He goes with the guest. If there is a real bond, he uses it. Token2049 Dubai, Georges St-Pierre backstage two-division UFC champion out of Quebec. Andrew hit him in heavy Canadian French. GSP did not see it coming. Hometown language as a reset, not a bit.
The MC’s ego stays off the rundown. “My job is not to be the star.”
Script versus room
Token is not a teleprompter show. Other events are. The producers he works with know he does not run every word from a page. He still has to know the rundown cold. Ali’s contrast was the Aura 8 format text Ben Goertzel, get the godfather of AGI on with Michael Terpin in the same hour. A 25,000-person main stage does not give you that slack. Improvisation is connecting the audience to the guest inside the slot, not inventing a fourth segment.
Favorites: GSP, Ricciardo, Vernon Smith, Arthur Hayes
Asked what the world should know that Ali did not ask:
Georges St-Pierre the introduction, and the backstage French.Daniel Ricciardo at Token2049 he put “a lot of love and attention and care” into the intro. Ricciardo came back the next year and talked about that intro the moment he sat down.Vernon Smith, Nobel economist a full hour one-on-one after the 2008 crisis, for a man who had built a free-market think tank. “Extraordinary.”Last year’s Token peak, personal: Arthur Hayes. Brilliant backstage. Do not bet against him. Economics that is how the world works, not a textbook. Energy and insight that “float the boat” of someone who still thinks like an economist.
Singapore in under 30 days
Token2049, he said, keeps getting bigger. 25,000 people a year. Biggest on the planet now. He had not had the full briefing yet. Lineups he had seen were already “epic.” Calendar: less than thirty days out from the 2026 Singapore edition when they recorded. Ali’s close: see you there.
The closer for anyone still deciding whether to take a stage: opportunity cost is real. Grab it. Stage fright is the actual fear. Worst case, you met it. Cheng’s 43rd book event is what “so good” looks like after reps.
Key takeaways
The Token main-stage job is guest-state management, not personal brand.Andrew is crypto-adjacent by ideology and ICO-era work, not by token. The glasses are how the floor finds him; he takes them off to disappear.Read the green room for need, not personality type. Use a real bond if you have one.No word-for-word script. Full command of the rundown. You are not the star.Career highlights sit at the intersection of craft and rooms you would not otherwise enter: GSP, Ricciardo, Vernon Smith, Hayes.Token2049 Singapore 2026: 25k, still scaling. Take every room you are offered.
#Token2049 #mcandrewwork #vaibhavvali #cryptoniteuae #AURA8
Mastering the Room: Andrew Work on Token2049
Mastering the room – Vaibhavv Ali first clocked the glasses at WoW Summit in Hong Kong, then again on the Token2049 stage. Same frames. Same voice. Same job: keep a technical conference from going flat. On Aura 8 Episode 90 he brought on Andrew Work, main-stage MC for Token2049, to talk about how that job is actually done.
Andrew is not a protocol founder. People still walk up and pitch him as if he writes checks. The glasses come off when he does not want to be the conduit
The person holding the Token2049 microphone is not there to be the star. He is there to get the guest on stage in the state they need notes, silence, or a shout in Québécois French and to keep 25,000 people in one tempo. Andrew’s path is kindergarten narrator → Canadian school speeches → politics with no mic in front of 800 people → a Hong Kong free-market think tank → a 2006–2009 fintech shop that drifted into ICOs → Token. Crypto, he said, “comes very naturally” if you have spent a career talking about less government, lower taxes, and fewer rules. The industry did not stay that pure. The posture still maps.
Practice is the other thesis. Jonathan Cheng, Wall Street Journal Beijing bureau chief, was “fantastic” at Asia Society on book event number 43. That is the standard Andrew pointed at: take the room every time you are offered it.Aura8 Ep90
How a kindergarten narrator ends up on the Token main stage
Deep cut first. He was the only kid in the Christmas play who could read. Book in hand, side of the stage, loud. Canadian schools then forced an annual speech whether you wanted it or not. Friends noticed. Politics required holding 800 people with no microphone and four policy points. Comfort in a crowd becomes a rumor. The rumor becomes bookings.
The crypto door was not ideological purity. It was a company that ran fintech from 2006 to 2009, then helped people with ICOs “when that was a thing,” through just before COVID. Parallel track: he founded a free-market think tank in Hong Kong less state in the economy, lower taxes, less regulation. Early crypto’s anti-central-bank story sat on that same shelf. “Now it hasn’t necessarily gone that way,” he said. The mental model still works.
Day job today is not in the space. Stage job is.
The glasses problem
At Token2049, founders treat the MC as a hallway into capital. They have seen him standing next to people who already raised. So they pitch. His countermeasure is almost comic: don’t wear the glasses if he wants to walk the floor unrecognized. The frames are the brand. Remove them and the conduit closes.
Backstage is the real job
Ali asked how you read a speaker in the green room. Andrew’s rule is not Myers-Briggs. It is: what do they need to walk out and do their best?
Some want the brief, then silence and notes. Some want “what’s your name, where are you from.” He goes with the guest. If there is a real bond, he uses it. Token2049 Dubai, Georges St-Pierre backstage two-division UFC champion out of Quebec. Andrew hit him in heavy Canadian French. GSP did not see it coming. Hometown language as a reset, not a bit.
The MC’s ego stays off the rundown. “My job is not to be the star.”
Script versus room
Token is not a teleprompter show. Other events are. The producers he works with know he does not run every word from a page. He still has to know the rundown cold. Ali’s contrast was the Aura 8 format text Ben Goertzel, get the godfather of AGI on with Michael Terpin in the same hour. A 25,000-person main stage does not give you that slack. Improvisation is connecting the audience to the guest inside the slot, not inventing a fourth segment.
Favorites: GSP, Ricciardo, Vernon Smith, Arthur Hayes
Asked what the world should know that Ali did not ask:
Georges St-Pierre the introduction, and the backstage French.Daniel Ricciardo at Token2049 he put “a lot of love and attention and care” into the intro. Ricciardo came back the next year and talked about that intro the moment he sat down.Vernon Smith, Nobel economist a full hour one-on-one after the 2008 crisis, for a man who had built a free-market think tank. “Extraordinary.”Last year’s Token peak, personal: Arthur Hayes. Brilliant backstage. Do not bet against him. Economics that is how the world works, not a textbook. Energy and insight that “float the boat” of someone who still thinks like an economist.
Singapore in under 30 days
Token2049, he said, keeps getting bigger. 25,000 people a year. Biggest on the planet now. He had not had the full briefing yet. Lineups he had seen were already “epic.” Calendar: less than thirty days out from the 2026 Singapore edition when they recorded. Ali’s close: see you there.
The closer for anyone still deciding whether to take a stage: opportunity cost is real. Grab it. Stage fright is the actual fear. Worst case, you met it. Cheng’s 43rd book event is what “so good” looks like after reps.
Key takeaways
The Token main-stage job is guest-state management, not personal brand.Andrew is crypto-adjacent by ideology and ICO-era work, not by token. The glasses are how the floor finds him; he takes them off to disappear.Read the green room for need, not personality type. Use a real bond if you have one.No word-for-word script. Full command of the rundown. You are not the star.Career highlights sit at the intersection of craft and rooms you would not otherwise enter: GSP, Ricciardo, Vernon Smith, Hayes.Token2049 Singapore 2026: 25k, still scaling. Take every room you are offered.
#Token2049 #mcandrewwork #vaibhavvali #cryptoniteuae #AURA8
Andrew is not a protocol founder. People still walk up and pitch him as if he writes checks. The glasses come off when he does not want to be the conduit
The person holding the Token2049 microphone is not there to be the star. He is there to get the guest on stage in the state they need notes, silence, or a shout in Québécois French and to keep 25,000 people in one tempo. Andrew’s path is kindergarten narrator → Canadian school speeches → politics with no mic in front of 800 people → a Hong Kong free-market think tank → a 2006–2009 fintech shop that drifted into ICOs → Token. Crypto, he said, “comes very naturally” if you have spent a career talking about less government, lower taxes, and fewer rules. The industry did not stay that pure. The posture still maps.
Practice is the other thesis. Jonathan Cheng, Wall Street Journal Beijing bureau chief, was “fantastic” at Asia Society on book event number 43. That is the standard Andrew pointed at: take the room every time you are offered it.Aura8 Ep90
How a kindergarten narrator ends up on the Token main stage
Deep cut first. He was the only kid in the Christmas play who could read. Book in hand, side of the stage, loud. Canadian schools then forced an annual speech whether you wanted it or not. Friends noticed. Politics required holding 800 people with no microphone and four policy points. Comfort in a crowd becomes a rumor. The rumor becomes bookings.
The crypto door was not ideological purity. It was a company that ran fintech from 2006 to 2009, then helped people with ICOs “when that was a thing,” through just before COVID. Parallel track: he founded a free-market think tank in Hong Kong less state in the economy, lower taxes, less regulation. Early crypto’s anti-central-bank story sat on that same shelf. “Now it hasn’t necessarily gone that way,” he said. The mental model still works.
Day job today is not in the space. Stage job is.
The glasses problem
At Token2049, founders treat the MC as a hallway into capital. They have seen him standing next to people who already raised. So they pitch. His countermeasure is almost comic: don’t wear the glasses if he wants to walk the floor unrecognized. The frames are the brand. Remove them and the conduit closes.
Backstage is the real job
Ali asked how you read a speaker in the green room. Andrew’s rule is not Myers-Briggs. It is: what do they need to walk out and do their best?
Some want the brief, then silence and notes. Some want “what’s your name, where are you from.” He goes with the guest. If there is a real bond, he uses it. Token2049 Dubai, Georges St-Pierre backstage two-division UFC champion out of Quebec. Andrew hit him in heavy Canadian French. GSP did not see it coming. Hometown language as a reset, not a bit.
The MC’s ego stays off the rundown. “My job is not to be the star.”
Script versus room
Token is not a teleprompter show. Other events are. The producers he works with know he does not run every word from a page. He still has to know the rundown cold. Ali’s contrast was the Aura 8 format text Ben Goertzel, get the godfather of AGI on with Michael Terpin in the same hour. A 25,000-person main stage does not give you that slack. Improvisation is connecting the audience to the guest inside the slot, not inventing a fourth segment.
Favorites: GSP, Ricciardo, Vernon Smith, Arthur Hayes
Asked what the world should know that Ali did not ask:
Georges St-Pierre the introduction, and the backstage French.Daniel Ricciardo at Token2049 he put “a lot of love and attention and care” into the intro. Ricciardo came back the next year and talked about that intro the moment he sat down.Vernon Smith, Nobel economist a full hour one-on-one after the 2008 crisis, for a man who had built a free-market think tank. “Extraordinary.”Last year’s Token peak, personal: Arthur Hayes. Brilliant backstage. Do not bet against him. Economics that is how the world works, not a textbook. Energy and insight that “float the boat” of someone who still thinks like an economist.
Singapore in under 30 days
Token2049, he said, keeps getting bigger. 25,000 people a year. Biggest on the planet now. He had not had the full briefing yet. Lineups he had seen were already “epic.” Calendar: less than thirty days out from the 2026 Singapore edition when they recorded. Ali’s close: see you there.
The closer for anyone still deciding whether to take a stage: opportunity cost is real. Grab it. Stage fright is the actual fear. Worst case, you met it. Cheng’s 43rd book event is what “so good” looks like after reps.
Key takeaways
The Token main-stage job is guest-state management, not personal brand.Andrew is crypto-adjacent by ideology and ICO-era work, not by token. The glasses are how the floor finds him; he takes them off to disappear.Read the green room for need, not personality type. Use a real bond if you have one.No word-for-word script. Full command of the rundown. You are not the star.Career highlights sit at the intersection of craft and rooms you would not otherwise enter: GSP, Ricciardo, Vernon Smith, Hayes.Token2049 Singapore 2026: 25k, still scaling. Take every room you are offered.
#Token2049 #mcandrewwork #vaibhavvali #cryptoniteuae #AURA8
86
Well I think what is important to do about revenue streams is that the old more traditional ways of just account subscription or subscription associated with…
Aura 8 — full episode on our channel.
$AURA #aura8 #automation #AI #AGI
Well I think what is important to do about revenue streams is that the old more traditional ways of just account subscription or subscription associated with…
Aura 8 — full episode on our channel.
$AURA #aura8 #automation #AI #AGI
Aura 8 — full episode on our channel.
$AURA #aura8 #automation #AI #AGI
146
A couple of years later now, it's been a bear market. Funding is not in abundance and so the kind of grants that are being given out now are very different.
Aura 8 — full episode on our channel.
$AURA #aura8 #community #web3 #markets
A couple of years later now, it's been a bear market. Funding is not in abundance and so the kind of grants that are being given out now are very different.
Aura 8 — full episode on our channel.
$AURA #aura8 #community #web3 #markets
Aura 8 — full episode on our channel.
$AURA #aura8 #community #web3 #markets
223
When I've been in conversations, even in the capital-raised side about it, people have this automatic assumption that I am against a live nation or against…
Aura 8 — full episode on our channel.
$AURA #aura8 #automation #crypto #web3
When I've been in conversations, even in the capital-raised side about it, people have this automatic assumption that I am against a live nation or against…
Aura 8 — full episode on our channel.
$AURA #aura8 #automation #crypto #web3
Aura 8 — full episode on our channel.
$AURA #aura8 #automation #crypto #web3
141
Log in to explore more content
Join global crypto users on Binance Square
⚡️ Get latest and useful information about crypto.
💬 Trusted by the world’s largest crypto exchange.
👍 Discover real insights from verified creators.
Email / Phone number
Trending Topics
AppleDebutsFoldablePhone
22,708 views
461 Discussing
Apple just dropped the foldable iPhone — and the market is paying attention. This isn't just another product cycle; it's a new product category, a new CEO on stage, and a $1,999 price tag that pushes $AAPL further into ultra-premium territory. Foldables are the narrative, and Apple is now the headline.
#appledebutsfoldablephone #EUExtendsCentralContactPointToCASPs #US10YTreasuryYieldHitsHighestSinceNov2023 #BrentCrudeTops$100 #USTreasuryToBuyBackUpTo$6BLongDatedDebt
KimHotbae
·2 Likes
·2.6k views
IranSaysReadyToEscalateWarWithUS
1,413 views
66 Discussing
EUExtendsCentralContactPointToCASPs
5,545 views
161 Discussing